U.S. Personal Spending Picks Up & Income Growth Firms in September
Individuals remain inclined to spend, but price inflation continued to eat into the real value of both spending & income last month. The 0.6% increase (8.2% y/y) in personal consumption expenditures followed a like rise in August, revised from 0.4%. A 0.4% increase had been expected for September in the Action Economics Forecast Survey.
The nominal gain in spending was inflated by price inflation. The 0.3% rise (1.9% y/y) in real sending repeated the August rise. Real spending on durable goods edged 0.1% higher (7.9% y/y) last month as spending on motor vehicle & parts rose 0.9% (1.4% y/y) after improving 0.2% in August. (…)
Inflation remined firm last month. The PCE chain price index rose 0.3%, the same as in August. The 6.2% y/y rise also was steady but remained below the June peak of 7.0%. It was nearly the highest rate of price inflation in over 40 years. A 0.5% m/m increase in the price index less food & energy also replicated the August gain. The 5.1% y/y gain was the biggest rise since the autumn of 1983. Food & beverage prices were up another 0.6% (11.9% y/y). Energy prices, in contrast, slid 2.4% (+20.3% y/y), the third straight monthly drop.
A second consecutive 0.6% rise (5.3% y/y) in the services price index powered the overall gain, driven by a 2.1% jump (16.4% y/y) in transportation prices. Housing & utilities costs rose 0.8% (8.0% y/y), following a 0.9% gain. (…)
Personal income rose an expected 0.4% (5.2% y/y) during September, the same as in the prior two months. The gain reflected a 0.6% rise (8.2% y/y) in wages & salaries, mirroring continued employment growth. (…)
The personal saving rate fell to 3.1% in September, nearly equaling the lowest rate since April 2008. The level of personal savings fell 8.5% and was 59.3% lower y/y.
Spending on Goods remains well above trend while spending on Services is slowly lifting toward its trendline.

On a quarterly basis, real expenditures rose 1.4% a.r. in Q3, after +2.0% in Q2 and +1.4% in Q1. Real Durables declined for the second quarter in a row. Real Services slowed to +2.8% a.r. in Q3 from +4.5% in Q2. Not a strong consumer, but neither a really weak one.

The Employment Cost Index rose at a 5.0% annualized rate in Q3 (private wages +4.7%) after +5.3% in Q2 (+6.3%) and 4.7% (4.8%) on average in the first half.

The Wages and Salaries component of personal income was up 0.6% in September after 0.55% on average in July/August. For all of Q3: +7.3% a.r. after +6.8% and 6.9% in Q1 and Q2 respectively.
Goldman Sachs’ composition-corrected wage tracker—which adjusts median weekly wages and average hourly earnings to control for workforce composition—now stands at +5.4% (YoY) in Q3 (vs. +5.5% in Q2). Its quarterly annualized composition-corrected wage tracker based on average hourly earnings and the Employment Cost Index stands at +5.2% (QoQ a.r) in Q3 (vs. +5.3% in Q2).
In all, labor costs look like they are cresting around +5%, maybe even softening a little.
PCE Services inflation (red bars below), intimately linked to wages, was +0.6% in each of August and September, +7.2% a.r., roughly in line with wages. Also cresting?
Actually, looked at quarterly data, PCE inflation is behaving encouragingly, hanging in around 4.5% with services inflation below 4.5%.

(…) Job postings on Indeed were 48.8% above their pre-pandemic baseline as of October 21, signaling vigorous hiring intentions. New job postings, those that have been on Indeed for seven days or less, also reflect a healthy appetite for new hires, coming in at 55% above their Feb 1, 2020 level. (…)
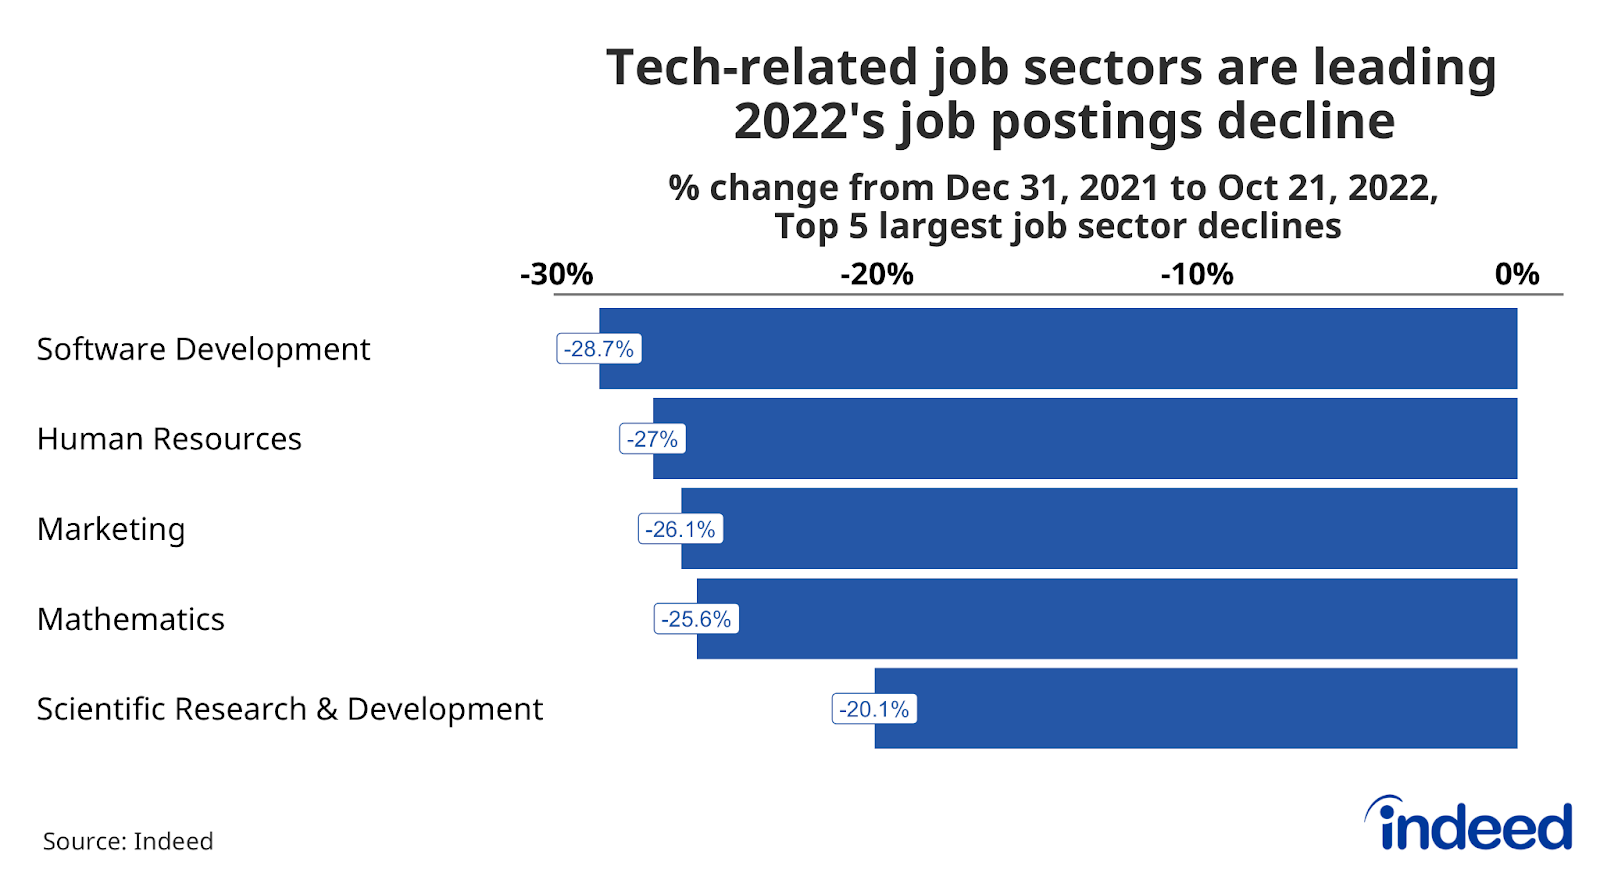
Job postings on Indeed have declined by about 9% from December 31, 2021, through October 21 of this year, but the reduction has been more severe in certain sectors. Software Development job postings have dropped quite a bit over the course of 2022 as tech companies rein in hiring plans. Other high-wage sectors friendly to remote work, such as Marketing and Mathematics, the latter of which includes many data science jobs, have pulled back sharply as well.
Several sectors related to the production (Production & Manufacturing), transportation, and storage (Loading & Stocking) of goods have also experienced notable downturns in postings. (…)
While each sector is unique, the general trend suggests that a large portion of the decline in job postings is coming from sectors where employer demand has been satiated or as companies rethink expansion plans. (…)
A cooldown centered in the pandemic’s hottest hiring sectors is more likely to result in a normalization of the labor market than a rapid withdrawal which induces a downturn. (…)
As I showed on October 10,
(…) this table of the last 2-month annualized wage growth rates far from suggests we are near a wage/price spiral (number on left is % of total employment):
- 0.4% Mining & Logging: ……………………….-1.4%
- 10.4% Retail Trade ……………………………… 0.5%
- 16.1% Education & Health Services: …………. 1.0%
- 14.7% Professional & Business Services: ……. 1.2%
- 8.4% Manufacturing: …………………………… 2.9%
- 10.4% Leisure & Hospitality : …………………… 3.6%
- 3.7% Other Services: ………………………….. 4.3%
- 5.0% Construction: …………………………….. 4.4%
- 4.2% Transportation & Warehousing: ………… 7.4%
- 5.9% Financial Activities: ……………………… 8.0%
- 2.0% Information: ……………………………… 14.5%
- 14.2% Governments: …………………………… 5.3% (July/August)
Employees accounting for 50% of total employment saw wage gains of less than 3.0% annualized in the last 2 months. The next 19%: less than 4.5%. Transportation and Warehousing wages should slow down (e.g. FDX, WMT, AMZN); Financial Services will suffer from the bear markets and Information will be impacted by the tech slowdown.
Indeed’s data indicate that demand for the higher wage growth sectors is slowing fast.
Credit-Card Debt Returns to Prepandemic Levels Record card issuance and increased spending helped push total card balances to $916 billion last month.
Total card balances in the U.S. hit $916 billion in September, nearly identical to December 2019 levels, according to the credit-reporting firm Equifax Inc. EFX 2.61%increase; green up pointing triangle Balances are up 9% from January and about 23% higher than their pandemic low in April 2021. (…)
Missed payments on credit cards, while rising, remain below prepandemic levels. (…) Consumers had credit-card debt of $5,529 on average in September. That figure has been rising but remains below its prepandemic peak, according to the credit-score provider VantageScore Solutions LLC.
At JPMorgan Chase & Co., credit-card balances that are carried from month to month increased 15% in the third quarter from a year prior, but they remain slightly below prepandemic levels. (…)
Flush Consumers Could Mean Higher Rates for Longer Consumers and businesses buoyed by pandemic-fueled savings are proving less sensitive to tighter credit, which means more work for the Fed.
(…) Household, nonfinancial corporate and small-business sectors ran a surplus of total income over total spending equal to 1.1% of gross domestic product in the quarter of April to June, according to economists at Goldman Sachs Group Inc. Using a three-year average, the measure is healthier than on the eve of any U.S. recession since the 1950s.
U.S. households still have around $1.7 trillion in savings they accumulated through mid-2021 above and beyond what they would have saved if income and spending had grown in line with the prepandemic economy, according to estimates by Fed economists. Around $350 billion in excess savings as of June were held by the lower half of the income distribution, or around $5,500 per household on average.
Businesses were also able to lock in lower borrowing costs as interest rates plumbed new lows in 2020 and 2021. Just 3% of junk bonds, or those issued by companies without investment-grade ratings, mature over the next year, and only 8% come due before 2025, according to Goldman Sachs.
State and local governments are also flush with cash, leaving them in a far better position than after the recession of 2007 to 2009. (…)
Natural-Gas Prices Have Plunged Into Autumn A big driver of inflation is down more than 40% in two months as U.S. inventories have swelled since air-conditioning season.
(…) The decline is due to warm autumn weather, record domestic production and gas-storage facilities that have filled up fast since the end of air-conditioning season. Now, one of the big drivers of inflation costs roughly the same as it did a year ago. (…)
Natural-gas futures for December delivery ended Friday at $5.684 per million British thermal units, just 4.75% higher than a year ago. Early last week, futures slipped below $5 for the first time since March, when energy markets were jolted by Russia’s invasion of Ukraine.
Permian Basin producers in recent days swamped the Waha trading hub in West Texas, pushing prices into negative territory. In some cash trades, sellers paid buyers more than $1 per million British thermal units to take away gas that was fetching more than $8 at the start of September, according to S&P Global Commodity Insights. (…)
Goldman Sachs analysts forecast that benchmark U.S. prices would average $5 per million British thermal units in 2023. BofA Securities anticipates $4.50. Through Friday, natural-gas futures this year have averaged about $6.60 per million British thermal units, straining not just household budgets but also the gas-consuming makers of materials ranging from steel and cement to plastic and fertilizer. (…)
Between Sept. 9 and Oct. 14, 571 billion cubic feet of gas were added to stockpiles, the biggest build ever over five weeks. The deficit to normal levels shrank by more than half. As of a week ago, the volume of gas in storage was within 5.5% of normal levels for this time of year, according to the Energy Information Administration. (…)
A really cold winter, however, like the frigid season of 2013-14, which sucked nearly 3 trillion cubic feet from storage, could push prices north of $10, he said.
U.S. Pending Home Sales Fall Sharply in September
The Pending Home Sales Index produced by the National Association of Realtors fell 10.2% (-31.0% y/y) to 79.5 in September following a 1.9% August decline. The September decline was the tenth decline in eleven months. Pending home sales have fallen 37.9% since the August 2020 high.
Pending home sales declined everywhere in the country last month. Sales in the Northeast fell 16.2% (-30.1% y/y) following a 3.4% August shortfall. In the West, sales declined 11.7% (-38.7% y/y) after rising 1.4% in August. Sales in the Midwest declined 8.8% (-26.7% y/y) in September after dropping 5.0% in August. Sales in the South fell 8.1% (-30.0% y/y) after a 0.8% August slip.
The pending home sales index measures sales at the time the contract for the purchase of an existing home is signed, similar to the Census Bureau’s new home sales data. In contrast, the National Association of Realtors’ existing home sales data are recorded when the sale is closed, which is usually a couple of months after the sales contract has been signed. In developing the pending home sales index, the NAR found that the level of monthly sales contract activity leads the level of closed existing home sales by about two months.

China PMI shows weaker economy in October. November will probably be worse.
China’s official manufacturing PMI recorded a contraction in activity (49.2) in October, down from the very modest expansion (50.1) indicated in September. The non-manufacturing PMI index also registered a contraction, falling to 48.7 in October, down from 50.6 in September a month ago.
For the manufacturing PMI, almost every sub-index fell from last month’s reading. The exception to this was for raw material prices, which means even thinner profit margins for manufacturers. New orders were weaker, hinting at a further fall in activity levels in the coming months. New export orders remained in contraction, but slightly less so than last month. That makes it very hard to be optimistic about either manufacturing or exports for November and December.
In terms of the non-manufacturing PMI, the index was still dragged lower by real estate and construction. But adding to the gloom, the retail sector was also weaker, even though the first week of October was the Golden Week holidays. As a result, we believe that retail sales in October could be very soft.
All in all, October looks to have been a weak month for the economy, and November looks as if it will be no better than October. Compounding this is the fact that Covid cases are climbing again, and it is possible that we will see further small-scale lockdowns in China. We also expect a contraction in export demand in the coming months reflecting the weakening external environment.
We expect that the CNY will weaken further in the short term given the apparent weakness of the economy. Together with more Covid cases and expected lockdowns, it becomes even more difficult to be upbeat about the yuan.
But the central bank does not want the CNY to weaken too fast. With the recent increase in macro-prudential parameters for cross-border finance, we expect that demand for the yuan should increase when USDCNY gets close to 7.4. It is therefore possible that the yuan will remain range-bound between 7.2 and 7.4.
FED WATCH
Fed set for fourth consecutive 75bp hike – but a step down is coming
The market had been favouring a fifth consecutive 75bp hike at the December FOMC meeting up until late last week. However, a Wall Street Journal article last Friday by Nick Timiraos, who has gained a reputation as the Fed’s go-to guy when “senior management” want to guide the market more directly, helped alter the balance of thinking. His article hinted that some officials are concerned that things were moving too fast too quickly and they need to rein the market back a bit, which has re-opened the possibility of “just” a 50bp hike in December.
This was followed by comments from San Francisco Fed president Mary Daly, echoing sentiments from Fed governor Chris Waller that the Fed is “thinking about a step down [in the pace of hikes], but we’re not there yet”. Smaller rate hikes from Canada and Australia have added to a sense that bankers are looking to tone down the aggressiveness.
As Fed chair Jerome Powell has repeatedly admitted, monetary policy works with “long and varied lags” and after having hiked rates 375bp, it might soon be time to stop battering the economy so aggressively. The speed with which Treasury yields, mortgage rates and other borrowing costs have been rising in the economy is causing some economic stress, most notably in the housing market, but there is also concern that financial stresses could potentially be brewing in the system. Consequently, we do indeed expect the Fed to open the door to a slower pace through formal forward guidance, but it may not necessarily go through it. (…)
The current rate hike cycle vs. previous cycles – the orange circle marks where we currently are
Source: Macrobond, ING
The core CPI and PCE deflator continue to show prices rising 0.5% or 0.6% month-on-month, but to get inflation to trend toward the 2% year-on-year target we need to see month-on-month price changes of closer to 0.2%. So, while the recent commentary has offered some support to our current house view of a 50bp rate hike in December, the data doesn’t yet.
As such we have to keep the option open for a 75bp hike in December, even if the Fed language is a little softer next week. Indeed, the stickiness of inflation also suggests the risk is that our call for December to mark the peak (at 4.25-4.5%) is perhaps too early and it could be that we get a final 50bp in February that would then mark the top. This would leave a terminal rate of 4.75-5%. (…)

In his September presser, Mr. Powell told us that they are looking at trends in core PCE inflation on 3-6-and 12-month intervals “currently showing 4.8%, 4.5% and 4.8% annualized respectively.” One monthe later, these are 4.5%, 4.5% and 5.1%. Mission not accomplished yet.
He also listed 4 conditions for an easing in inflation:
- job openings need to decline significantly with rising unemployment;
- inflation expectations must remain well anchored;
- the various supply shocks will abate;
- real yields must be positive across the yield curve.
Not there yet either.
The Fed funds rate remains well below core inflation, not really restrictive yet. Demand is not contained yet although there are no signs of spiraling wages, so far.
Indicators including the inversion of the yield curve between 10-year and three-month Treasuries — a recession indicator with a perfect record — “all support a Fed pivot sooner rather than later,” Wilson wrote in a note on Monday. “Therefore, this week’s Fed meeting is critical for the rally to continue, pause or even end completely.”
Goldman, having reviewed 85 prior hiking and subsequent easing cycles since 1969 across G10 economies, finds that
G10 hiking cycles lasted just over 15 months on average, and 70% of historical cycles lasted longer than a year. Cycles tend to be longer in the US but shorter in the UK, Canada, and Australia. Surprisingly, the length of hiking cycles is similar across high and low inflation episodes. (…)
75% of G10 hiking cycles featured a pause. (…) On average, hiking cycles ended when year-over-year inflation was within 10% of its peak (e.g. down from 5% to 4.5%). (…)
In the median cycle, the first cut came seven months after the last hike with a cumulative 200bp of easing within the first year. Across the G10, roughly 75% of the cycles involved a first cut within a year after the last hike. (…)
An important caveat to these findings is that the current post-pandemic cycle remains very unique.
- Goldman sees the Fed rate peaking at 5% in March
![]() Good read from Steve Blumenthal: What Comes Next? The Fed is in the middle of a tightening cycle. In Bridgewater Associates’ recent research and insights note, Co-CEO Bob Prince shared his and his firm’s view on where we are in the cycle now and where we’re headed. “What comes next is weak economies and tough policy choices,” he says.
Good read from Steve Blumenthal: What Comes Next? The Fed is in the middle of a tightening cycle. In Bridgewater Associates’ recent research and insights note, Co-CEO Bob Prince shared his and his firm’s view on where we are in the cycle now and where we’re headed. “What comes next is weak economies and tough policy choices,” he says.
EARNINSG WATCH
From Goldman Sachs:
The S&P 500 rallied 4% this week despite disappointing earnings. On an aggregate basis, consensus expected 3Q EPS growth of 3% year/year at the start of the season. With 52% of companies having reported, that growth rate now stands at just 2%. 47% of S&P 500 companies have beaten EPS by more than a standard deviation of analyst estimates, in line with the long-term average but below the pace set in the last few quarters.
However, a potential downshift in the pace of Fed tightening, coupled with light positioning and anticipation of strong Q4 seasonality lifted the market.In 17 bear market rallies since 1970, the S&P 500 rose by an average of 15% over 44 days.
Per Refinitiv/IBES, we now have 263 reports in, a 73% beat rate and a +3.8% surprise factor
These 263 companies have reported actual earnings up 2.4% on a 11.7% revenue gain.
By comparison, after 279 reports in Q2, the beat rate was 78%, the surprise factor +5.2% and those 279 companies had reported actual earnings up 7.3% on revenues up 14.5%.
Q3 earnings are now expected up 4.1% (+4.1% on October 7). Ex-Energy: -3.5% (-2.6%).
Q4 earnings are now expected up 2.6% (+5.2% on October 7). Ex-Energy: -1.5% (+1.3%), the first time Q4 ex-E are seen declining.
Trailing EPS are now $221.18.Full year 2022: $221.27e. 12-m forward EPS: $229.54e. Full year 2023: $235.92e.

John Authers: Why Earnings Don’t Scare Stocks This Halloween
(…) Part of the problem is that the numbers are more varied than usual. Big tech companies generally disappointed, but there’ve also been some big successes. The aggregates don’t capture this. One idiosyncratic result particularly skewed the overall data. Amazon.com Inc. reported earnings twice their forecasts — and yet the retailer’s stock subsequently fell, because of its gloomy prognosis for holiday season sales. Include Amazon, and earnings per share for the quarter are beginning to turn up. Exclude it, and they’re flatlining, as illustrated by this chart from Deutsche Bank Asset Allocation’s Bankim Chadha: (…)
Aside from energy, only utilities and real estate (generally considered defensive) have risen so far in 2022, along with materials, where estimates have begun to fall as metals prices reduce (…).
(…) plenty of investors were worried about an all-out earnings crash. With the prominent exception of Meta, this hasn’t happened. (…)
The rewards for the good performers outside the tech sector show that optimism remains — and also that those good results in themselves imply that the economy is not in as dire straits as it appears to be. (…)
And earnings expectations for 2023 remain higher now than they were at the beginning of the year. (…)
In other words, the equity market is still implicitly pricing in a “soft landing” for next year, and the results for many companies imply that there’s a very good chance for it to come true. (…)

TECHNICALS WATCH
13/34–Week EMA Trend (S&P 500 Index @ 3,875)

- For UBS Global Wealth Management, a Fed pivot is unlikely given the very high level of US inflation.
- Goldman Sachs: “In 17 bear-market rallies since 1970, the S&P 500 rose by an average of 15% over 44 days”.
DOG DAYS!
At San Francisco restaurant, pups chow on filet mignon
(…) Dogue, which rhymes with vogue, opened last month in the city’s trendy Mission District.
For $75 dollars per pup, doggie diners get a multiple-course “bone appetite” meal featuring dishes like chicken skin waffles and filet mignon steak tartare with quail egg.
It also includes a mimosa and a baked treat for the pup’s human. (…)
Massarweh says that since opening a month ago, he’s received overwhelming support from his customers who appreciate having a place to pamper their pups. (…)
On a recent Sunday, Dogue hosted three fur baby birthday parties simultaneously. (…)
Massarweh spends hours cooking and prepping for his service and says a similar menu for people could cost up to $500 in the expensive city and the ingredients he uses are not cheap. Everything is human-grade, although if you took a bite, you’d probably find the doggie dishes to be a bit bland for the human palate.
“When we make our food, it is a process. It is very time-consuming. There is a lot of technique. There’s a lot of method and detail to what we do,” he said. “Our pastries, for example, take about two days on average to make. I know they’re going to be eaten in two seconds.” (…)
Hmmm…something’s gonna happen…
1 thought on “THE DAILY EDGE: 31 OCTOBER 2022”
Re your piece above on Dogue, I am reminded of a passage in Gibbon’s Decline and Fall of the Roman Empire describing the situation when the city was besieged by (I think) the Goths – “And the Romans gave all that they had for what three months earlier they would not have fed to their dogs”.
Let’s hope that what goes round doesn’t come round.
Comments are closed.