Surge in Payrolls Sets Up Economy for Spring Gains Hiring accelerated sharply in February as restaurants and other hospitality businesses reopened and coronavirus cases eased, setting up the economy for a broader acceleration this spring.
Employers added 379,000 jobs in February and January gains were revised higher to 166,000 jobs [from 49k, December’s decline was revised to -306k from -227k], the Labor Department said Friday. (…) The unemployment rate, determined by a separate survey, ticked down to 6.2% last month. (…)
Overall, the U.S. has 9.5 million fewer jobs than a year earlier, just before the coronavirus pandemic took hold in much of the country. (…)
In February, most of the job gains occurred in the leisure and hospitality sector, which includes restaurants, adding 355,000 jobs. There were smaller increases in temporary help services, manufacturing and healthcare. (…) In addition to restaurants, there were job gains at hotels, stores and in personal services, such as salons. (…)
Despite last month’s gains, the leisure and hospitality sector has 3.5 million fewer jobs than a year earlier, the Labor Department said, showing the recovery is far from complete. (…) Doctor and dentist offices and other nonhospital healthcare providers added 36,000 jobs last month. The sector has mostly recovered the more than one million jobs it lost last spring, when nonessential health services were ordered to close. Employment at pharmacies and other personal-care stores, where many people are getting vaccinated, is recovering at a faster pace than overall retail. (…)
Employment in construction fell by 61,000 in February. Severe winter weather may have held down employment in that sector, the department said. (…)
A good employment report overall but the WSJ account omits other important stats:
- Average hourly earnings growth was +0.2% (5.3% YoY) last month after +0.1% in January, revised from 0.2% and +1.0% in December.
- The average workweek dropped to 34.6 hours, its shortest since July and down 0.9% from the January peak of 34.9 hours.
As a result, aggregate weekly payrolls (jobs x hours x wages) dropped 0.26% in February, the first monthly decline since April 2020. On a YoY basis, payrolls are down 0.8%, more than 2.2% in real terms. This suggests that consumer expenditures flattened in February.


In effect, JP Morgan’s Chase credit card spending tracker suggest somewhat softer expenditures in February:

The BLS warned that “severe
winter weather across much of the country may have held down employment in construction. (…) Unusually severe weather is more likely to have an impact on average weekly hours than on employment.”
Had hours remained unchanged in February, nominal payrolls would be 0.9% higher than what was reported and up 1.1% YoY compared with the reported 0.2% gain.
That said, American employers seem to have adopted a cautious staffing approach given the uncertainty on reopening. Total employment is down 8.5 million in the last year but hours worked peaked at 34.9 in January compared to a 34.4 average since 2012.

The glass-half-empty view is that employment growth averaged only 80k in the past 3 months, down from +550k in the previous 3 months.
Encouragingly, the BLS says:
In February, 13.3 million persons reported that they had been unable to work because their employer closed or lost business due to the pandemic—that is, they did not work at all or worked fewer hours at some point in the last 4 weeks due to the pandemic. This measure is down from 14.8 million in January.
Among those not in the labor force in February, 4.2 million persons were prevented from looking for work due to the pandemic. This measure is down from 4.7 million in January.
- Goldman Sachs Economists See U.S. Jobs Boom as Virus Curbs Ease They predict the unemployment rate, currently at 6.2%, will fall to 4.1% by the end of the year.
Given the current humongous savings and the encouraging trends on the virus front, consumer spending is likely to remain very supportive of the economy. As a case in point:
Centerline Logistics, a Seattle company that provides fuel to ships in U.S. ports, is hiring to keep up with better-than-expected demand. Volumes at ports where Centerline operates picked up last fall as the demand for consumer goods rose ahead of the holidays, and that demand has continued this year, Chief Executive Matt Godden said. “Ships are stacked up at the port as far as the eye can see,” he said.
Actually, American consumers are in great financial shape: their net worth is up 80% from the 2007 peak (total CPI is up 25%) and their debt payment is down to 9.1% of disposable income from 13.2% in 2007.

To the extent that the “Fed puts” since the Greenspan era were meant to protect the economy from weaker consumer spending due to negative wealth effects induced by falling equity markets, this Powell Fed may not feel pressured to trigger any put given the overall consumer financial situation and the tsunami of pandemic-induced fiscal support which would help offset any negative wealth effect. Actually, the Fed could opt to keep short-term rates floored while letting the market deal with the longer end even if it creates tremors in certain parts of the equity market.
The FOMC may in fact welcome a little cooling in areas sensitive to long-term rates such as housing and durable goods where inflation (CPI and PPI) is well above average.
“I would be concerned by disorderly conditions in markets or a persistent tightening in financial conditions that threatens the achievement of our goals,” Mr. Powell said Thursday. He added that the Fed is looking at “a broad range of financial conditions,” rather than a single measure.
“If conditions do change materially, the [Fed’s rate-setting] committee is prepared to use the tools that it has to foster achievement of its goals,” Mr. Powell said.
Neel Kashkari, (Minneapolis Fed and a voting member of the FOMC) goes along with his boss:
I don’t know what the best policy solution is, but I know we can’t just keep doing what we’ve been doing. As soon as there’s a risk that hits, everybody flees and the Federal Reserve has to step in and bail out that market, and that’s crazy.
BTW: Redfin’s Housing Market Update
Key housing market takeaways for 400+ U.S. metro areas during the 4-week period ending February 28:
- The median home-sale price increased 16% year over year to $323,600, an all-time high. (…)
- Asking prices of newly listed homes hit a new all-time high of $347,475, up 10% from the same time a year ago.
- Pending home sales were up 18% year over year.
- New listings of homes for sale were down 17% from a year earlier.
- Active listings (the number of homes listed for sale at any point during the period) fell 40% from 2020 to a new all-time low.
- 55% of homes that went under contract had an accepted offer within the first two weeks on the market, well above the 44% rate during the same period a year ago. This is another new all-time high for this measure since at least 2012 (as far back as Redfin’s data for this measure goes). During the week ending February 21, 57% of homes sold in two weeks or less.
- 43% of homes that went under contract had an accepted offer within one week of hitting the market, up from 30% during the same period a year earlier. This is also an all-time high for this measure. During the week ending February 21, 44% sold in one week or less.
- The average sale-to-list price ratio, which measures how close homes are selling to their asking prices, increased to 99.6%—1.6 percentage points higher than a year earlier and an all-time high. During the 7-day period ending February 28, the ratio shot up to 99.9%, also an all-time high.
- For the 7-day period ending February 28, the seasonally adjusted Redfin Homebuyer Demand Index—a measure of requests for home tours and other services from Redfin agents—was up 49% from the same period a year ago.
- Mortgage purchase applications increased 2% week over week (seasonally adjusted) and were up 1% from a year earlier (unadjusted) during the week ending February 26. For the week ending March 4, 30-year mortgage rates increased to 3.02%, the highest level since July.
Supply problem: Miami Beach Faces 19-Month Supply Of Condos Listed For Sale At Peak Of Winter Buying Season
(…) A balanced market is generally considered to have about six months of supply. (…) The report does not factor in the nearly 47,750 new condo units currently in the development pipeline east of Interstate 95 in the tricounty South Florida region, according to CraneSpotters.com. (…)
Supply management: Manhattan Landlords Take Apartments Off Market During Rental Slump Reduced demand during pandemic sent median rental prices down sharply; some bet market will rebound in spring
U.S. Trade Deficit Widens to $68.2 Billion in January

THE INFLATION DEBATE
David Rosenberg, a noflation apostle, wrote last Friday:
Much was made of the ISM manufacturing PMI prices paid index firming sharply to 86.0 in February from 82.1 in January and 77.6 in December. This is the highest reading since July 2008. It is interesting to note that the core CPI inflation rate was 2.5% at the time, a year later it was 1.5% and two years later it had receded to 0.8%. Forty years’ worth of data shows the correlation between the ISM manufacturing prices paid index and the core inflation rate to be… zero.
I do not have historical ISM data so I cannot do the correlation data. But Wells Fargo Securities and MacroMicro offer these two plots with total CPI. The first plots 3-m annual rates while the second one is YoY:

Not perfect correlation, but not zero either.
More to the point with core CPI, Rosie curiously mitigates his first affirmation with “This, at best, is a coincident indicator and despite all the fuss, is an absolutely irrelevant leading inflation barometer.”
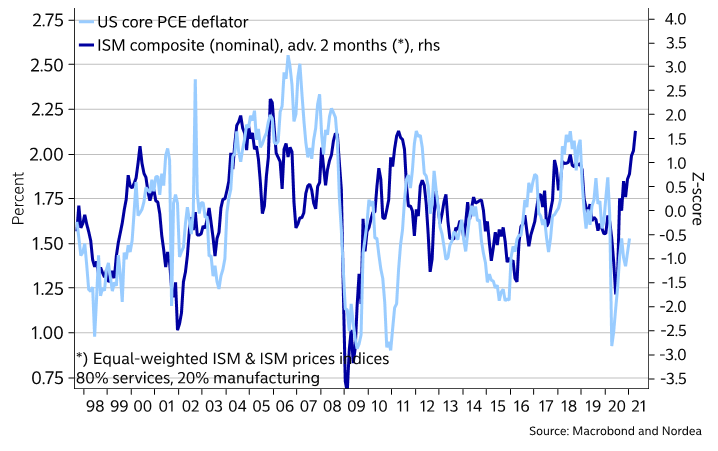
But Nordea finds a relation with core PCE: “The nominal ISM composite suggests a move above 2% for the core PCE deflator, as well as a move to ~3.5% for headline inflation over the next several months.”
Nominal composite vs US CPI inflation
And Isabel.net finds that “The U.S. ISM Manufacturing Index tends to lead U.S.
Core CPI by 24 months.”![]()

Keep in mind that PMI data reflect manufacturers’ purchasing managers’ experience with prices of products they procure weeks or months before delivery. Pass through is not automatic nor 100% and will not be reflected in a PPI or CPI index until the actual products are manufactured and sold. The ISM (and Markit’s) price index thus cannot logistically be coincident with any consumer inflation measure.
Wells Fargo adds this chart as support evidence, linking NFIB firms raising prices with Core CPI. Not perfect but not…zero.

From last month’s ISM report:
The ISM® Prices Index registered 86 percent, an increase of 3.9 percentage points compared to the January reading of 82.1 percent, indicating raw materials prices increased for the ninth consecutive month. This is the index’s highest reading since July 2008, when it registered 90.4 percent. “Aluminum, copper, chemicals, all varieties of steel, soy, petroleum-based products including plastics, transportation costs, electrical and electronic components, corrugate, and wood and lumber products all continued to record price increases,” says Fiore. A Prices Index above 52.7 percent, over time, is generally consistent with an increase in the Bureau of Labor Statistics (BLS) Producer Price Index for Intermediate Materials. All 18 industries reported paying increased prices for raw materials in February.

(…) The current commodity cycle shows an economic cycle’s characteristics underway for a few years, not just getting started. That creates the potential for a quicker cost-push price cycle for products that coincides with an uptick in service prices, resulting in a lift in general inflation sooner and by more than what is currently expected by the markets and policymakers.
The Institute of Supply Management (ISM) reported that its composite index of prices for the manufacturing sector increased four percentage points to 86%. That represents the highest reading since July 2008. Although numerically the same, the economic and commodity price environments between 2008 and 2021 are fundamentally different.
February 2021 represents the early months of an economic recovery, while in 2008, the economic cycle which had been running for several years had already turned down. Also, high oil prices dominated the commodity cycle of 2008. Oil in July 2008 averaged $133, a record high and nearly double year-ago levels. In 2021, ISM”s February report listed 50 commodities rising in price, and the cost of oil was $59 a barrel, up from $50 one year earlier.
Broad-based commodity cycles have more significant momentum and staying power, unlike those driven by a single item, such as the case of 2008. (…)
In February, the ISM price index for the service industries jumped 7 points to 72%. (…) in the past 25 years, no business cycle started with a higher price index reading for the service sector.
The price information coming surveys of manufacturers and service firms paint a broader uptick in general inflation, much more than what expressed in Federal Reserve officials’ future price expectations. Based on current trends, consumer price inflation could easily top 3% in 2021. And while policymakers may characterize the inflation uptick as transitory, broad inflation cycles are not transitory and require monetary tightening to reverse.

(…) Follow-through from oil prices or inflation expectations into broader gauges of inflation (such as wages) will additionally hinge, however, on other factors and in very broad terms on underlying capacity tensions. Most inflation models these days are typically rooted in textbook Phillips curve analysis and therefore have a significant weight attached to capacity terms. The question we should be asking therefore is whether or not the burst of speed in economic activity in coming months will meaningfully erode any excess capacity and thereby drive down unemployment rates and fuel wage and broader price inflation. A further question that’s pertinent to this incidentally is the degree to which the capacity – and labour market capacity in particular – will come back on stream if the COVID-crisis now begins to ebb.
Focusing though solely on the demand side suggests little reason for concern about underlying capacity-driven inflation tensions in the immediate months ahead. The world economy has, after all, been saddled with excess savings, lacklustre investment demand as well as large pockets of excess capacity throughout most of the last decade or two. That’s been rooted in a number of global trends including a globalisation of trade, labour markets and finance as well as on the related and growing use of new technologies.
It’s possible that a structural de-globalization of trade (and finance) will reverse these trends and catalyse higher inflation in the coming months and quarters. But there is another factor that is often overlooked in these debates but which should continue to drive a dis-inflationary thrust into most economies’ inflation equations. It concerns ageing demographics. (…)
Ageing demographics have tended to go hand in hand with slower investment activity, reduced dynamism, weaker household and business credit formation and ultimately – via those previous channels – lower inflation as well. With the world economy in general confronting an ageing demographic profile and its major economies in particular (including China) this ought to continue to structurally restrain inflation expectations and contain any prospective climb in wage (and core) inflation. (…)

- The Fed Doesn’t Fear Inflation. Its Critics Have Longer Memories Milton Friedman saw the great uptick of the 1970s coming, and Larry Summers has similar warnings today. Jerome Powell would do well to listen.
(…) At this point, we need to make our first qualification of Friedman’s monetarist credo. Actually, inflation is often and in many places a fiscal phenomenon — or at least, you don’t get inflation without a combination of fiscal and monetary expansion. Summers’s point is that the proposed fiscal stimulus is far larger than the likely output gap, insofar as that can be estimated. Even before the additional stimulus, Summers wrote, “unemployment is falling, rather than skyrocketing as it was in 2009, and the economy is likely before too long to receive a major boost as Covid-19 comes under control. … Monetary conditions are [also] far looser today than in 2009. … There is likely to be further strengthening of demand as consumers spend down the approximately $1.5 trillion they accumulated last year.” (…)
In a seminal paper first published in 1981, the economist Thomas Sargent argued that “big inflations” ended only when there was “an abrupt change in the continuing government policy, or strategy, for setting deficits now and in the future that is sufficiently binding as to be widely believed.” The corollary of this insight must be that inflations begin with a comparable regime change, but one that is imperceptible rather than abrupt.
Sargent elaborated on this point in his 2008 presidential address to the American Economic Association, in which he argued that policymakers might easily form “incorrect views about events that are rarely observed.”
“The situation that we are always in [is] … that our probability models are misspecified. … The possibility [exists] that learning has propelled us to a self-confirming equilibrium in which the government chooses an optimal policy based on a wrong model … Misguided governments [fall into] lack-of-experimentation traps to which self-confirming equilibria confine them.”
This nicely encapsulates the mistakes made at the Fed in the 1960s. It might well turn out to describe the mistakes being made at the Fed right now. Thirty years of very low inflation seems like the perfect basis for a wrong model.
There is one important caveat, nevertheless. The biggest difference between our own time and the 1960s is that we are coming out of a pandemic, whereas then the U.S. was sliding deeper into a disastrous war. Economic historians have long been aware that, for most of history, war has been the principal driver of moves in inflation expectations. Pandemics have generally not had this effect. The reason for this is clear. Over the long run, wars are the most common reason why governments run large budget deficits and are tempted to debase the currency. And wars that go wrong are especially likely to end in either debt default or inflation or both. (…)
I would become a lot more worried about the prospects for U.S. inflation if our current Cold War II with China escalated into a full-blown hot war or even a serious diplomatic crisis over, say, Taiwan — which is a good deal more likely than I suspect most investors appreciate, as Robert Blackwill and Philip Zelikow pointed out last week.
(…) Ultimately, inflation expectations can be untethered by a combination of excessive fiscal and monetary laxity without a shot being fired. If a pandemic has the financial consequences of a major war, that may suffice. (…)
The conclusion is not that inflation is inevitable. The conclusion is that the current path of policy is unsustainable. The Fed may control short-term rates but it cannot really allow long-term interest rates to rise rapidly because of the problems this would create for highly leveraged entities, including the federal government itself. This is the “unpleasant fiscal arithmetic” that inevitably arises when the stock of debt rises to approximately the level of total economic output.
On the other hand, the Fed cannot comfortably engage in full-spectrum yield-curve control without creating a situation of financial repression and fiscal dominance reminiscent of the late 1940s, another time of rapid inflation. To quote a recent paper from the St. Louis Fed, “if the Fed were to adopt such a policy and if the public perceives that the Fed is engaged in deficit financing, then it is possible that inflation expectations could rise.”
(…) the key members of Team Biden, notably Treasury Secretary Janet Yellen, all think the lesson of history is to “go large or go home” with deficit spending: the $1.9 trillion stimulus is the first of a number of big spending measures in prospect, with green new infrastructure next up. But that’s only the lesson of very recent history — to be precise, the first term of the Barack Obama administration, in which so many of today’s key players served. (…)
It may ultimately be that our great expectations of inflation will dissolve (…), vindicating Powell and making fools of aged economists and bond vigilantes alike. But the resemblances between our situation and the one Milton Friedman described in 1970 are striking — even if it is not quite true that inflation is always and everywhere a monetary phenomenon.
In the real world:
- Finance Chiefs Look to Price Increases to Offset Higher Commodities Costs Consumers could expect to see prices on goods from mattresses to storage containers increase as finance chiefs try to offset higher costs for raw materials.
(…) Jeff Miller, the chief financial officer of Container Store Group Inc. which sells plastic storage boxes and other home-organization tools, said the rising cost of polypropylene could put pressure on the retailer’s gross margin. That figure on a consolidated basis fell 90 basis points to 57.9% in the third quarter ended Dec. 26 compared with a year earlier, due in part to higher shipping costs. Sales rose 20% during the third quarter to $275.5 million, driven by the home-improvement boom spurred by the pandemic.
Container Store is weighing whether to raise prices on some of its products, Mr. Miller said. “It’s always on the table,” Mr. Miller said. The company said it could also negotiate with its vendors or adjust its sourcing to compensate for the higher commodity costs.
Sleep Number Corp. , the Minneapolis-based mattress seller, has already decided to increase prices this year to offset the higher cost of certain chemicals, finance chief David Callen said. “We have not put them in place just yet, but we will definitely be doing that,” Mr. Callen said. (…)
La-Z-Boy Inc., the Monroe, Mich.-based furniture company, began raising prices by low- to mid-single digit percentages on new furniture orders in October, said CFO Melinda Whittington. (…)
![]() Henry Maxey, CIO at Ruffer LLP offers a particularly interesting angle on the inflation risk with useful history:
Henry Maxey, CIO at Ruffer LLP offers a particularly interesting angle on the inflation risk with useful history:
(…) The US ended the Second World War with debt running at nearly 120% of GDP, while the UK’s ratio stood at 250%. By the early 1970s, the US debt-to-GDP ratio had fallen to around 25% and the UK’s was down below 50%. How was this achieved?
A lot of the heavy lifting was done by repressing the interest rate paid on government debt to a rate below the level of inflation. For example, the rate of interest on US long bonds was fixed at 2.5% in June 1941 and remained at that level until the Treasury-Fed Accord in February 1951. Inflation, meanwhile, averaged 5.9% over that period. As a result, real interest rates were deeply negative, which meant nominal GDP grew faster than nominal debt, thereby reducing the debt-to-GDP ratio to more manageable levels.
One of the attractive things about this period is that the government’s deficit, having been enormous during the war, fell back to near balance in the years after it. As a result, US gross debt levels flatlined.
The post-war context was perfect for financial repression. The necessary reconstruction created demand, and supply was still impacted by the war. Background inflation remained elevated while interest rates were controlled. It is difficult to say, therefore, that financial repression drove inflation; rather, financial repression was effective because inflation was already the mood music.
A similar repression has taken place since 2008. Real US overnight interest rates have been negative for most of the past 12 years. Although interest rates beyond the overnight rate have not been formally fixed as they were in the 1940s, they have been heavily managed through a combination of quantitative easing and forward guidance by the Fed. This has stimulated asset price inflation, but not consumer price inflation.
In our current environment, interest rate repression alone is not enough to stimulate higher consumer prices. So, if we’re imagining how the future might be more inflationary, the post-war period is only part of the story. When most people think about inflation, they tend to think about the 1970s. Does this period hold the key?
The inflationary cycle of the 1970s is largely associated with the supply-side shock from oil prices allied to the labour market frictions of high union power. Fiscal largesse, blind to actual output gaps, provided the fuel of excess demand.
Lesser appreciated is that, in the US, this cycle had its origins in the 1960s. President Lyndon Johnson’s government overestimated the amount of slack in the economy – and sought to utilise it. Beginning with the Kennedy-Johnson tax cuts in 1964, the US began stimulating growth with fiscal policy while pressuring the Fed to keep monetary policy loose. The result was a series of inflationary waves in the 1960s which were amplified by the events of the 1970s.
There are some parallels with today. Take the supply side, the capacity of the economy to produce goods and services. This has undoubtedly been damaged by the covid crisis. Unusually, in the West it has been the dominant service sector which has been hardest hit (think, hotels and restaurants that will struggle to reopen). The crisis has also reminded business leaders that there are benefits in having some redundancy (think, holding a little more just-in-case inventory). Covid-19 compounds two other structural supply side shocks (…): supply chains shifting as US-China relations deteriorate; and the attempt to price in some of the cost of environmental, social, and governance externalities into the costs of business.
Collectively, these shocks will act against the structural disinflationary trends that have prevailed in recent decades. But will they make the Western economies inflation-prone, 1970s- style? It’s unlikely; the oil shocks were very extreme cost-push events.
That said, we need to consider the emerging macro context. If these supply-side changes are allied to macro policy, which assumes both an unchanged disinflationary backdrop and a greater degree of slack in the economy than actually exists, then we could have the set-up for a very similar policy mistake to that made in the 1960s. Stick a high voltage across a copper wire and it will get hot; stick the same voltage across a thinner wire and it will get hotter.
The US Federal Reserve, for example, has been explicit in its view that monetary policy should remain accommodative until unemployment is back to, or below, the low levels of 2019. The Fed assumes inflation will not be an issue between now and then, because it wasn’t previously. So much so, in fact, that it has adjusted its monetary policy framework to include the idea of inflation make-up, or inflation overshooting – the Fed will allow inflation to remain higher for a period to compensate for a past period in which it ran lower than the 2% target.
And fiscal policy is now active alongside monetary policy. This is direct stimulation of demand. It does not rely on transmission via the financial markets, as it has since 2008. Stimulus via monetary policy alone has tended to get trapped in financial markets – with share buybacks and financial engineering, rather than new factories and higher real wages. Monetary-fiscal coordination is stimulus via Main Street, not Wall Street. It stimulates consumer price inflation rather than asset price inflation.
Adding it all up… we have demand stimulus (which is more directly inflationary) hitting a post-covid economy (which is structurally more inflationary biased). That combined with policymakers who will both cheer inflation on and who have promised to let the economy run hotter for longer. All against a backdrop of financial markets that have wired themselves to the proposition that low interest rates are here to stay.
While the 1960s and 1970s provide the textbook roadmap for inflation in the developed economies, we need to think more creatively about what unique genetic mutations the next inflation might have. One avenue that interests me is the idea of a run on fiat currencies.
In developed economies, we are used to relative stability in foreign-currency exchange markets because of the credibility of the institutions that manage the economy. This means most people haven’t spent a lot of time asking themselves, “what is money?” or “is my money safe?”
That has started changing in the post2008 world of extremely low, sometimes negative, interest rates. Faced with a safe pathway to retirement that is torturously slow, savers have been forced to take substantially more risk to find return. For some, particularly the young, this has incubated a ‘speculate to accumulate’ mentality. And one of the popular speculations has been on digital currencies.
Irrespective of the merits of these digital assets, their emergence has led a generation of young people (and quite a few older ones too) to consider some of the existential questions about money. Even if it is simply to justify a speculation, they have had to consider characteristics such as: fiat money’s potentially unlimited supply; how much money is being ‘printed’ to bail out the latest victim(s); how inflation typically eats away at money’s purchasing power; how a real asset like gold can – and did – act as a monetary anchor; and how new technology offers the potential of ‘money over IP’.
Large numbers of people outside finance are interested in what money is and, more importantly, what its failings are. They are also getting equipped with tech tools that allow them to move out of fiat and into alternatives such as gold or bitcoin. The website of the mobile bank Revolut yells out: “Go from cash to crypto, in seconds.”
In the nineteenth century, once people got the hang of the signals that indicated banks might be in trouble, they would seek to withdraw their bank deposits on the back of the rumour, rather than waiting for the facts. The banking panic run of 1893 was a spectacular example of this learned ‘panic early’ behavior.
So the psychological tinder of confidence in fiat money is drying, and the technology providing alternatives is becoming available to everyone. This greases the wheels of another route to inflation: a sharp fall in and run on the currency, something we normally only associate with emerging market economies. As with fiscally-driven inflation, this too would have tipping point characteristics.
Could this happen today? Potentially, yes, but I doubt the tinder is dry enough yet. I think further development is needed on three axes –
• A sharp pick-up in actual inflation, which central banks seek to look through.
• Sustained use of fiscal policy and continued academic endorsement for it.
• A further acceptance of, and widening access to, digital assets (the things depositors would run to) by institutional investors, regulators, and commentators.
All of these feel like very live dynamics for the next 12 months. (…)
Jamie Dannhauser, an economist also at Ruffer, offers another reason for a major regime shift. Pardon the elongated post but this is crucial in my view:
(…) Every vested interest can claim, with some justification, that they are not to blame and that they should not pay to clean-up the fiscal mess. (…)
Instead, the case for Big Government has been radically strengthened. Unprecedented stimulus has prevented an economic calamity, without creating the inflationary disaster that sound-money conservatives feared.
At the same time, a political gulf has opened up between the young and lowskilled, who have suffered their second debilitating economic crisis in just over a decade, and the well-educated white-collar
workers, for whom this crisis has been little more than a social irritant.This will make it exceptionally hard to unwind covid-related fiscal stimulus. (… ) This is the quid pro quo society demands for accepting lockdown’s constraints on personal freedom and social interaction. (…)
Structural disinflationary tailwinds are morphing into persistent inflationary headwinds. Equally important, the political revolt against liberal overreach is at boiling point. Against this backdrop, the monetary accelerator is flat to the metal. (…)
What happens once the recession is behind us? Soon after the GFC, the interests of central bankers and politicians diverged. Governments shifted quickly to austerity, leaving monetary policy as the only game in town. Central bankers had no option but to cut interest rates every time bad economic news arrived, something investors took note of.
Such a divergence looks unlikely in the years ahead. Central bankers and governments have their eyes on the same prize: Main Street’s return to full health. Practically, intellectually and politically, they are bound together. Central bankers’ political survival will depend on their implicit collusion with their legislative overlords. Mainstream politicians, having donned populist colours, will conclude that their grip on power depends on Main Street’s recuperation. In the economic realm, monetary-fiscal co-ordination will become the new norm – in practice, helicopter money.
This is why the Fed’s new strategy is so consequential: it provides the intellectual justification for the politically inevitable. Those at the top of institutions have always fought tenaciously to ensure their survival. Central bankers are no different. The demise of the dominant liberal paradigm threatens their independence. None will be prepared to sacrifice themselves on the altar of 2% inflation. Expect them to accommodate politicians’ strenuous efforts to return Main Street to full health, a move that in their eyes comes with limited risks and valuable rewards.
But the dangers are considerable. The background environment is more hostile to robust non-inflationary growth than for decades. This crisis has potentially profound consequences for spending patterns and the economy’s productive capacity. And policy levers have been pulled harder than ever.
Financial markets – wired to the inevitability of low inflation, depressed nominal interest rates and limited macro volatility – face significant upheaval. (… ) Inflationary upheaval is now a clear and present danger to client portfolios.
Key Saudi Arabian Oil Site Attacked, Stoking Regional Tensions The latest in a spate of assaults claimed by Iran-backed Houthi rebels pushed oil prices above $70.
ISRAEL WATCH
From the WSJ:
Israel, which leads the world in vaccine distribution, has experienced a jolt of activity as national lockdowns lifted in February. Online travel and restaurant-reservation portal Booking Holdings told investors last month that domestic bookings in Israel were now well above 2019 levels.
 SENTIMENT WATCH

CATHY’S ARK
ARK Funds Fall Into Bear Market The investment firm’s highflying exchange-traded funds are down more than 20% from their peaks following another round of steep declines Friday.
(…) ARK’s flagship innovation fund has been hardest hit. The $23 billion fund has fallen 27% from its previous high, with roughly a third of those declines coming this week alone. The drops for ARK’s other funds weren’t far off. (…)
Some of ARK’s funds have heavy positions in companies like electric-car maker Tesla Inc., streaming service Roku Inc. and digital-payments company Square Inc. All three of those stocks are off at least 24% from their most recent highs. (…)
Ark now owns more than 10% of at least 29 companies via its exchange-traded funds, up from 24 just two weeks ago, according to data compiled by Bloomberg.
Less discussed are holdings of Nikko Asset Management, the Japanese firm with a minority stake in Ark that it has partnered with to advise on several funds.
When combined, the pair own more than 25% of at least three businesses: Compugen Ltd., Organovo Holdings Inc. and Intellia Therapeutics Inc. Together they control 20% or more of an additional 10 companies. These concentrations would appear to exist because several Nikko products follow the investment blueprint provided by Ark. (…)
“The biggest risk has everything to do with their footprint,” said Ben Johnson, Morningstar’s global director of ETF research. “Even treading lightly, they’re going to have some sort of market impact that is going to push prices against them.”
In other words, fund outflows could have an outsized impact on the shares held by Ark and Nikko if they are forced to sell. (…)
In general, companies heavily owned by Ark show higher-than-average short interest, though it’s impossible to say if that’s linked to worries about ownership or simply because they are riskier bets.
(…) wagering against Wood hasn’t worked out very well in the past. Almost every bet like that has lost money in the subsequent six months as prices rebounded, Bloomberg Intelligence analyst Eric Balchunas wrote in a note this week.
“The fund’s outflows rarely last, and dips have tended to attract buyers in the past,” Balchunas wrote.

What happened after June 2020 when ARKK started to distance QQQ? Fund flows began to accelerate, perhaps creating a positive feedback loop. Notice how the outperformance skyrocketed after November, right when flows exploded.

The Ark ETFs are investing in rather narrow, emerging themes, with limited numbers of investment candidates. New cash will often buy into the same names. The ARK Innovation fund currently has 48% ($8.5B) of its $17.7 billion assets invested in 10 companies. The other 4 Ark funds have another $3B invested in the same 10 stocks. Three of the 5 Ark ETFs have a 10% weight in TSLA.
Here are Ark’s five ETFs since November with the S&P 500:

When the Stock Boom Turns to Bust
Andy Kessler’s real life experience.
(…) The sentiment is: Assets go up; cash is for losers. That hasn’t been a bad bet. The March 2020 Covid insta-bear market quickly returned to an insta-bull market. So how do you know when to jump off the runaway train instead of being run over by one? (…)
In the mid-1990s, my partner and I ran a small-cap tech hedge fund. We experienced (and I’m putting it nicely) turbulence when Federal Reserve Chairman Alan Greenspan proclaimed “irrational exuberance” in December 1996, and again in the summer of 1997 when a currency crisis hit Indonesia, South Korea and Thailand.
We had built a portfolio of what we hoped were the next wave of high-growth technology companies out on the bleeding edge. No one else believed it yet. (…) On most days you owned the expected earnings stream on an exciting future. Other days, you owned a funny piece of paper.
In 1998 there was another Asian currency mess, coupled with a Russian currency debacle. Few knew that hedge-fund geniuses at Long-Term Capital had levered up a bunch of bad bets. And when I say levered, I mean a Chernobyl of debt waiting to blow. It did, that September. (…)
The Dow industrials dropped less than 5%, but our fund was down almost 40% by 8:30 a.m. (…) Dot-com names peaked in early 2000, but selling picked up in October and never really stopped until 2003, with the market down a third. (…) Sure enough, after 2000, high-flying tech names were down 90%. Many went to zero.
How do these bull bashes end? When the last skeptical buyer finally sees the light and buys into the dream that every car will be electric, that crypto replaces gold and banks, that we overindulge on vertically farmed “plant-based steaks” while streaming “Bridgerton” Season 5 before we hop on an air taxi for our flight to Mars. Those last skeptics (maybe already) convince themselves there’s no longer any downside. And then boom, it’s over.
Bull markets need fuel. When the marginal buyer is done, there are no more greater fools to buy in, no matter how well companies actually perform. The dream is priced in, and firms can only meet, not beat, expectations.
For those lulled by today’s bull market, remember that you own a piece of paper. Low-yielding U.S. Treasury bills and bonds are safe because they are backed by the U.S. government, by cash flow of tax dollars and by the country’s assets (think land, not Fort Knox). Stocks are backed by expectations of future earnings, but if you overpay during periods of high expectations (like today), then your downside is huge. Crypto is backed simply by the faith of those who proclaim it is a store of value. Even art and exotic cars and silly NFT tokens are backed only by faith the wealthy will overpay for uniqueness. Faith becomes scarce when the selling starts.
SPAC ATTACK

The Sucker in the SPAC Market and why the Bubble will Pop
By Irv Schlussel, Managing Director at IngleSea Capital
(…) I have been investing in SPACs for over ten years as an arbitrageur. I rarely have the intention of holding shares through the deal or “De-SPACing.” Prior to the second half of 2020, most deals ended up trading at or just below cash in trust, incenting a redemption for cash rather than the selling of shares on the open market. This phenomenon changed after NIKOLA and Virgin Galactic as investors started paying a premium for the hot deals. Today, almost all SPAC shares are trading at a substantial premium of 2-3% above their cash in trust. This is down from 8-9% a few weeks ago and could quickly go negative.
Historically, the sucker has been the guy who buys the SPAC and owns it on the back by rolling his shares into the newly merged company. Industry research shows that, for the SPACs that completed de-SPAC transactions between 2015 and July 2020, their shares delivered an average loss of 18.8%. That compares with the average after-market return from traditional IPOs of 37.2% since 2015. These days, most SPACs are doing bad deals and overpaying by a premium of say 20% to capture the sponsor economics (more on this later). That back-end investor is also giving up a 20% promote and is likely buying the stock post-IPO at a premium of say $0.50. So, in total, in he is overpaying by almost 50% for this stock.
The Value Chain & Why This Will Go Away: Prior to the middle of last year, 60% of SPAC $ were redeemed. Today that is 0, as they all trade well above cash in trust. Once the bubble bursts, the SPACs will no longer trade at a premium to their value of “Cash in Trust.” Arbs will be the holder base and they will redeem for “Cash in Trust.” The value that the sponsors currently bring to the acquiree is the stupid cash that is rolling into the deal at an aggressive valuation. This value has been increasingly accessible given the bubble, as historically most SPAC money is redeemed.
This is a retail/bubble driven phenomenon where investors opt to stay in deals at inflated values. When this goes away, the huge amount of SPAC equity capital contributed to recent raises may well end up being the loser. Those sponsors will have to do genuinely good deals to convince investors to participate rather than redeeming the shares.
I have seen an 11% number quoted for the % of SPACs liquidating over the past 10 years, but what that does not capture is the number of deals where the sponsor forfeits his upside to get the deal done, as historically, he has brought far less cash into the deal. At that point, the sponsor is only providing a shell. With the number of available SPAC shells increasing every day, their value declines, as does the liquidity profile for the shares on the back end, and thus the true exit value for the acquiree.
Why will it pop?
• Simple issue of Supply and Demand: In January, issuance was $63B. February is projected to be on Pace. If this continues, even with a moderate slowdown ($20B of net monthly issuance), I estimate total notional SPAC $ outstanding will be around $200B by mid-2021 and $320B at year-end.
• The SPAC IPO narrative will break down: The view is that SPACS are now the preferred route to IPO: SPACS are now more mainstream, but the perceived speedy path to issuance for a lower quality company understates the hidden costs. The standard fee structure associated with SPACS is a 20% promote (paid in shares). This fee remains regardless of how poorly the SPAC trades on the backend and well exceeds costs of a traditional IPO. The lack of disclosure required for SPAC reverse mergers may cause SEC concern and potential changes. In the past few months, we have seen fraud and disclosure issues (Nikola, Clover Health) that may draw regulator attention. If the market cooled down, the appetite for newer issues would decline and we will be left with too many SPAC shells with lesser prospects.
 Covid-19 Pill Shows Promise in Preliminary Testing The antiviral reduced infectious virus in Covid-19 patients in a mid-stage study. Larger trials are under way exploring whether it prevents severe illness and death.
The pill, which is being developed by Ridgeback Biotherapeutics LP and Merck MRK 1.33% & Co., significantly reduced infectious virus in subjects in a mid-stage study after five days of treatment, Ridgeback is reporting at a virtual meeting of infectious-disease scientists Saturday.
Further study of the experimental antiviral is under way. If it proves capable of treating people with Covid-19 who show symptoms, the drug would bolster a limited arsenal of treatments and be the first oral antiviral against the disease. (…)
The experimental drug, named molnupiravir, could fill an important role by also helping people who are sick but still at home, serving the same kind of role performed by Tamiflu for the flu, some infectious-disease experts say. (…)
Tests didn’t detect infectious virus in any of the study volunteers who took molnupiravir twice a day after five days of treatment, while 24% of subjects who received a placebo did, Ridgeback reported at the virtual Conference on Retroviruses and Opportunistic Infections.
Subjects who took larger doses of the drug also had lower levels of infectious virus than the placebo group after three days.
Ridgeback Biotherapeutics co-founder Wayne Holman said the results indicate the drug prevents the new coronavirus from replicating in the body and offer the first proof that an oral antiviral drug can be effective against the virus.
The findings also suggest, but don’t prove, that the drug can reduce illness, said Dr. Holman, who is also the chief executive of Ridgeback Capital, an investment firm. Ridgeback Biotherapeutics has an approved treatment for Ebola.
Merck said it may have interim results by the end of this month of two late-stage trials exploring whether molnupiravir helps prevent Covid-19 hospitalizations and deaths.