Payroll employment rises by 194,000 in September; unemployment rate declines to 4.8%
Thus far this year, monthly job growth has averaged 561,000.
The change in total nonfarm payroll employment for July was revised up by 38,000, from +1,053,000 to +1,091,000, and the change for August was revised up by 131,000, from +235,000 to +366,000. With these revisions, employment in July and August combined is 169,000 higher than previously reported. (…)
U.S. Initial Unemployment Insurance Claims Drop Sharply
The labor market continues to strengthen. Initial claims for unemployment insurance fell to 326,000 (-58.3% y/y) during the week ended October 2 from 364,000 in the prior week, revised from 362,000. The Action Economics Forecast Survey expected 348,000 initial claims in the latest week. The four-week moving average of initial claims rose to 344,000.
Initial claims for the federal Pandemic Unemployment Assistance (PUA) program in the week ended October 2 were 23,453 (-93.8% y/y) versus 17,687 in the previous week. The latest number was the highest in four weeks, but remained near the lowest level since the program began on April 4, 2020 at the start of the pandemic. By comparison, these claims averaged 107,756 per week during August. The PUA program provided benefits to individuals who are not eligible for regular state unemployment insurance benefits, such as the self-employed. This program expired on September 6, explaining the smaller number of new claims during the latest several of weeks. Given the brief history of this program, these and other COVID-related series are not seasonally adjusted.
Continued weekly claims for regular state unemployment insurance fell during the week of September 25 to 2.714 million (-74.1% y/y) from 2.811 million in the prior week, revised from 2.802 million. The insured rate of unemployment slipped to 2.0% from 2.1%.
Continued weekly claims in the Pandemic Assistance Program (PUA) program dove to 647,690 from 1.059 million in the September 18 week (-94.0% y/y) as the program wound down. Continued weekly claims for Pandemic Emergency Unemployment Compensation (PEUC) fell sharply to 630,814 in the week of September 18, down from 991,813 in the prior week and 3.645 million in the week before that. This program covered people who had exhausted their state unemployment insurance benefits.
In the week ended September 18, the total number of all state, federal, PUA and PEUC continued claims fell sharply w/w to 4.173 million from 11.250 million two weeks earlier. These total claims averaged 8.139 million over the four weeks ended September 18. These figures are not seasonally adjusted.
 (Bespoke)
Bank of Canada Sees ‘Good Rebound’ Despite Rising Inflation Risk
Bank of Canada Governor Tiff Macklem said the economic recovery is on track despite disappointing output growth, but warned there’s a risk high inflation could prove more persistent than expected. (…)
Macklem said supply disruptions and price pressures are “proving more complicated, they are continuing, so there is some risk that there’s a bit more persistence than we previously thought.” However, he added there are still “good reasons” to believe high inflation will be temporary. (…)
Manheim Market Report (MMR) values saw accelerating weekly increases throughout September. Over the full four weeks in the month, the Three-Year-Old Index increased a net 4.6%. (…)
Data: Manheim Used Vehicle Value Index; Chart: Axios Visuals
Using a rolling seven-day estimate of used retail days’ supply based on vAuto data, we see that used retail supply peaked at 114 days on April 8, 2020. Normal used retail supply is about 44 days’ supply. It ended September at 37 days, which is below normal levels. We estimate that wholesale supply peaked at 149 days on April 9, 2020, when normal supply is 23. It ended September at 18 days. (…)

- High demand even at higher prices
Levi Strauss uses 2 pounds of cotton in every pair of pants, CFO Harmit Singh said on Wednesday’s earnings call.To help cover its skyrocketing costs for the material, the company has raised its average selling prices by more than 10% over 2019 levels. Despite higher costs, lean inventories and shoppers’ willingness to pay up are helping big companies continue to grow. Levi’s gross margins were a record 57.5%. (Axios)

By Michael Cembalest, Chairman of Market and Investment Strategy for J.P. Morgan Asset & Wealth Management
The global supply chain mess will require increased global vaccination and acquired immunity, semiconductor capacity expansion and the end of extraordinary housing/labor supports to resolve. We expect all three to occur over the next few months, leading to a global growth bounce in 2022.
The containership industry is a good illustration of the supply chain mess: more than 70 containerships are stacked up outside Los Angeles/Long Beach ports waiting to unload. Idle containerships are back to just 3% of the total fleet, shipping costs are surging, manufacturing delivery times are extended and rail shipments are declining sharply from their summer peak, illustrating the far reaching impact of the delays. (…)
Note that global supply chain problems are not getting better as growth momentum slows, since production growth is declining as fast as new order growth. For all the clients that have asked me about the political and economic problems associated with the rise of autonomous vehicles and more unemployed truckers, I keep telling them they’ve got it backwards: the US has had a trucker shortage for the last few years, and it’s projected to get worse. In other words, COVID has worsened some existing vulnerabilities in the US supply chain, just as global trade is surging. As for the August US inflation report in which CPI came in lower than expectations, that was mostly a function of COVID related declines in airfare, lodging and rental cars. These categories will probably bounce back when the Delta wave fades, and the other categories are still rising sharply.
First, the world is going to need more containers, which carry more than 90% of the world’s traded goods. Chinese companies affiliated with its government make 95% of the world’s containers and have ramped up production. The number of containerships in service is rising as well, albeit more slowly; again, China stands to benefit as the world’s largest shipbuilder (37% of the shipbuilding market in 2019 by deadweight, and 45% of all new shipbuilding orders). (…)
But more containers and containerships won’t solve problems in the West unless other supply chain issues are resolved as well. That will probably require (a) an end to extraordinary housing and income support measures, and (b) less community spread and concern about COVID. (…)
Housing and income policy may have to normalize before labor supplies do. G7 manufacturing wages are rising at a very high rate given the prevailing level of unemployment, another sign of labor markets whose supply-demand equilibrium has shifted. By the way, I find it interesting that some people arguing for continued extension of COVID benefits also argue for the largest amount of new Congressional spending ($3.5 trillion), without explaining what that might do to current labor shortages, where all these new workers are supposed to come from and how all that spending might impact inflation and Fed policy. In August, 50% of small business owners said they had job openings they already couldn’t fill, the highest level on record. (…)
Vaccination rates have hit 70% in Malaysia; while they are still less than 50% in Indonesia, Thailand, Philippines and Vietnam, acquired immunity appears to be playing a role now as well. Furthermore, mRNA vaccines should make greater inroads in the entire region in 2022, displacing Chinese vaccines with lower observed efficacy. (…)

Michael Cembalest, a banker, is talking of a resolution “over the next few months”.
Hapag-Lloyd CEO Rolf Habben Jansen, a shipper, does not see much light before February/March:
“The worst numbers we have seen so far were in the month of August, where the time that it takes us to get a container back is up about 20%, which also means that we need 20% more containers than we normally need to transport the same amount of volume.
“The same goes for voyage delays,” Habben Jansen said. “We also have seen these delays go up, and if we look at the situation today, we are probably in the peak of the problems. … The already congested supply chain is getting congested even further.” (…)
In many ports at the moment, capacity remains strained. This is the case in Asia, where we have significant delays when we look at Korea, we have significant delays when we look at China, also Singapore [is] not as smooth as it normally runs. If you go to Europe, especially in the north, [there are] definitely a number of ports where we have very significant waiting times,” he said.
“If we look at the United States, that’s probably where we still have most of the difficulties, not only in LA/Long Beach but also in other ports on the West Coast, but also increasingly at ports on the East Coast, where places like Savannah and New York are heavily congested.” (…)
“Let’s not forget that these difficulties are in many cases not limited to the ports only, but we also have bottlenecks on inland transportation. The most obvious bottlenecks, they’re definitely in the U.S., but also in places like the U.K., and in some places in Europe we also see that shortage of available inland capacity [is] prominent.” (…)
“If we look at the operational challenges that we have, they are currently still very, very significant, and we do not expect to see any normalization until Chinese New Year ’22,” he said. “I would seriously hope that after that, we will see a gradual normalization — until we go into the next peak season of 2022.” (H/T ZeroHedge)
China’s Energy Crisis Is Hitting Everything From iPhones to Milk The hit from China’s energy crunch is starting to ripple throughout the globe, hurting everyone from Toyota Motor Corp. to Australian sheep farmers and makers of cardboard boxes.
The extreme electricity shortage caused by soaring prices of coal in the world’s largest exporter is set to hurt China’s own growth, and the knock-on impact to supply chains could crimp a global economy struggling to emerge from the pandemic. (…)
At Citigroup, a vulnerability index indicates that exporters of inputs to China’s manufacturing sector as well as commodities are particularly at risk to a weakening Chinese economy. Neighbors like Taiwan and Korea are sensitive, as are metal exporters such as Australia and Chile, and key trading partners such as Germany are also somewhat exposed.
As for global consumers, the question is whether manufacturers and retailers will absorb higher costs or will pass them along.
“This is looking like another stagflationary shock for manufacturing, not just for China but for the world,” said Craig Botham, chief China economist at Pantheon Macroeconomics. “The price increases by now are pretty broad-based — a consequence of China’s deep involvement in global supply chains.”
(…) power use curbs on the most energy-intensive industries such as steel, aluminum and cement will persist for months and China will continue to aggressively target imports of natural gas, adding to global price pressures, they said.
Some industries are already under pressure, and the damage they’re seeing could fan out to other sectors. (…)
- China orders coal miners to boost output to counter energy crunch Move to keep factories running risks undermining President Xi Jinping’s climate promises
- EU energy chief says gas price surge has no quick fixes
- Europe’s electricity generation from wind blown off course Drop in wind speeds linked to ‘global stilling’ and climate change, scientists say
- IEA chief says Russia has substantial scope to boost Europe’s gas supplies
Investors pile into cash and TIPS in week to Wednesday – BofA
Investors ploughed $14.9 billion into cash in the week to Wednesday and snapped up $1.8 billion of inflation protected U.S. Treasuries as markets suffered a major sell off, a round-up by BofA on flow number based on EPFR data showed on Friday.
Fixed income markets attracted the smallest weekly inflow since March at $3.9 billion with investment grade securities attracting just $2.1 billion and both high-yield and emerging market bonds suffering outflow, the BofA report noted.
Equities sucked in $13 billion with Japan stocks enjoying the best inflows since April 2019 at $4.3 billion and U.S. stocks gaining $71 million, while their European peers suffered a 1.3 billion outflow.
“Late-60s/70s “stagflation” winners were real assets, real estate, commodities, volatility, cash, EM, all of which held their own vs inflation; losers were bonds, credit, equities, tech, all of which ultimately struggled,” strategist Michael Hartnett said in the note to clients.
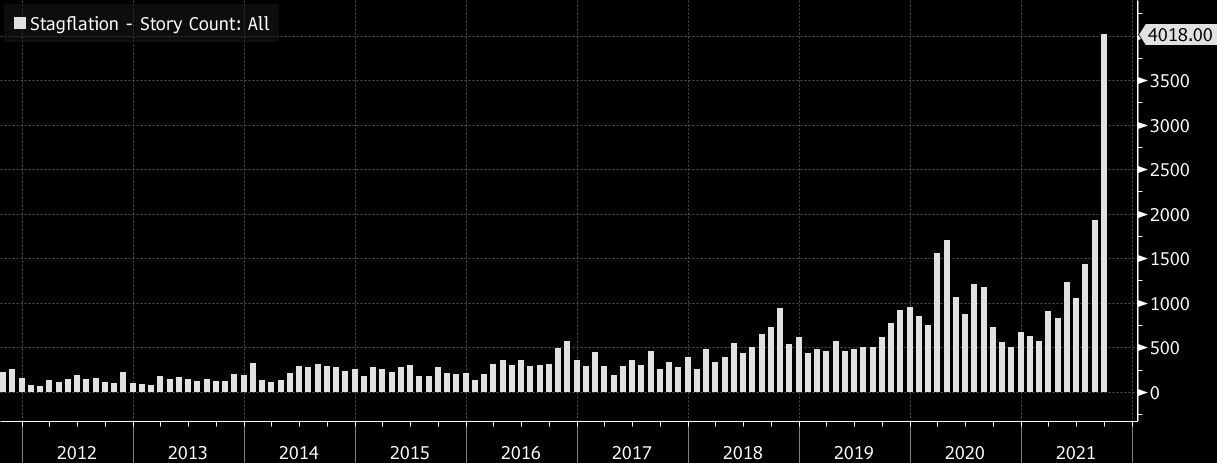
- More than 4,000 stories mentioned the word “#stagflation” in September, 2X as many as in August, itself a record high going back to 2012