![]() Note: I am currently travelling. Hence the more limited postings.
Note: I am currently travelling. Hence the more limited postings.
EMPLOYMENT WATCH
US Initial Jobless Claims Rose Last Week, State Data Suggest
Initial claims increased to about 228,000 in the week ended Nov. 1 from a revised 219,000 in the prior week, the Labor Department data suggest.
The Labor Department hasn’t issued its weekly report since Sept. 25 because of the government shutdown, but it did make downloadable data available for most states. Bloomberg News adjusted those raw numbers using pre-released weekly seasonal factors from the Bureau of Labor Statistics.
When data from all states are included, this approach comes close to matching the official seasonally adjusted figures. However, the latest weekly data was unavailable for New Mexico and the Virgin Islands. For those locations, Bloomberg News substituted the average of the prior four weeks.
Continuing claims, a proxy for the number of people receiving benefits, edged up to 1.96 million in the week ended Oct. 25 from 1.95 million, Bloomberg News calculated.
-
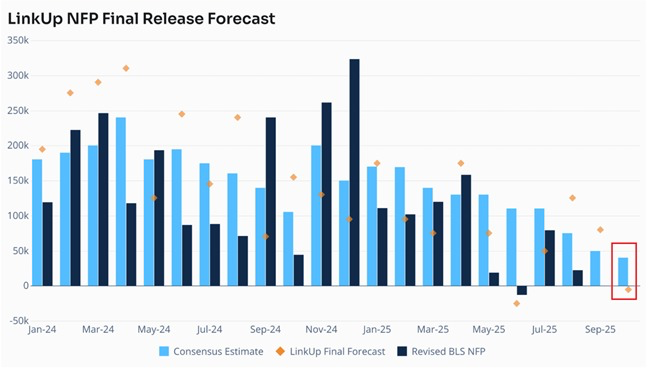
LinkUp estimates show the US economy lost -5,000 jobs in October, the 2nd negative monthly reading since January 2021. LinkUp uses a dataset of real-time job postings, sourced directly from company websites across the country. This comes as new and total job listings declined -4% and -2% MoM, respectively. This also marks a significant drop from the September forecast of +80,000 jobs added. The job market needs help. @KobeissiLetter
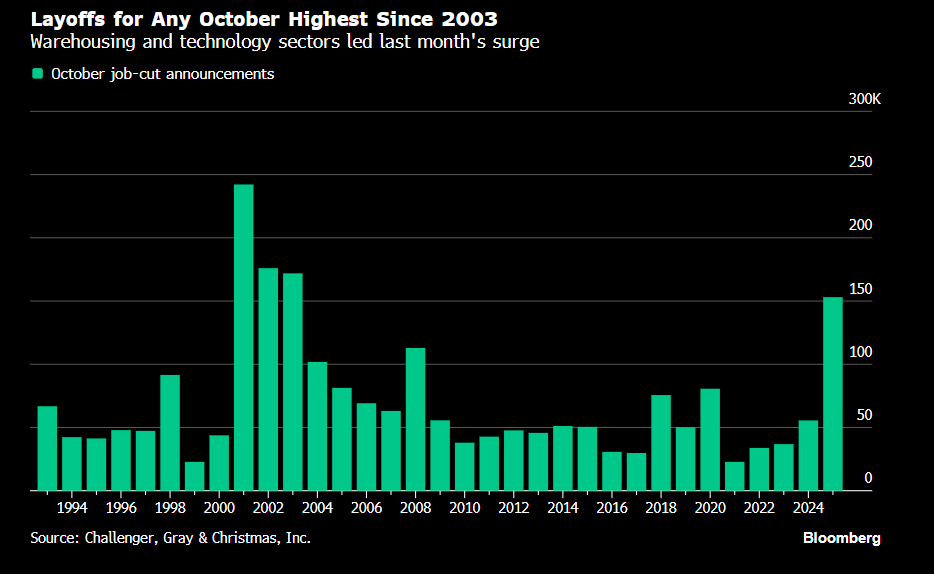
US companies announced the most job cuts for any October in more than two decades as artificial intelligence reshapes industries and cost-cutting accelerates, according to data from outplacement firm Challenger, Gray & Christmas Inc.
Companies announced 153,074 job cuts last month, almost triple the number during the same month last year and driven by the technology and warehousing sectors. It’s the most for any October since 2003, when the advent of cellphones was similarly disruptive, said Andy Challenger, the company’s chief revenue officer.
The numbers are weak no matter how they’re spliced. Year-to-date job cuts have exceeded 1 million, the most since the pandemic. In the same period, US-based employers have announced the fewest hiring plans since 2011. Seasonal hiring plans through October are the lowest since Challenger started tracking them in 2012. (…)
Separate data out Thursday from Revelio Labs showed US overall employment fell about 9,000 in October, largely reflecting a decline in the government sector. Smaller decreases were noted at manufacturers, retailers and wholesalers, while education and health services led those industries increasing employment.
Data from the workforce intelligence firm also showed an increase in the number of employees who were issued layoff notices last month. Those figures are drawn from so-called WARN notices that require companies with at least 100 workers to issue advance notice of plans to lay off at least 50 employees.
- Challenging The Challenger Report (Ed Yardeni)
(…) The actual number of layoffs during the month was 153,074, as the report notes in its first sentence. So far, October’s jump hasn’t been confirmed by initial unemployment claims. The official data are available only through September 19 because of the government shutdown.
But Bloomberg News estimates that jobless claims decreased to about 218,000 in the week ended October 25 from a revised 231,000 in the prior week. Those are low readings.
Most of October’s announced layoffs occurred in the warehouse and technology industries (chart). Automation and robotics are boosting productivity in warehousing. AI is doing the same in technology. (…)
There was a big jump in October’s warehouse-related announced layoffs. That’s odd since the holiday season should keep warehouses very busy. Again, this spike is probably primarily attributable to productivity gains, especially in online retailers’ inventory management.
Meanwhile, announced hiring plans also spiked higher in October, according to seasonally adjusted data. (…)
As seen above, Bloomberg calculates that initial claims increased to about 228,000 in the week ended Nov. 1 from a revised 219,000 in the prior week. Also, keep in mind that Challenger’s numbers are announced layoffs which normally take 1-2 months before the actual layoffs.
Also, explaining layoffs is fine, but they are still layoffs.
- Data suggests the slowdown in employment growth has not intensified (The Bank of America Institute):
What can Bank of America internal data tell us about the state of the labor market in October? In our view, while our data continues to suggest the labor market has cooled over recent months, there was no sign of a further deceleration in October.
We use Bank of America internal deposit data to estimate a payrolls series by looking at how the number of customer accounts receiving a paycheck is changing. This data can be fairly noisy, partly due to seasonal variation. However, looking at a three-month moving average, Exhibit 1 suggests that the year-over-year (YoY) growth in this measure remained around 0.5% YoY in October, very similar to the growth rate in September. So, while this data does suggest a slowdown in jobs growth has taken place since the summer, it tends to suggest that for now at least, there is no further deceleration.
Bank of America deposit data suggests some easing in after-tax wage and salary growth. Higher-income households’ after-tax wage and salary growth was 3.7% YoY in October, while for middle-income households it was 2.0% YoY and for lower-income households it was up 1.0% YoY. Although these changes are relatively small compared to September, they could suggest some easing in pay pressure, in our view.


The last official data available on consumer spending is August when spending accelerated to +5.5% YoY while labor income decelerated to +4.4%.

The Bank of America data above suggest that labor income growth decelerated further since and could be closer to 2.5-3.5% in Q4, roughly in line with inflation. Will Americans dip into their savings to secure a merry Christmas?
Through Oct. 31, Indeed job postings keep falling, now almost back to pre-pandemic levels:

Meanwhile, the GDPNow model estimate for real GDP growth in the third quarter of 2025 is 4.0 percent.

Good luck with your economic forecasts…
…and your earnings estimates:
K-Shaped Economy for Firms
Since earlier this year, earnings expectations have increased for the Magnificent Seven and declined for the S&P 493.


Sources: Bloomberg, Apollo Chief Economist
US Services PMIs
S&P Global’s: Upturn in services growth tainted by higher costs and reduced optimism about the year ahead
The headline S&P Global US Services PMI® Business Activity Index edged higher in October, rising to 54.8 from September’s 54.2. Remaining above the critical 50.0 no-change mark for a thirty-third successive month, the index was consistent with a marked rate of growth that was slightly above the survey trend.
Supporting growth in activity was a solid, and slightly faster, increase in new business volumes. Panelists reported that client demand and enquiry levels had improved since September, although some ongoing uncertainty created by tariffs and government policies placed a limit on demand growth. This was especially the case for international customers, with a marginal decline in new export business recorded in October for the sixth time in the past seven months.
With activity rising to a quicker degree than overall new work, service providers were broadly able to keep on top of their workloads in October. Although rising overall for an eighth month in succession, levels of work outstanding increased only marginally and to the softest degree since March. Additional employment numbers also helped to limit backlog growth, with latest data signaling an eighth consecutive monthly increase in staffing levels. As well as dealing with greater workloads, staff were hired to support new projects and sales efforts.
Whilst improving since September, the rate of employment growth was only modest amid some reports that leavers were not being replaced. This partly stemmed from cost considerations, with service providers noting that labor related expenses had been a source of increased overall operating expenses during October. Tariffs were also reported to have driven up input costs since September.
Although steep, input costs rose to the slowest degree in six months, which helped to explain a similar slowdown in the rate of selling price inflation (also the weakest since April). Panelists reported that competitive pressures had limited the degree to which higher costs could be passed onto clients.
Finally, looking ahead, service providers remained positive about future activity levels during October, albeit to a reduced degree compared to September. Interest rate cuts were reported to have bolstered sentiment, with firms expecting these to support improved spending and economic output. Firms were more uncertain however when considering the role of federal government policies in supporting growth
Chris Williamson, Chief Business Economist at S&P Global Market Intelligence
“October’s final PMI data add to signs that the US economy has entered the fourth quarter with strong momentum. Growth in the vast services economy has picked up speed to accompany an improved performance in the manufacturing sector. In total, business activity is growing at a rate commensurate with GDP rising at an annualized pace of around 2.5% after a similarly solid expansion was signalled for the third quarter.
“While growth is being driven principally by the financial services and tech sectors, the survey is also picking up signs of improving demand from consumers.
“However, there are signs that new business is coming at the cost of service providers having to soak up continued high input price growth to remain competitive. Customers are often pushing back on price rises, especially in consumer-facing markets. While good news in terms of inflation, this lack of pricing power hints at weak underlying demand and lower profits.
“Business expectations about the year ahead have also fallen sharply and are now running at one of the lowest levels seen over the past three years, as signs of spending caution from customers is accompanied by heightened political and economic uncertainty. However, lower interest rates have helped offset some of the drags to business confidence, for which the October FOMC rate cut will have likely helped further.”

The ISM:
The overall ISM rose to 52.4 in October amid a general firming in conditions last month. Select industry comments were fairly mixed with some commenting on strong or steady business conditions, while others continued to emphasize uncertainty around tariffs and the government shutdown impacting activity.
The main activity measures bounced back last month, which is encouraging and suggests September’s weakness may overstate the current extent of slowdown in the sector. Business activity rose 4.4 points to 54.3 after slipping temporarily below the 50-line designating expansion from contraction in September, while new orders leaped 5.8 points to 56.2. These components have been volatile this year, but suggest current production held up and demand firmed somewhat last month. Order backlogs have come down somewhat as well, perhaps a result of steadier current conditions, though inventories are reported as too high relative to demand.
Source: Insitute for Supply Management and Wells Fargo Economics
Firmer activity looks to have come with more price pressure. The prices paid metric rose to a near-three-year high of 70.0 in October with 16 of the 18 services industries included reporting paying higher prices during the month and just the mining industry reporting declines. This comes despite realized services-consumer disinflation offsetting tariff-induced price pressure on core goods so far this year. While that suggests we may see more pass through to consumer services prices ahead, this survey includes goods-related industries like retail, construction and agriculture.
Service-sector hiring improved somewhat with the employment component rising last month, but at 48.2 it remains consistent with sector-level layoffs. Just four industries reported an increase in employment, including retail trade, which likely included seasonal-workers ahead of the all-important holiday-shopping season. Ten of the 18 included industries reported a decline in employment, though an included comment gets at the no-hire, no-fire labor market: “We have not replaced employees who have left through attrition.”
Separately released data this morning on private hiring from ADP showed a rebound in October hiring after a contraction in September. Even so, the trend in hiring remains weak with this measure slipping to just 3,000 workers hired on average over the past three months with most of the hiring being done at large firms. State-level jobless claims data suggest there’s still a lid on outright firings despite some large companies making announcements in recent weeks. Chair Powell responded to a question about this in last week’s post-meeting press conference saying they’re watching it “very, very, very carefully.”
Source: Institute for Supply Management and Wells Fargo Economics


Chinese Exports Unexpectedly Slump for First Time Since February
Exports fell for the first time in eight months, dropping 1.1% from a year earlier, according to official data released Friday. Shipments to all nations except the US rose 3.1%, not enough to compensate for the more than 25% decline to America.
“If the strength in exports cannot be sustained, China’s growth could face a ‘triple whammy’ from the prolonged contraction in the property sector, and weakened private consumption and exports,” Barclays economists including Yingke Zhou said in a note. (…)
And if the slowdown in demand from the rest of the globe continues, that could pull down shipments and the broader economy in the final two months of the year. Already last quarter China’s economic growth decelerated to the weakest pace in a year even as exports boomed.
It risks an even steeper slowdown in the months ahead. Analysts forecast the weakest growth this quarter since the final three months of 2022, when the nation was nearing the end of debilitating Covid Zero lockdowns.
The weakness looked to be broad in October, when shipments to the European Union climbed 1%, the slowest growth since a drop in February.
Exports to some other major markets fell, with sales to South Korea, Russia and Canada all dropping by double digits. (…)
China’s overall imports slowed sharply in October and grew 1%, leaving a surplus of $90.1 billion.
The yuan provided less of a boost to exports after appreciating this year against the dollar and reaching its strongest in close to a year last month. The gains make Chinese goods relatively more expensive to customers abroad. (…)
The weakness in sales to non-US markets in Latin America and the 10 Southeast Asian nations in the Asean group “hints that the yuan’s relative strength and Mexico’s import curbs are beginning to be a factor,” according to Lee at Lombard Odier Singapore.
Even so, Chinese export prices have fallen in every month but one since mid-2023 due to domestic deflation, compensating for the stronger currency and making shipments cheaper.
As a result, Chinese companies will likely continue to add to the inroads made abroad during the trade war with the US. Signs of a recovery appeared at the end of last month, as the number of containers handled in Chinese ports jumped almost 14% in the week ending Nov. 2.
“While payback effects from earlier front-loading may weigh on export growth somewhat in the coming months, we expect China’s export growth to remain resilient in 2026 on structural tailwinds,” Goldman Sachs Group Inc. analysts led by Xinquan Chen said in a note.

Canada’s Economy Starts to Buckle Under Trump’s Tariffs America’s second-largest trading partner is flirting with a recession and grappling with rising unemployment
(…) The unemployment rate in Ontario, Canada’s most populous province, was 7.9% in September, above the national rate of 7.1%. The rate in the auto-manufacturing hub of Windsor is higher than 11%. The province’s gross domestic product is projected to grow only 0.9% this year and 1.0% next year, according to a report by the Financial Accountability Office of Ontario.
Quebec, home to large steel and aluminum smelters and pulp-and-paper and forestry industries that employ more than 80,000 people, might grow only 0.6% this year and 0.9% next year, according to BMO Economics.
Canadian manufacturing exports, almost all of which go to the U.S., were 15.6% lower in August than in February, the last month before Trump imposed new tariffs, said Dennis Darby, president of the Canadian Manufacturers & Exporters industry group. The sector has lost 35,000 jobs since the end of February, while business investment has stalled. Few companies are willing to invest in existing factories or open new ones as long as trade uncertainty persists, he said. (…)
Tiff Macklem, the governor of the Bank of Canada, last month said the tariff war had “destroyed some of the capacity in this country.” The central bank cut interest rates and issued a forecast of “very modest growth.” The economy shrank by 1.6% in the second quarter, and a rebound in the months since has been tepid. (…)
Carney acknowledged as much on Tuesday. His government laid out a federal budget that proposed capital spending and tax incentives of roughly 280 billion Canadian dollars, or the equivalent of nearly $200 billion, over the next five years to boost investments in the Canadian economy.
The Canadian government’s new spending plans will push Canada’s deficit to its highest levels since the financial crisis. (…)
Canada Services PMI: Return to growth of service sector in October
- Marginal rise in activity despite further fall in new business volumes
- Spare capacity persists and employment down again
- Operating costs rise steeply

A Chinese E.V. Delivers the Host, and a Message, at the Global Climate Summit The climate-friendly ride, part of a fleet assembled to shuttle delegations to the gathering in Brazil, sent a clear signal: China is making inroads in Latin America.
(…) That Brazil chose Chinese electric vehicles as the official means of transporting Mr. Lula and other world leaders sent a clear signal to many: In its quest to transform its roads and its economy, Latin America’s largest nation would be turning to China.
The gesture highlighted the spectacular inroads that Chinese climate technologies have made in Brazil. It also underscored the absence of the United States at this year’s talks, known as COP30, which President Trump is not attending.
“The world is moving on, even without U.S. political and technological leadership,” said Scott Kennedy, a senior adviser at the Center for Strategic and International Studies, a Washington research organization. “With these cars, Brazil is signaling that it has other options.” (…)
While European and American automakers have struggled to pivot to making vehicles powered by electricity, China has gained ground by offering electric cars built with advanced technologies at lower prices than those of competitors like Tesla. This has made Chinese cars especially attractive in developing countries with less spending power. (…)
Chinese electric cars have been rapidly gaining market share in Asia and Europe, now accounting for roughly two-thirds of the global market. In Brazil, the world’s sixth-largest car market, over 80 percent of electric vehicles sold are Chinese.
And Chinese automakers have made it clear that they have even bigger plans for Latin America.
Last month, BYD inaugurated its biggest factory outside Asia, at a plant in Bahia State, in northeastern Brazil, that was once run by Ford. Also this year, GWM, another Chinese company, took over a massive plant that once belonged to the German automaker Mercedes-Benz. The plan is to sell the electric cars produced at these factories across Brazil and the rest of Latin America. (…)
It is already clear whether electric vehicles are leaving a mark on Brazilian cities, including in Belém, a port city of 1.3 million near the mouth of the Amazon River that is frequently choked by traffic.
On a weekday just before the summit kicked off, the streets were gridlocked, but the clouds of exhaust were thinner than they had once been. The roads were dotted with electric cars, humming quietly in the midday traffic. Dignitaries zipped around in convoys made up of GWM pickup trucks, their windows frosted by air-conditioning. Electric buses shuttled passengers around the city.
“This technology is transforming the whole world,” Mr. Kennedy said. “And China has jumped into this space.”
FYI:

 Data: Polymarket. Chart: Axios Visuals
![]() Smart AI: learn to learn: https://www.youtube.com/watch?v=bpc0QOAohl8
Smart AI: learn to learn: https://www.youtube.com/watch?v=bpc0QOAohl8