New home sales during June declined 6.8% to 482,000 following a revised 1.1% May drop to 517,000, initially reported as 546,000. April sales also were revised lower to 523,000 from 534,000. Sales were at the lowest level since November and 11.6% below the February peak of 545,000. The latest decline contrasts with Wednesday’s report of a 3.2% rise in sales of existing homes. The latest figure disappointed expectations for 549,000 in the Action Economics Forecast Survey. Sales are quoted at seasonally adjusted annual rates.
Sales results continued to vary around the country. In the West, sales declined 17.0% from May to 112,000 (+10.9% y/y). It was the lowest sales level since last July. Sales in the Midwest were off 11.1% (+5.7% y/y) to 56,000, the least since February. Sales in the South fell 4.1% to 282,000 (+23.7% y/y), the lowest level since December. To the upside, sales in the Northeast posted a 28.0% gain (23.1% y/y) to 32,000. They remained, however, 15.8% below the peak reached in May of last year.
The inventory of unsold homes increased to 215,000 (8.6% y/y). The months’ sales supply of new homes also increased m/m to 5.4 months, the highest level since November. The length of time to sell a new home nudged up from June to 4.0 months but was down from 14.0 months at the end of 2009.


The median new-home price declined 2 percent versus the prior year for a second straight month to $281,800 in June. New-home price appreciation may decelerate faster than the existing-home market as pricing power fades amid stretched affordability. The new-home price premium fell to 19 percent versus the resale market in June, compared with the 17 percent historical average. Average prices may drift lower as the recovery expands to include more entry-level buyers. Builders have however noted a somewhat firmer pricing markets of late.
GROWTH, WAGES, INFLATION: Two good analysis:
(…) The FOMC will release its next policy statement on Wednesday. Since its last meeting in June, reported inflation data have barely changed, but there has been a drop of about 19 per cent in the price of oil, and a rise of about 2 per cent in the dollar exchange rate. These two variables were specifically identified when the Fed decided to delay interest rate rises earlier in the year, and the fixed income markets are beginning to think that the same might happen again in the run up to the September meeting. (…)
My colleagues at Fulcrum have estimated a VAR model that tracks the effects of oil and the dollar on reported inflation, and we use this model to predict the future path for inflation, given the recent renewed decline in oil prices (which was not built into the Fed’s June forecast). Here are the results:

This model is not suitable for analysing long-term shifts in underlying inflation because it does not include deep fundamentals like the state of the labour market, and the formation mechanism for inflation expectations. But it should do a reasonable job in making short-term predictions when the oil price and the dollar are moving a great deal, as they are now.
The model suggests that headline PCE inflation will remain around zero until October, 2015 and will then rise to almost 2 per cent by the end of 2016 (mainly because the oil price is expected to stop falling). The core PCE inflation rate, meanwhile, rises gradually from its current level of 1.2 per cent, reaching 1.4 per cent in September and 1.6 per cent at the end of 2015, staying there for much of 2016.
The issue is whether these subdued paths for headline and core inflation are sufficient to enable the FOMC to say that it is “reasonably confident” that inflation is returning to target. On balance, I expect that they will be.
Lately, Janet Yellen has openly accepted that headline inflation will stay close to zero for a while, saying that this is due to temporary oil and dollar effects. So she is unlikely to be surprised by headline inflation prints close to zero during the summer. Meanwhile, she has focused very specifically on the strengthening in the labour market, and not on actual inflation data, as the key for policy:
So I think we need to see additional strength in the labor market and the economy moving somewhat closer to capacity—the output gap shrinking—in order to have confidence that inflation will move back up to 2 percent, but we have made some progress (June FOMC press conference).
This indicates that the FOMC will be willing to announce lift off even in the presence of very low inflation prints, provided that the labour market continues to improve.
 Elsewhere, other important members of the FOMC like William Dudley have also suggested that they will become more confident about a September rate increase if real GDP continues to grow at about the 2.5 per cent rate that has been in place since the spring. All this suggests that it is reported economic activity and employment releases, rather than the next few months of inflation data, that will critically influence the Fed’s decision in September.
This raises one more question, which is why the Fed considers the labour market to be so important in determining future inflation, given the fact that there has been relatively little connection between them for many years now. A clue to this came in the embarrassing and unintended release of the Fed staff ‘s economic forecasts after the June FOMC meeting.
 These forecasts, which are usually kept confidential for five years, showed that the Fed’s economic staff believes that the output gap is now very narrow, at only 1.04 per cent, and that it will disappear almost entirely in 2016. This is based on their estimate that the natural rate of unemployment is 5.2 per cent, only 0.1 per cent below today’s actual unemployment rate.
Furthermore, the staff believes that potential output growth is now only 1.6 per cent, which is well below the current GDP growth rate in the economy. In other words, economic slack is disappearing fast and, on this assessment, the US will not achieve “lowflation forever” unless GDP growth slows down, and unemployment stops falling, in the near future.
It is clear that this unexpectedly pessimistic assessment of the supply side of the economy is the main reason why FOMC members believe that an increase in rates will shortly be necessary. Admittedly, the staff’s economic forecast shows that GDP growth will slow to an average of only 2 per cent after 2016, and they expect that this anaemic growth rate will keep inflation within the 2 per cent target. They also believe that this slowdown will be achieved with only one rate rise this year and with a lower trajectory for rates over the next three years than appears in the FOMC’s famous “dots” plot.
But the “dots” show the view of the official policy makers on the FOMC and they seem to believe that more insurance is needed to maintain a “lowflation” outcome, given the weakness of the supply side in the US economy.
It is the FOMC members more hawkish view, not the staff’s interest rate forecast, that ultimately counts for policy decisions.
(…) Turn to the Fed’s thinking on the first rate hike as described in the minutes of the June FOMC meeting:
In considering the Committee’s criteria for beginning policy normalization, all members but one indicated that they would need to see more evidence that economic growth was sufficiently strong and labor market conditions had firmed enough to return inflation to the Committee’s longer-run objective over the medium term.
Break that up into three parts—growth, labor, and inflation. On the first point, incoming data suggest activity held firm in the weeks following the June FOMC meeting. The Federal Reserve Bank of Atlanta’s GDPNow measure has been modestly gaining ground:
 Source: Tim Duy/Atlanta Fed
Note this range remains broadly consistent with the central tendency estimates of potential growth from the Fed’s Summary of Economic Projections. In other words, actual growth rebounded to—or perhaps even a bit above—potential growth. Policymakers will take comfort in these numbers as they confirm their suspicion that first-quarter weakness was largely much ado about nothing. In addition, authorities in Europe dialed back the tail-end risk from the Greek crisis, eliminating at least momentarily one impediment to hiking rates. China, however, still remains a wild card. On net, concerns over the growth outlook eased somewhat since the June meeting, increasing the Fed’s willingness to consider September.
Similarly, labor market data show steady underlying trends despite a first-quarter swoon, with job growth rebounding: Source: Tim Duy
Meanwhile, measures of labor underutilization generally continued their slow yet steady improvement in June. Underlying growth, it seems, remains sufficiently strong to drive further improvement in the labor market.
But is the combination of the growth and employment outlook sufficient for FOMC members to be confident that inflation will return to target? If these numbers hold or improve for another six weeks, the answer will probably be yes by the time the September meeting rolls around.
Consider first that with both oil prices and the dollar stabilizing since the beginning of the year, the transitory impact on inflation fades.
Second, the Fed will point to other measures of inflation as evidence that its preferred measure, PCE inflation, will trend toward target over time. Notably, core CPI is tracking higher than core PCE: Source: Tim Duy
Also, core PCE closed in on target on a three-month basis, providing substantial reason for policymakers to believe the deceleration of the latter part of 2015 has largely played itself out: Source: Tim Duy
And note that Fed officials may believe they’re really not that far, if at all, from target in the first place.
The Federal Reserve Bank of San Francisco recently concluded:
Taking into account the volatility of monthly inflation rates, the recent departure of 12-month inflation from the 2% target rate does not appear particularly significant or permanent in comparison with earlier episodes. Moreover, since the early 1990s, the empirical Phillips curve relationship that links inflation to the deviations of production or employment from their longer-term trends appears roughly stable. Hence, continued improvements in production and employment relative to their long-run trends would be expected to put upward pressure on inflation.
Below target inflation? Where? Move along, folks, nothing to see here. Yet even if the inflation picture firms while the labor market continues to improve, it’s worth asking: Is that same labor market sufficiently tight to justify a rate hike? Policymakers need a reasonable level of confidence that full employment lurks around the bend. We’re getting closer, to be sure, but stubbornly persistent weak wage growth belies the conjecture that little slack remains.
Still, evidence mounts that the wage growth story is turning, a point highlighted by none other than Federal Reserve Chair Janet Yellen:
Finally, the pace of wage increases also may help shed some light on the degree of labor market slack, since wage movements historically have tended to respond to the degree of tightness in the labor market. Here too, however, the signal is not entirely clear, as other factors such as longer-run trends in productivity growth also generally influence the growth of compensation. Key measures of hourly labor compensation rose at an annual rate of only around 2 percent through most of the recovery. More recently, however, some tentative hints of a pickup in the pace of wage gains may indicate that the objective of full employment is coming closer into view.
More anecdotal evidence of an inflection point comes from the July Beige Book:
Wage pressures were modest across most areas of the country, outside of some specialized skill and high-demand occupations in sectors such as information technology, transportation, and construction. Reports from Kansas City and San Francisco were more robust, indicating intensifying wage pressure across a broader range of industries. Cleveland, Chicago, and San Francisco all highlighted a growing sense among business contacts that recent announcements of minimum wage hikes and pay increases at a number of large retailers could prompt broader wage pressure across other industries as firms compete to remain attractive employers.
Overall, I sense there is a growing confidence among policymakers that wage growth will soon accelerate. That confidence is likely sufficient enough to move the Fed closer to the first rate hike. Still, hard data is better than anecdotes. Solid evidence of accelerating wage growth in the next two labor reports would go a long way toward convincing FOMC members that they could safely move in September.
Would Yellen acquiesce to a September rate hike?
While she is viewed as supporting only a single hike in 2015, there’s no reason to believe that hike must come in December. Yellen has made two points abundantly clear with respect to policy normalization: She prefers “early and gradual” over “late and steep,” and she anticipates policy will not be on a preset path as it was in the last tightening cycle. As pointed out by Greg Ip, these preferences justify a September rate hike on a risk management basis. The risk of policy shifting to “late and steep” only increases as the economy approaches full employment. The Fed can address that risk by moving in September. But a hike in September does not guarantee a hike in December; the Fed could take a pass at that meeting. Hence, Yellen could move in September and, if justified by the data, deliver only one 25-basis-point rate hike in 2015, while at the same time throwing the Fed hawks a bone.
Bottom Line: At this week’s meeting, policymakers will be judging the distance to the first rate hike. I think they will make their way through an analysis similar to above and conclude that distance has certainly closed since the last FOMC meeting. Indeed, probably closed enough to put September firmly on the table. But will they lay down any markers? They’ll likely not add language that promises a hike in September; they want to conduct policy on a meeting-by-meeting basis. But be on the watch for any change in the statement that might point to an increasing confidence that the economy is on the right track. That would be a good signal that September is alive and well.
Now this…
More Layoffs Expected at U.S. Energy Firms U.S. energy companies are planning more layoffs, asset sales and financial maneuvers to deal with a recent, sudden drop in U.S. crude-oil prices to under $50 a barrel, the lowest level in four months.
(…) Oil-field services providers that help drill wells have quietly revealed job cuts that were deeper than initially announced, and warned of more layoffs to come. Halliburton Co.and Baker Hughes Inc., two big service companies that plan to merge, disclosed last week that they had cut 27,000 jobs between them, double the 13,500 they announced in February.
Initially, Halliburton expected to reduce its workforce by 8%, but ultimately cut it by 16%. Baker Hughes first announced it would cut about 10% of its jobs, but cut 21%. (…)
Nearly 50,000 energy jobs have been lost in the past three months on top of 100,000 employees laid off since oil prices started to tumble last fall, according to Graves & Co., a Houston energy consultancy. Initial rounds of layoffs this year tended to be blue-collar jobs, such as roughnecks on drilling sites, fracking crews and workers at industrial-equipment manufacturers.
Now the job cuts are starting to extend to engineers and scientists.
ConocoPhillips, one of the world’s largest oil-and-gas exploration companies, has already cut nearly 1,500 jobs so far this year, according to Graves. But the Houston-based company is planning more layoffs for this fall that could number into the thousands, according to people familiar with the matter. (…)
The problem is partly of the companies’ own making. Even as they slashed their budgets and drilled fewer wells, they coaxed more fuel out of the ground than ever before. American oil production finally appears to be flattening out after climbing sharply for five years, but U.S. Energy Department now pegs it at 9.7 million barrels a day, the highest since 1971. (…)
Oil-hedging programs that protected many companies from falling prices will begin expiring this fall, leaving them exposed to the low price of crude. Those with lots of debt and poor liquidity could be forced into bankruptcy; others with valuable pipelines or oil-and-gas fields might have to start selling off assets to raise cash, according to Simmons & Co. International, an energy investment bank.
U.S. producers have typically hedged 50% of their projected annual oil output, but most are heading into 2016 with hedges that cover just 15% of the oil they expect to pump. (…)
Energy producers have been able to forestall many effects of oil’s downturn in part because investors still wanted to put money into the industry, because many banks were forecasting that oil prices would rebound in the second half of 2015. During the first half of the year, 57 energy companies issued $21 billion in new equity, and 58 more issued $73 billion in new debt, according to Moody’s.
That now looks unlikely and easy access to capital is ending, said Lloyd Byrne, an energy analyst at Nomura Group, a financial services company. Recent offerings haven’t been well received, debt is no longer low-cost and share prices are languishing. (…)
In another sign of stress, Chesapeake Energy Corp. said last week it would eliminate its annual shareholder dividend. The U.S. shale driller said the move will save it $240 million in payouts that it can plow back into capital spending to help it survive 2016.
Morgan Stanley warned recently that the current downturn could be even worse than the one that crippled the industry in 1980s. If Saudi Arabia and Iraq keep running full tilt and Libya and Iran get their oil production back on track, crude prices could languish below $60 for the next three years, said Martijn Rats, an analyst.
“On current trajectory, this downturn could become worse than 1986,” he said.
Crude-by-rail volumes on Union Pacific’s rail network declined sharply in the second quarter over the comparable period in 2014, executives said in an earnings call Thursday. The weak pricing environment in crude oil markets drove down crude oil volumes by 29% to 25,200 carloads, but this impact was partly offset by a 10% increase in LPG volumes to 43,300 carloads, Union Pacific Executive Vice President of Marketing and Sales Eric Butler said. Union Pacific expects crude volumes to face continued headwinds going forward in the second half of 2015.
…And that:
(…) A broad two-year slump in commodity prices has eliminated tens of thousands of mining-related jobs across the world, from gold mines in South Africa and steelworks in the U.S. Midwest to producers of uranium in Australia and iron ore in Canada.
In the U.S. alone, mining-sector employment declined in June to its lowest level in five years, according to the Bureau of Labor Statistics. In Australia, where much of the global mining industry is based, mining employment in the June-ended quarter was down 13% from a year earlier, according to government figures.
More job cuts could be coming, with copper and gold hitting new multiyear lows on Friday after significantly weaker-than-expected manufacturing data was released in China.
“We’re prepared to take steps to respond to the weaker economy” globally, Richard Adkerson, chief executive of copper miner Freeport-McMoRan, Inc., the U.S.’s biggest mining company, told analysts Thursday. (…)
Miners raced to snap up mining assets, spending billions amid expectations that a “supercycle” boom would continue indefinitely [even though that has never happened!]. Anglo-American bet $8.8 billion on Minas-Rio, a Brazilian project it continues to develop despite crumbling iron-ore prices. BHP Billiton in 2011 shelled out $12 billion for a U.S. shale-gas company—which is now tagged for a $2 billion write-down. Rio Tinto’s $6.2 billion copper and gold mine in Mongolia has encountered ballooning costs and frequent roadblocks to production.
Mining executives, as well as investors in commodities and commodity-sensitive companies, will never learn! 
SENTIMENT WATCH
U.S. equities are being pushed along by the fewest stocks in more than 15 years, a sign of fatigue in a bull market that already rivals anything since World War II in duration.
More than 100 percent of this year’s increase in the Standard & Poor’s 500 Index is attributable to two sectors, health-care and retail. That’s the tightest clustering for an advancing year since at least 2000, data compiled by Bloomberg show.
Breadth has fallen apart in a rally that is now the third longest since 1940, leaving investors exposed after three years without a 10 percent correction. Adding to concerns: the two industries shouldering this year’s advance trade at more than 22 times annual earnings — a 20 percent premium to everything else. (…)
Health-care companies have led the bull market since the start of 2013, rising 87 percent to push their price-earnings ratio to 23.4, about 40 percent higher than its average since 2010. Consumer discretionary shares, the next-best performer with a 66 percent advance, cost 22.3 times annual profit, compared with a five-year average of 18.
Even though equities are stuck in the tightest range ever, fewer stocks are keeping pace with the market. The S&P 500 Equal Weight Index is down 0.9 percent in 2015, trailing the market-cap weighted measure by 1.9 percentage points. (…)
-
The Only Six Stocks That Matter Amazon, Google, Apple and just a few other firms account for the bulk of Nasdaq Composite gains this year; that worries some analysts
Six firms— Amazon.com Inc., Google Inc., Apple Inc., Facebook Inc., Netflix Inc. andGilead Sciences Inc.—now account for more than half of the $664 billion in value added this year to the Nasdaq Composite Index, according to data compiled by brokerage firm JonesTrading.
Amazon, Google, Apple, Facebook, Gilead and Walt Disney Co. account for more than all of the $199 billion in market-capitalization gains in the S&P 500.
The concentrated gains are spurring concerns that soft trading in much of the market could presage a pullback in the indexes. Many investors see echoes of prior market tops—including the 2007 peak and the late 1990s frenzy—when fewer and fewer stocks lifted the broader market. The S&P 500 is up 1% this year while the Nasdaq has gained 7.4%.
Other indicators are also flashing yellow. In the Nasdaq, falling stocks have outnumbered rising stocks this year, sending the “advance-decline line” into negative territory, a phenomenon that has come before market downturns in the past, investors and analysts said.
Last Monday, as the S&P approached a record, nearly as many stocks hit one-year lows as one-year highs, according to Ned Davis Research, another sometime precursor to rocky times and a flip from 2014 and 2013 when the market rose more broadly. (…)
Energy and materials stocks have slumped amid a downturn in commodity prices, while rising bond yields have dented high-dividend payers like utilities. Even shares of some longtime technology stalwarts have faltered. Shares of chip maker Intel Corp. are down 23% this year, while cellphone technology firm Qualcomm Inc. is down 17%. (…)
 “The game is not so simple where you can have a checklist that says, this has happened and that has happened” before a market pullback, said Doug Ramsey, chief investment officer at Leuthold Weeden Capital Management.
Let’s turn to the main ingredient for equity markets:
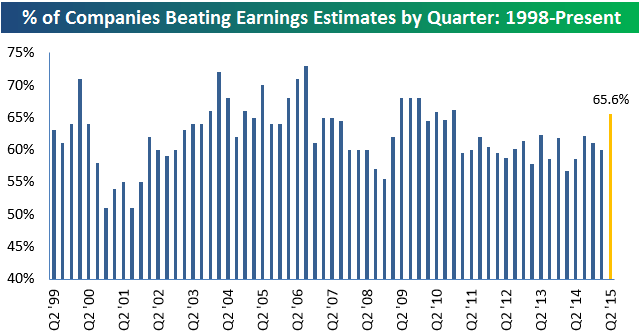
EARNINGS WATCH
So far this earnings season, 523 companies have reported their quarterly numbers. Of those 523 companies, 65.6% have reported EPS that were stronger than consensus analyst expectations. Historically, the average beat rate has been right around 60%, so this season is stronger than average thus far.

That was for the NYSE. From Factset on the S&P 500 companies:
With 37% of the companies [187 companies but 52% of the market cap] in the S&P 500 reporting actual results for Q2 to date, more companies are reporting actual EPS above estimates (76%) and fewer companies are reporting actual sales above estimates (54%) compared to the 5-year averages. In aggregate, companies are reporting earnings that are 4.6% above the estimates.
This surprise percentage is slightly above the 1-year (+4.5%) average but slightly below the 5-year (+5.0%) average.
Due to companies beating earnings estimates in aggregate and upward revisions to estimates for companies yet to report, the blended (combines actual results for companies that have reported and estimated results for companies yet to report) earnings decline for Q2 2015 is now -2.2% [-3.6% one week ago]. This is a smaller decline than the estimate of- 4.5% at the end of the second quarter (June 30).
If the Energy sector is excluded, the blended earnings growth rate for the S&P 500 would jump to 4.1% [+2.6% one week ago] from -2.2%.
In aggregate, companies are reporting sales that are 0.3% above expectations. This surprise percentage is below the 1-year (+0.9%) average and below the 5-year (+0.7%) average.
Due to companies beating revenue estimates in aggregate and upward revisions to estimates for companies yet to report, the blended revenue decline for Q2 2015 is now -4.0. This is also a smaller decline than the estimate of -4.4% at the end of the second quarter (June 30).
At this point in time, 27 companies in the index have issued EPS guidance for Q3 2015. Of these 27 companies, 20 have issued negative EPS guidance and 7 have issued positive EPS guidance. Thus, the percentage of companies issuing negative EPS guidance to date for the third quarter is 74%. This percentage is above the 5-year average of 70%.
At this time last year, 47 companies had preannounced with 68% (32 companies) negative.
S&P’s tally estimates Q2 EPS at $28.41, down from $28.53 on July 17 and $28.81 on June 30th. Trailing EPS would thus be $110.57 after Q2, down from $110.60 July 17. Q3 and Q4 estimates have not changed much ($29.59 for Q3 and $31.56 for Q4 which would take trailing EPS to $110.56 after Q3 and to $15.37 after Q4).
Note that S&P decided to treat Microsoft’s $8.4B write-down of its Nokia investment as “extraordinary” and excluded it from “Operating Earnings”.
The chart below is based on the S&P 500 pre-opening this morning of 2071:

Note that the yellow line is trending down given that trailing earnings are weakening while inflation has edged upwards to +1.8% this year. Fair P/E, as per the Rule of 20, is 18.2x. Fair value on the S&P 500 Index is thus 2012, down from 2107 last February and 2.8% below current levels. This fair value headwind will remain until after the Q3 earnings season (end of October) unless inflation turns lower.
 The S&P 500 200-day moving average stands at 2064 and is still rising, unlike the 100-d. m.a. which has turned down first on July and again last Friday. Then, there is this 4-year channel…

Meanwhile,
China Stocks Suffer Sharpest Daily Fall in More Than Eight Years China stocks plunged 8.5%, their sharpest daily percentage decline since 2007, as worries mount that authorities are pulling back on measures to prop up the market.
China’s main index is up 6% from its recent low on July 8, but still off 28% from its high in June. The smaller Shenzhen Composite fell 7% to 2160.09 and the small-cap ChiNext Closed 7.4% Lower at 2683.45.
Analysts say investors fearful the government would curb its purchases of blue-chip stocks sparked Monday’s selling. Others said officials could be testing whether the market can support itself.
Authorities may want to “test whether the market has recovered its resilience,” said Fu Xuejun, a strategist at Huarong Securities. “The government wants to use state funds to stabilize the market, not to prop it back to 5000 points overnight.” (…)
More than half of the stocks in the Shanghai Composite hit their down limit on Monday. While limits on sharp stock movements prevented hundreds of stocks from logging sharper declines, they also can make it harder for investors to exit positions. China’s market rules prevent share prices from moving freely once they rise or fall by 10%.
Meanwhile, hundreds of stocks that were halted during the throes of the rout have returned to trade. Still, investors spooked that suspensions would lock up capital have been pulling out of Chinese stocks for the past few weeks. Investors sold stocks during 13 of the past 16 trading sessions via the Shanghai-Hong Kong Stock Connect, a trading link connecting the two cities that launched in November. Cumulative outflows now total 39.9 billion yuan.
Disappointing economic data also could be adding to the gloom. Earlier, data showed industrial profits in China falling 0.3% in June from a year ago, after rising the previous two months. (…)

A main critique of the government’s plan is that it is simply unsustainable. Beijing may have hoped that it could prop up the market long enough for economic and earnings growth to catch up and make valuations more reasonable.
With the economy growing at a slower pace than a year ago, it will be difficult for companies to generate top-line growth.
And valuations are still extremely high. The overall Shanghai market trades at 15 times forward earnings, near its long-term average—but strip out China’s banks, which investors have shunned for fear of hidden bad loans, and ratios look much higher. The tech-heavy Shenzhen market, for instance, traded at 31 times forward earnings, 65% above its historical average, before Monday’s fall.
Earnings multiples have expanded in the past few weeks. But that’s partly because earnings expectations are cratering. Over the past four weeks, Nomura notes, analysts have slashed Shanghai-listed companies’ earnings-growth expectations for the coming year to 10% from 13%.
BTW, 1500 companies were halted limit down on Monday!
This chart from BloombergBriefs is another proof that earnings do matter:


 The Signal In Silver (Part II) (Charles Gave)