Boost to Household Income Primes Economy for Growth U.S. household income jumped 10% in January as the government delivered stimulus payments to households and consumer spending rose 2.4%, priming the economy for a burst in growth this year.
Household income—the amount Americans received from wages, investments and government programs—rose 10% in January from the previous month, the Commerce Department said Friday. The increase was the second largest on record, eclipsed only by last April’s gain, when the federal government sent an initial round of pandemic-relief payments. Household income has risen 13% since February 2020, the month before the pandemic shut down large segments of the economy.
January’s increase in household income was almost entirely due to federal pandemic-relief aid included in a $900 billion stimulus program signed into law in late December. That package included one-time cash payments of $600 and a special weekly unemployment benefit of $300 that the government started sending to households. (…)
Americans last month spent a chunk of their income, boosting spending by 2.4%, the first gain in three months. Households spent broadly on goods, particularly long-lasting big-ticket items. Spending on services also increased for the first time since October. (…)
Household savings totaled $3.9 trillion last month, up from $1.4 trillion last February. (…)
So far, American consumers continue to align their total spending with their labor income. Excess stimmies are used to pay down debt, the rest getting invested or kept in savings accounts.

There is anywhere between 2.0 and 2.5 trillion of excess savings in the USA, over 15% of personal expenditures.

(…) The elevated savings rate isn’t just about government payments. It also stems from the weakness in services spending that has occurred during the Covid-19 crisis as people have forgone things like vacations and dining out. Friday’s report showed that services spending, which accounts for about two-thirds of all consumer spending, was down 5.3% from its year-earlier level. (…)
Federal Reserve figures show that as of the end of the third quarter households had $2.2 trillion more in cash and cash equivalents than at the end of 2019. That amount is undoubtedly higher now and, with another round of government relief in the works, could go higher still. As the pandemic eases, there will be plenty of money to spend. (…)
An analysis of 1.8 million family checking accounts conducted by economists at the JPMorgan Chase Institute shows that as of the end of October the median balance was up by about 40% from a year earlier. And median balances for families in the lowest quarter of the income distribution were up by about 45%. While that figure might have ground lower in November and December, it probably got a bump up with the latest payment round. (…)
Also consider that credit card borrowings have been reduced by 12.5% since March 2020. Buying power!

Feb slowdown:
BofA says it’s the weather:

JPM raises doubts with data that is not entirely apples to apples (via ZH):
Millions of Tenants Fall Further Behind on Rent as Covid Aid Stalls Many states are still determining how to distribute money they have received from the Treasury Department to help an estimated 13 million renters. Meanwhile, Congress is poised to appropriate another $20 billion in rental assistance.
A record 43% of homes spent a week or less on the market. New Listings Fall 17%, Prices Rise 15%
Key housing market takeaways for 400+ U.S. metro areas during the 4-week period ending February 21:
- The median home-sale price increased 15% year over year to $321,250.
- Asking prices of newly listed homes hit a new all-time high of $343,961, up 11% from the same time a year ago.
- Pending home sales were up 18% year over year. (…)
- New listings of homes for sale were down 17% from a year earlier.
- Active listings (the number of homes listed for sale at any point during the period) fell 40% from 2020 to a new all-time low.
- 55% of homes that went under contract had an accepted offer within the first two weeks on the market, well above the 44% rate during the same period a year ago. This is another new all-time high for this measure since at least 2012 (as far back as Redfin’s data for this measure goes). During the week ending February 21, 57% of homes sold in two weeks or less.
- 43% of homes that went under contract had an accepted offer within one week of hitting the market, up from 30% during the same period a year earlier. This is also an all-time high for this measure. During the week ending February 21, 44% sold in one week or less.
- The average sale-to-list price ratio, which measures how close homes are selling to their asking prices, increased slightly to 99.4%—1.6 percentage points higher than a year earlier and an all-time high. During the week ending February 21, the ratio shot up to 99.8%, also an all-time high.
- For the week ending February 21, the seasonally adjusted Redfin Homebuyer Demand Index—a measure of requests for home tours and other services from Redfin agents—was up 35% from the same period a year ago.
- (…) For the week ending February 25, 30-year mortgage rates increased to 2.97%, the highest level since August.
The NY Times:
(…) Right now, in a number of metro areas, home prices and rents aren’t just drifting apart; they’re moving in opposite directions. Prices are rising while rents are falling. (…)
Today, rents have fallen for reasons largely inseparable from the pandemic. Laid-off workers have had to double up with family or friends. College students who normally rent near campus have been at home instead. Some renters enticed by low interest rates have successfully bought a home. And the normal influx of new renters into cities — recent college graduates, immigrants, workers who’ve just landed a new job — has dwindled during the pandemic.
Recent research by Arpit Gupta at N.Y.U. and colleagues suggests that rents have fallen the most in close-in urban neighborhoods. These are also the places where it simply hasn’t made sense in a pandemic to pay a premium in rent to be near restaurants, bars, museums and downtown offices. This has followed another unusual pattern: Single-family rentals are behaving a lot more like owner-occupied houses (in strong demand), while condos look more like rentals (with weak appeal).
These unusual circumstances in the rental market make it all the harder to grapple with what’s happening on the home-owning side. The ratio of home prices to rents in many metros is now as high as it has been since the housing bubble — but it has spiked during the pandemic in part because rents have fallen, not solely because prices have soared.
Mr. Zandi, at Moody’s, said he wasn’t yet anxious about a looming disaster like the last housing bubble. But he says it is already worrisome that rising prices have boxed out many first-time and moderate-income home buyers, who for years to come may lose out on the benefits of locking in interest rates below 3 percent.
“I don’t think it’s red flares; I think it’s yellow flares,” Mr. Zandi said. “But if we have another year like we had in the past year, we’re going to have a lot of red flares going up.” (…)

MANUFACTURING PMIs
Fastest growth of eurozone manufacturing sector for three years
The eurozone’s manufacturing economy performed strongly in February as operating conditions improved to the greatest degree for three years. This was highlighted by the seasonally adjusted headline PMI® which rose to 57.9, up from 54.8 in January and better than the earlier flash reading. The index was above the 50.0 no-change mark that separates growth from contraction for an eighth successive month.

All three broad market groups recorded an improvement in operating conditions during February. Investment goods producers registered the strongest growth (the best since January 2018), followed by intermediate goods. Although consumer goods recorded comparatively modest growth, it was nonetheless its best performance since last September.
Apart from Greece, where the respective PMI slipped back just below 50.0, the upswing in manufacturing growth seen during February was broad-based with all nations r egistering stronger PMI readings compared to January.
Germany and the Netherlands, where export gains remined especially strong, continued to lead the way in terms of overall growth.
Austria posted its best performance for three years, whilst the gains seen in Italy and France were the best since the start of 2018. Comparatively modest growth rates were seen in Spain and Ireland.
The headline eurozone manufacturing PMI was driven higher by sharper gains in both output and new orders, which in each case were the best since last October’s recent peaks. Higher exports were a key driver of overall new order gains, with latest data showing the strongest rise in new export trade since January 2018.
A noticeable feature of February’s survey data was the continued lengthening of delivery times for inputs. Latest figures showed the second-greatest deterioration in lead times since data were first available nearly 24 years ago. Amid widespread reports of delays and difficulties in sourcing inputs thanks to an upturn in global demand and ongoing transportation challenges related to COVID-19, input costs subsequently rose sharply with inflation reaching its highest recorded for nearly a decade.
Cost pressures were especially acute amongst German, Dutch, and Austrian manufacturers, but with market demand improving firms overall were able to pass on a portion of their higher expenses to clients in the form of increased charges. February’s survey showed that output prices amongst eurozone manufacturers rose at the strongest rate since April 2018.
Adding to supply-side challenges was a marked increase in purchasing activity amongst eurozone manufacturers. Latest data showed that firms raised their purchasing activity to the greatest degree for over three years despite utilising existing input inventories wherever possible. Stocks of raw materials and semi-manufactured goods declined for a twenty-fifth successive month.
There was some positive news on the employment front during February, with staffing levels rising overall for the first time in nearly two years. Only Spain recorded a net fall in employment. Companies added to their staff numbers in response to higher overall workloads and signs of capacity pressure: backlogs of work increased in February for the seventh successive month.
Finally, confidence about the future continued to strengthen, with the latest survey showing that optimism hit its highest ever level (expectations data were first available in mid-2012). Growth projections were linked to hopes of a successful rollout of vaccination programmes and a resolution to the pandemic in the coming months.
China: Manufacturing PMI slips to nine-month low in February
PMI data revealed a further, albeit softer, improvement in the health of China’s manufacturing sector in February. Notably, companies recorded slower rises in both output and new work for the third month running. Firms often commented that the coronavirus disease 2019 (COVID-19) pandemic had weighed on demand and impacted business operations in the latest survey period. New export work declined for the second month running, while raw material shortages and transport delays led to a marked lengthening of suppliers’ delivery times. Nonetheless, companies were strongly optimistic that output will rise over the next year amid hopes of a rebound in global economic conditions.
The headline seasonally adjusted Purchasing Managers’ Index ™ (PMI ™ ) slipped from 51.5 in January to 50.9 in February, to signal a marginal improvement in operating conditions. Notably, the rate of improvement was the slowest seen since the current period of recovery began last May.

The fall in the headline index was partly driven by a slower expansion of output. The latest increase in production was modest overall, with growth having eased to a ten-month low. Panel members frequently mentioned that output rose in line with client demand. Total new work expanded at the weakest rate for nine months and only marginally overall. While there were reports of firmer demand conditions, the pandemic and recent rise in cases globally had reportedly weighed on overall sales growth. Notably, new export business declined for the second month in a row.
The sub indexes for output and total new orders fell to the lowest levels in 10 months and nine months, respectively. Overseas demand continued to drag down overall demand as the measure for new export orders remained deep in negative territory for the second consecutive month.

Firms maintained a cautious approach to staffing levels, with employment falling modestly in February. Concurrently, there seemed little pressure on operating capacities, as backlogs of work fell for the first time since last May, albeit marginally.
In line with the trend for new work, buying activity rose only slightly. At the same time, firms registered a second monthly drop in inventories of purchased items, while stocks of finished goods rose marginally.
Stock shortages and restrictions around travel continued to inhibit supplier performance in February. Notably, lead times for inputs lengthened to the greatest extent for nearly a year.
Greater prices for raw materials and higher transport costs led to a further substantial rise in input costs. As a result, prices charged by manufacturers rose solidly as companies looked to partially pass on higher cost burdens to customers.
Manufacturers in China were generally confident that output would increase over the next 12 months. Furthermore, the degree of positive sentiment was the second-highest in six-and-a-half years, supported by forecasts of rising client demand globally once the pandemic comes to an end and planned product releases.
Japan: Manufacturing sector grows for first time since April 2019
Businesses in the Japanese manufacturing sector signalled the first improvement in operating conditions since April 2019 in February. The higher headline PMI® reading was supported by modest expansions in both output and new order inflows. That said, manufacturers commented that supply chain disruption caused by the coronavirus disease 2019 (COVID-19) pandemic contributed to a sharp rise in input prices. As a result, input cost inflation rose to the fastest for two years. Nonetheless, businesses remained optimistic that production would rise over the coming 12 months.
The headline au Jibun Bank Japan Manufacturing Purchasing Managers’ Index™ (PMI) rose to 51.4 in February from 49.8 in January. This indicated the strongest improvement in the health of the sector since December 2018, as Japanese manufacturers gradually recovered from the impact of the pandemic.

The improvement in the headline index was supported by a moderate expansion in output. Production volumes increased for the first time since December 2018, and at the fastest pace since the same period. Firms cited that a gradual recovery in demand had led to increased orders for manufactured goods.
Similarly, new orders expanded for the second successive month in the latest survey period. The pace of growth quickened from January and was the quickest since October 2018. Higher sales were commonly linked to increased orders for new products being launched as the pandemic impacts dissipated. Furthermore, new export sales increased for the first time in four months in February, as demand improved in key external markets, particularly in China.
At the same time, employment levels continued to decrease in February, although the pace was softer than that seen in the previous month and marginal overall. Firms often noted lower capacity requirements due to the pandemic as a key factor in job shedding, as well as the non-replacement of voluntary leavers. Despite an increase in new orders, outstanding business fell further in February. The rate of contraction was only modest, however, and was the softest in the 26-month sequence of decline.
Japanese manufacturers indicated a rise in cost burdens for the ninth consecutive month in the latest survey period. Moreover, the rate of input cost inflation accelerated from January and was the fastest registered for two years. Rising input costs were commonly attributed to higher raw material prices. Manufacturers also sought to partially pass through higher cost burdens to clients through prices charged in February, which increased for the third month in a row.
Despite rises in both production and new orders, buying activity fell for the twenty-sixth month in succession. That said, the decline was only fractional and the softest in the aforementioned sequence. Manufacturers in Japan noted ongoing difficulties in sourcing raw materials due to global COVID-19 restrictions, which led to a further deterioration in delivery times. As a result, firms utilised existing stocks of raw materials and semi-finished goods. A gradual recovery also meant some firms reported that they had streamlined some holdings of both pre-production inventories and finished goods.
Looking forward, business confidence regarding output over the year ahead strengthened to the highest since July 2017. Expectations were underpinned by hopes that an end to the pandemic would further improve operating conditions and support demand.
EARNINGS WATCH
From Refinitiv/IBES:
Through Feb. 26, 479 companies in the S&P 500 Index have reported earnings for Q4 2020. Of these companies, 80.0% reported earnings above analyst expectations and 16.7% reported earnings below analyst expectations. In a typical quarter (since 1994), 65% of companies beat estimates and 20% miss estimates. Over the past four quarters, 76% of companies beat the estimates and 20% missed estimates.
In aggregate, companies are reporting earnings that are 16.5% above estimates, which compares to a long-term (since 1994) average surprise factor of 3.6% and the average surprise factor over the prior four quarters of 12.4%.
Of these companies, 73.7% reported revenue above analyst expectations and 26.3% reported revenue below analyst expectations. In a typical quarter (since 2002), 61% of companies beat estimates and 39% miss estimates. Over the past four quarters, 67% of companies beat the estimates and 33% missed estimates.
In aggregate, companies are reporting revenue that are 2.8% above estimates, which compares to a long-term (since 2002) average surprise factor of 1.0% and the average surprise factor over the prior four quarters of 1.8%.
The estimated earnings growth rate for the S&P 500 for 20Q4 is 4.2%. If the energy sector is excluded, the growth rate improves to 8.2%. The estimated revenue growth rate for the S&P 500 for 20Q4 is 1.6%. If the energy sector is excluded, the growth rate improves to 4.8%.
The estimated earnings growth rate for the S&P 500 for 21Q1 is 21.6%. If the energy sector is excluded, the growth rate improves to 22.8%.
Trailing EPS are now $142.71. Full year 2021: $174.11e. 2022e: $200.78
Earnings estimates continue to be revised up:


Note that upward revisions for non-S&P 500 companies fell to 51.5% last week from 55% and 61% during the two weeks previous respectively.
Guidance for Q1’21 remains positive, in line with Q4’20 guidance but with more companies feeling confident enough to guide.


Rising corporate confidence extends to buyback announcements reaching a new high in 2021:

In no way do we think that Berkshire shares should be repurchased at simply any price. I emphasize that point because American CEOs have an embarrassing record of devoting more company funds to repurchases when prices have risen than when they have tanked. Our approach is exactly the reverse. (Warren Buffett)
This while “insiders continue to signal that the US market is overvalued (…). The [INK] indicator is currently at about 21%, a seven-year low. At 20% there are five stocks with key insider selling for every one with buying.” The only sector with clearly rising insider buying is Utilities. Canadian insiders are much more positive. More details here. 
Bye bye reflation? Is the super commodity cycle already about to end and will it lead to higher real rates once/if the commodity environment turns around?
(…) The super commodity cycle already looks peakish when charted versus the Chinese credit impulse, which may be the single most important driver of the commodity cycle now-a-days. Whether the momentum holds another month or two is a tricky question, but it seems as if it is running on fumes by now – not least as momentum is worsening in various credit impulse indicators.
Commodities vs. the Chinese credit impulse .. OOPS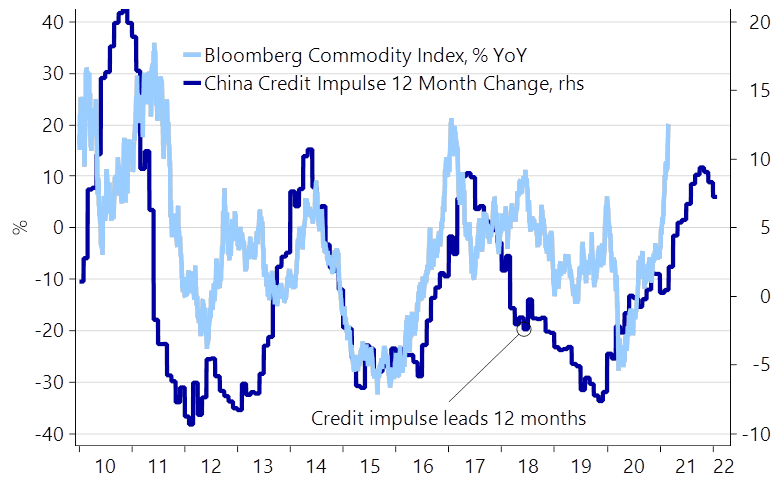
If nominal bond yields refuse to drop back markedly (more than what they already did on Friday), it could lead to a worsening real rates environment during Q2 at the latest, if we pair peakish inflation expectations with a scope for higher nominal bond yields. This is probably the last thing the current positioning in risk assets need. The multiple expansion may be over already, the question is if earnings can catch up enough to make up for the losses. We are not convinced.
Real rates vs. fwd P/Es – not looking pretty..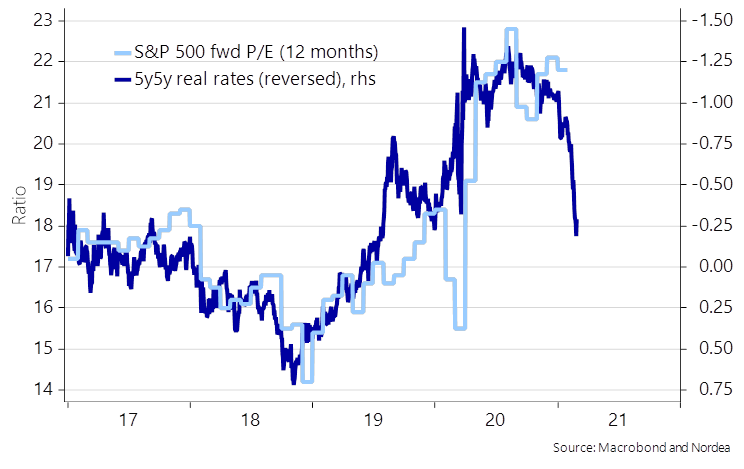
We also still expect to see more steepening ahead. 1.4%-1.5% is still crazy low for the US 10y yield. It should be heading at least to 1.8-2.1% before this is done. What’s more, gauging from the five most recent tightening cycles, the curve tends to peak roughly a year ahead of the first new Fed hike. And surely the Fed won’t hike already in March 2022 (our forecast puts lift-off by end-2022). (…)
US curve has not finished steepening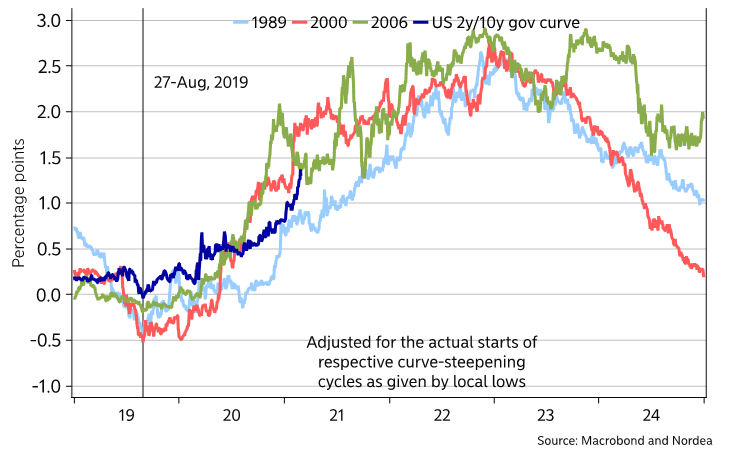
John Authers:
(…) Bond market sell-offs on the scale witnessed in the first two months of 2021 are very unusual, but this one shouldn’t have been that surprising given the extreme valuation that bonds had reached. Bespoke Investment handily produced this chart, of the maximum drawdowns seen in each calendar year since 1988. Just by the end of February, this already ranks as the third worst year for bonds in that time:

How much further could this go? Another measure of how much the bond market is braced for reflation is the steepness of the yield curve. The more the 10-year yield rises relative to the two-year, the more the market has shifted toward a belief in reflation. An upward shift of 75 basis points within six months, as we have just witnessed, is unusual. Bespoke shows all the previous instances since 1977:

The last three all proved false alarms during the post-crisis period. But all of those came with the curve significantly steeper than it is now, and markets soon realized that their hopes for a reignition of economic growth would go unfulfilled. Past shifts to the current level have generally been followed by an even more precipitous move. But both the last two instances, in 2000 and 2008, came just as a recession was starting and not, as now, when one appears already to be over. (…)
It is in Congress that sentiment will have its first critical collision with reality. The second will concern central banks. Do they want to keep yields down and yield curves relatively flat? If so, they can probably make it happen. In this area, Australia, an economy that is at much more risk of overheating than most, leads the world. After the country’s bond yields spiked, the Reserve Bank of Australia announced new purchases of its target three-year notes last week, and kicked off this week with an announcement that it was stepping up purchases of 10-year securities. The response by yields has been immediate. (…)
Most important, of course, will be the Fed, which hasn’t pushed back against rising yields, even verbally, as strongly as other central banks. If they want to make a point, five separate Fed governors give speeches on Monday, while Chairman Jerome Powell is due to speak on Thursday. The Fed’s attitude could move the bond market in either direction, and so Fedspeak is going to be monitored even more closely than usual this week. (…)
Axios adds:
Bank of Japan governor Haruhiko Kuroda told parliament on Friday the BOJ would not allow yields on government debt to continue rising further above the BOJ’s 0% target.
- “It’s important now to keep the entire yield curve stably low as the economy suffers the damage from COVID-19,” Kuroda said, adding that the central bank plans to adjust its yield curve control program.
- The Bank of Korea (BOK) promised as much as $6.3 billion in new bond-buying before the end of June.
The central bank heads taking action — Kuroda, RBA’s Philip Lowe and BOK’s Lee Ju-yeol — are all classically trained macroeconomists who have been at their respective central banks for decades.
- Powell, who is downplaying rising bond yields and encouraging inflation, is a trained lawyer with less than a decade of central bank experience.
WHEN SUPPLY MEETS DEMAND
Undaunted Bulls Keep Shoveling Money Into Stocks
In a week when a spike in Treasury yields pressured prices across the equity spectrum, U.S. exchange-traded funds consistently saw inflows — including $2.7 billion at the height of the carnage on Thursday. All told in February, ETFs sucked in a cool $80 billion, four times the 12-month average, data compiled by Bloomberg show. (…)


Paul Singer Warns of Trouble, and Is Eager to Say ‘Told You So’
Offering a curmudgeonly riposte to today’s raucous financial markets, the 76-year-old billionaire said in a letter to clients of his $42 billion Elliott Management Corp. that a “flamboyant line-up” of excesses will come back to haunt investors. (…)
Rampant inflation will shock policy makers, stock pickers and bond investors, alike.
“‘Trouble ahead’ is signaled by a rare combination of low-quality securities, staggering valuation metrics, overleveraged capital structures, a scarcity of honest profits, a desperate dearth of understanding evinced by the most active traders, and economic macro prospects that are not as thrilling as the mobs braying ‘Buy! Buy!’ seem to think,” he wrote. (…)
While pledging to stick to the basics at his multistrategy operation — which has lost money in just two years since its 1977 inception — Singer exuded frustration at what he sees as the hysteria driving everything from Bitcoin to government debt — a “return-free risk,” as his letter put it. (…)
The firm has registered annualized gains of about 13% in its 44 years, beating the S&P 500 Index.
For a “reality check” on U.S. stocks, he pointed to Musk’s Tesla Inc., which trades at about 1,000 times earnings while “every other major carmaker in the world is rolling out electric vehicles in the near future.” Addressing its shareholders, “good luck ‘you few, you happy few, you band of brothers’ and sisters,” he wrote.
But nothing has exercised the Republican donor like the boom in cryptocurrencies, which he has long called a fraud. (…)
SPAC Frenzy Emboldens Silicon Valley Startups to Forgo Venture Funding Private companies used to raise round after round of venture capital before listing publicly. But thanks to SPACs, more zero-revenue startups than ever before are jumping into the public markets with valuations exceeding $1 billion.
Investors Can’t Get Enough of Europe’s New SPAC Kingpins
(…) In the latest sign of the feverish demand, Russian telecom veteran Ivan Tavrin attracted more than $6 billion of investor orders for his latest pair of blank-check companies, people with knowledge of the matter said. That’s more than 13 times the combined amount the former MegaFon PJSC head was seeking for the two firms, which started trading in New York last week. (…)
Hot Stock Market Pushes More Companies to Go Public The number of firms listed on U.S. exchanges surges the most since the dot-com bubble, reversing a two-decade slump
 (…) That marks a key change because the number of listed companies fell steadily for 20 years, declining from roughly 8,500 in 1997 to 4,500 in 2017, as the internet bubble burst, startups raised huge sums through venture-capital and private-equity firms, and mergers and acquisitions shrunk the pool of public companies. After edging higher in 2018 and 2019, the number of listed companies surged by nearly 200 last year during a record stretch in the market for initial public offerings. (…)
Two-hundred thirty companies have gone public so far this year and raised $78 billion through Wednesday, putting the IPO market on track to shatter last year’s record high of $168 billion, according to Dealogic.
And 120 companies valued at $1 billion or more have gone public through IPOs or SPACs since the end of June, nearly matching the total from the previous nine quarters, according to Mr. Ritter’s data. (…)
Nearly 70% of this year’s IPO activity is in blank-check firms, up from about 20% in 2019 (…). Competition among SPACs is another force inflating startup valuations in public markets, bankers say. There are now about 340 blank-check companies seeking private firms to take public in the next two years, according to data provider SPAC Research, and many of them are pursuing similar deals in buzzy sectors such as electric vehicles. (…)
Deutsche Bank:
“we view surging exposure by new retail investors in the US as having been a key driver of the speed, duration and composition of the equity market rally since the March bottom. Against this backdrop, in coordination with dbDIG we conducted a survey of retail investors to better understand their behavior. More than half of respondents raised their investments in stocks over the past year, with just under half (45%) having invested for the very first time. The group of new retail investors exhibits several characteristics which are markedly different from those that have been trading for longer, and in particular show greater use of leverage, option trading and reliance on social media for investment advice”
FYI:

US removes stumbling block to global deal on digital tax Biden administration drops insistence on ‘safe harbour’ for companies, opening door to agreement
SEC Suspends Trading in 15 Stocks That Got Hyped on Social Media
In a Friday statement, the Securities and Exchange Commission said it temporarily halted trading in 15 companies due to concerns that their stock prices were artificially inflated. One of the companies, a penny stock called Blue Sphere Corp., was recently highlighted in a Bloomberg News story after spiking in value following a barrage of posts on online message boards.
“We proactively monitor for suspicious trading activity tied to stock promotions on social media, and act quickly to stop that trading when appropriate to safeguard the public interest,” Melissa Hodgman, acting director of the SEC’s enforcement division, said in a statement. (…)
Frenetic trading, often in profitless companies, on lightly regulated broker networks is perhaps the most extreme example of speculative excess in the 2021 market (…).
In February, an average of 90 billion shares changed hands each day on venues such those operated by OTC Markets Group — often called “over-the-counter” securities or the “pink sheets.” It added up to roughly 1.7 trillion shares this month, data compiled by Bloomberg Intelligence show. In December, the total exceeded 1 trillion for the first time in a decade. (…)
None of the companies suspended Friday have filed any information with the SEC for over a year. (…)
U.S. to Impose Sweeping Rule Aimed at China Tech Threats The rule enables the Commerce Department to ban technology-related business transactions that it determines pose a national security threat, part of an effort to secure U.S. supply chains.
(…) The rule is “unworkable for U.S. businesses in its current form and should not be considered for final publication without significant revisions,” said the Business Roundtable, a group of CEOs of major companies from Amazon.com Inc. and Citigroup Inc. to Walmart Inc., in a comment filed with the Commerce Department in January. International Business Machines Corp. said the rule as written was “massively overbroad” and would harm the economy while failing to enhance U.S. national security. (…)
The rule could affect as many as 4.5 million American businesses of all sizes, according to a Commerce Department estimate, potentially requiring them to get government clearance for purchases and deals involving sophisticated technology with what the regulation calls a “foreign adversary,” or face potential unwinding of the deals or other enforcement.
The new government oversight would apply to technology transactions involving critical U.S. infrastructure, networks and satellite operations, large data hosting operations, widely used internet connectivity software, and technology used in advanced computing, drones, autonomous systems or advanced robotics, according to a draft rule. It could affect sales or, in some circumstances, use of a technology. (…)
Many business leaders worry that the new rule places too much of the responsibility for mitigating those risks on firms, along with potentially big costs and uncertainty. Some businesses worry they will be required to replace equipment already in use, for instance.
Total compliance costs could reach as much as $52 billion in the first year after implementation, according to the Commerce Department estimate, with annualized costs of as much as $20 billion. (…)
COVID-19
Covid-19 Vaccines Yield Breakthroughs in Long-Term Fight Against Infectious Disease Researchers in gene-based technology produced a class of vaccines they believe can protect against all manner of outbreaks in the years to come
(…) Johnson & Johnson’s Covid-19 vaccine, which was authorized Saturday for use in the U.S., is at the vanguard of a class of shots designed to mobilize a person’s immune defenses against the disease. It will be the first Covid-19 vaccine administered in the U.S. that uses viral-vector technology, which employs an engineered cold virus to ferry coronavirus-fighting genetic code to the body’s cells. (…)
“This is one of those giant leap moments for us. These are fundamental shifts in how we will build vaccines for the future,” said C. Buddy Creech, director of Vanderbilt University’s vaccine research program. “I think this really ushers in a golden age of vaccinology.” (…)
The mRNA vaccines and J&J’s viral-vector shot—developed and tested in months—were propelled by new insights into the immune system that opened the door to engineering a better defense.
Almost like computer programmers, researchers wrote genetic instructions to muster the immune system’s molecular soldiers to fight the coronavirus. The vaccines deliver the programmed genetic code directly to cells in the body. The engineered DNA or RNA serve as a kind of genetic software, commanding the hardware of the human cell to wage battle. (…)
These vaccines offer several advantages over shots using older technology. They seem to activate not just the antibodies that neutralize a virus but also the memory and T-cells that keep the immune defense alert for the long-term. (…)
“The future for pandemic response is that we want something along the lines of what J&J has done, a single shot able to induce immunity,” said Deborah Fuller, a vaccine researcher and professor of microbiology at the University of Washington School of Medicine. (…)
Coronavirus: Can a vaccinated person still spread COVID? Several Israeli research teams are getting ‘very promising’ results that the answer is no.
(…) Earlier this week, a SIREN (SARS-COV2 immunity and reinfection evaluation) report by Public Health England was preprinted online by the peer-reviewed Lancet medical journal that evaluated staff working in publicly funded hospitals in the UK.
The study measured the impact of a single dose of the Pfizer vaccine over an eight-week period and found “strong evidence that vaccinating working-age adults will substantially reduce asymptomatic and symptomatic SARS-CoV-2 infection and therefore reduce transmission of infection in the population.”
Specifically, the report showed that there were 977 new infections during 710,587 person-days of follow-up in the unvaccinated group, an incidence density of 14 infections per 10,000 person-days. In the vaccinated group, 21 days after the first dose, there were 71 new infections, an incident rate of eight per 10,000 person-days of follow up, and nine new infections seven days after the second dose, an incident rate of four per 10,000 person-days of follow up. Person-time, as described by the North Carolina Institute for Public Health, is an estimate of the actual time-at-risk that all participants contributed to a study.
“After controlling for other risk factors… vaccine effectiveness against infection 21 days after the first dose of the Pfizer vaccine in the overall study population was 70% and increased to 85% seven days after the second dose.”
Staff was PCR tested regardless of symptoms in order to detect asymptomatic infection.
In Israel, where nearly 4.6 million people have received at least one jab, data is starting to emerge, as well.
A prepublished study by the Health Ministry and Pfizer that was released through the media showed the vaccine reduces infection, including asymptomatic infection, by 89.4% in people who got two doses of the vaccine compared to unvaccinated people.
However, as noted, the full report has not yet been released and some scientists have said that the report’s methodology may have led to an overestimation of the vaccine’s effect.
Separately, a report by Sheba that was released in the Lancet earlier this month found that among more than 7,000 healthcare workers who received their first dose of the Pfizer vaccine in January, there was a 75% reduction in coronavirus cases within 15 to 28 days.
The hospital’s Regev-Yochay said only 170 people became infected during the two-week period. Of those who contracted the virus, 99 showed symptoms. Eighty-nine of the sick were unvaccinated.
THERE IS also another consideration when it comes to virus transmission, and that is viral load: How much virus can be measured in a patient, which will determine how much virus you are spreading into the air when you breathe or cough. The less virus you spread, the fewer people who are likely to contract the virus from you.
The effect of vaccination on viral loads in coronavirus post-vaccination infections is still unknown, but some studies are starting to surface on that subject too.
A paper published earlier this month on Medrxiv, a non-peer-reviewed health sciences website, by researchers from the Technion-Israel Institute of Technology and Maccabi Health Services, reported that mean viral load substantially decreased 12 days post-vaccination.
“Analyzing positive SARS-CoV-2 test results following inoculation with the BNT162b2 mRNA vaccine [the Pfizer vaccine], we find that the viral load is reduced four-fold for infections occurring 12-28 days after the first dose of vaccine,” the report said. “These reduced viral loads hint to lower infectiousness, further contributing to vaccine impact on virus spread.”
The report was based on an observational study, not a randomized, clinical trial. As such, it had several limitations.
Also, this month, one of the country’s largest testing labs, MyHeritage, published a study comparing the viral load of some 16,000 positive test results between December 1 and January 30. The study was hoping to evaluate if there were any differences between the amount of virus present in people over the age of 60 – the first people in the country to be vaccinated – and those between the ages of 40 and 59, who started vaccinating later.
The lab, together with researchers from some of Israel’s top universities, considered four two-week-long windows, the first three before most of the older population had been vaccinated.
Israel kicked off its vaccination campaign on December 20 with medical workers and the elderly, so by the end of the testing period, around 80% of people over 60 in Israel had received at least one vaccine compared to around 30% or 40% of those ages 40 to 59.
According to the study, in the last two weeks, those over 60 presented a viral load lower by 50% to 95%.
However, here too, there were limitations, such as that the researchers did not know if the people being tested for coronavirus were vaccinated at all, let alone with one or two shots.
Bar-Ilan’s Cohen said there has also been anecdotal evidence surfacing in the country as more people get inoculated.
“We know, for example, that there was an anecdote that two healthcare people who were vaccinated became infected by the virus but no one in their immediate surroundings at home or work got the virus from these people,” Cohen said.
“Somehow the vaccine was protective,” he continued. “But this is only an anecdote. In science, we need real proof, and it is very difficult to do such studies.” (…)


