Senate Democrats Iron Out Details on Covid-19 Aid Package Senate Democrats sought to bridge differences over jobless benefits, aid for state and local governments and $1,400 direct payments as they aim to complete a $1.9 trillion coronavirus relief package and pass it through their chamber in the coming days
(…) Lawmakers are also looking at changing who is eligible to receive the direct payments and reducing a proposed $400 weekly federal supplement to jobless aid to $300. (…) Democrats are expected to approve the legislation—which also expands the child tax credit and funds vaccine distribution, among other measures—in the Senate without Republican support. (…)
“Despite the optimism, without new resources, our entire effort will be set back,” [Biden] said. “The bottom line is we need the American Rescue Plan now, now.”
- Senate Majority Leader Chuck Schumer said Democrats have the votes and plan to pass Biden’s favored $1.9 trillion stimulus bill next week. (CNBC)
BTW 1:
BTW #1a:

Data: Hamilton Place Strategies, CivicScience; Chart: Axios Visuals
BTW #2: Vaccines Promised for All U.S. Adults By the End of May The president said enough vaccines would be available two months earlier than he had previously indicated, after Merck agreed to help Johnson & Johnson produce shots.
BTW #3: 
Texas Governor Lifts Mask Mandate, Business Restrictions Texas businesses will be able to operate at full capacity and state residents will no longer be required to wear masks to visit them beginning March 10, Gov. Greg Abbott said.
Asia’s Champions of Covid-19 Control Fall Behind on Road to Recovery Asian countries led the world in crushing Covid last year, but now they are lagging behind on vaccinations and can’t afford to reopen borders, suggesting their economies may take longer to fully rebound.
(…) Most countries in Asia have only vaccinated a small percentage of their populations, and most Asian economies won’t reach herd immunity until 2022, Goldman Sachs estimates. (…)
That could leave some Asian countries in a holding pattern, forced to keep their borders sealed since their populations have developed little natural immunity to the disease, even as swaths of the world reopen businesses and international travel. (…)
Consumer demand is rebounding faster in the U.S. and Europe than in Asia, a trend that is likely to continue as Asian vaccination rates lag and households remain wary, S&P Global Ratings wrote in a January report. (…)
- US and Asia allies plan Covid vaccine strategy to counter China Biden administration in talks with Japan, India and Australia to distribute jabs across region
Nordea’s take:
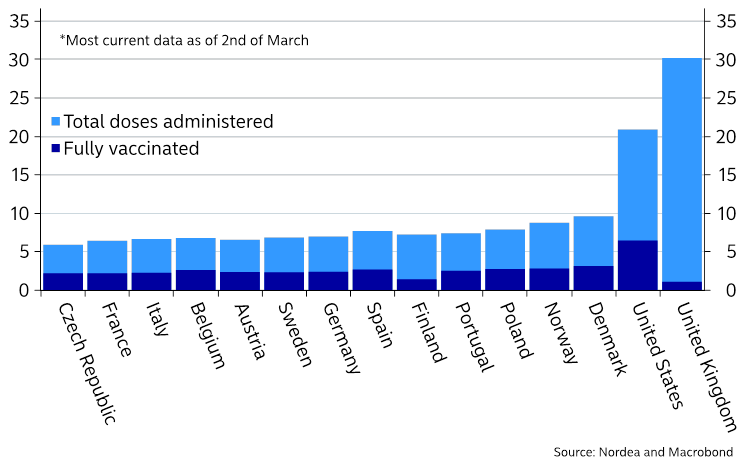
When will economies be allowed to reopen? When are we without restrictions? We take a look at the Israeli case and conclude that 35-37% of the population needs to be vaccinated before a major breakthrough is seen. The UK will soon hit this benchmark, while the US and efficient EU countries (such as Denmark and other Nordic countries)will reach this benchmark in early April. We will be without (most) restrictions sooner than you think. The UK will likely soon move towards a swift reopening, US will follow around Easter, while continental Europe will follow in early May. (…)
Swifter approvals of vaccines, smarter wordings of contracts with suppliers and more funding given to the R&D phase, leaves the UK and US clearly ahead of the EU on the supply front. The UK has also opted for a wide vaccination programme, ensuring a broad immunization before a full immunization of each individual. This has so far proven to be a winning strategy and e.g. Finland now follows roughly the same strategy. (…)
Current pace of vaccinations
One of the key ingredients to a larger progression in the EU will be the addition of JnJ to the supply. EU holds a 300m dose contract with the firm and remember that JnJ provides “full protection” at only one dose. This significantly increases the vaccination progress. (…)
These re-opening dates are still BETTER than consensus expectations, as e.g. the global investor survey hints of a peak positive macro effect from reopening economies towards the end of the summer. It is also clearly a more upbeat scenario than most administrations hold across the globe, and we argue that most virologists are clearly too pessimistic by now. We see a “catch-up” effect in growth coming already in early Q2, which is before broad consensus expectations. (…)
Earlier than expected reopening coupled with a huge Biden package would boost growth forecasts and interest rates. How about inflation? Read Goldman Sachs:
We forecast core PCE inflation to peak at 2.4% in April—bolstered by the year-on-year comparison to the April 2020 lockdowns—and end the year at 2.0%. But how high could core inflation go if mass vaccination unleashes surging demand in virus-sensitive categories?
In our baseline, a partial rebound in four particularly sensitive categories—air and ground transportation, hotels, and recreation admissions—will contribute nearly +0.5pp to the swing in core inflation this year. But if these price levels fully converge to the pre-crisis trend, core inflation would end the year at 2.1-2.2%, other things equal.
In a scenario where consumer demand for travel and recreation overshoots enough to recoup the coronacrisis shortfall over the next three years, we estimate core inflation would average 2.25% in the second half of 2021 with a peak of 2.5% in November, though the impact would then fade in the first half of 2022. (…)
How would the Fed view such a sudden and sharp inflation pickup? Several months of mid-2% core PCE inflation in late 2021—at a time when unemployment is back around 4.5% on our estimates—would increase the odds of tapering asset purchases in late 2021, a bit earlier than we expect. Beyond that, however, Fed officials have already indicated that they would likely downplay the transient effects of a post-pandemic demand surge. In the January press conference, for example, Chair Powell said “Base effects… will pass. There’s also the possibility [of] a burst of spending that could also create some upward pressure on inflation. We would see that as something likely to be transient and not to be very large… The way we would react is, we’re going to be patient.”
We shall see. ING is not as optimistic:
The prospect of a re-opening economy experiencing very strong demand when there will be inevitable supply constraints – thousands of bars, restaurants and entertainment venues have closed, airlines have laid off staff and mothballed aircraft, leisure and hospitality staff need to be hired and trained – mean there is scope for more meaningful price rises. We see inflation moving above 3.5% YoY before moving slowly lower in 2H21. However, there is the risk it proves to be somewhat sticky, which to us means the Federal Reserve will be forced into an earlier first rate hike than the early 2024 date they are currently indicating. (…)
US household balance sheets are in a healthy position with cash, checking and savings deposits having increased by $2tn between 4Q19 and 3Q20 while outstanding credit card balances have fallen to a four-year low. The equity market rally has provided a further boost to household wealth. (…)
The Fed is awake:
-
Fed’s Brainard Says Bond Yield Surge ‘Caught My Eye,’ Is Upbeat on Outlook Federal Reserve governor Lael Brainard said the recent tumult in the bond market is on her radar screen, as she cautioned market participants that the U.S. central bank remains far from a place where it can start dialing back its support of the economy.
(…) The single most important data point for the market is that a Federal Reserve governor has commented publicly on the sharp rise in bond yields. Moreover, it’s Lael Brainard, who was widely canvassed as a potential treasury secretary and is also considered a potential next chairwoman of the Fed. She used language that closely echoed the words of Christine Lagarde, president of the European Central Bank, last week:
“I am paying close attention to market developments — some of those moves last week and the speed of those moves caught my eye. I would be concerned if I saw disorderly conditions or persistent tightening in financial conditions that could slow progress toward our goal.”
Parsing this, we get the message that the Fed cares about what is happening in the bond market, and dislikes the speed with which yields tightened. But arguably the operative word is “if.” She is saying that “disorderly” conditions and “persistent” tightening would be concerning if they happened. So this doesn’t portend immediate action, though it does suggest that the Fed will act in the event of another leg upward. At the margin, this would embolden those who believe that some version of yield curve control or financial repression is inevitable, and that bond yields will stay unnaturally low for a while. This would strengthen the case for stocks, despite their valuations. What it would do to the economy in the longer term is a profoundly different and much more difficult discussion.
- Tuesday’s remarks from Brainard were echoed by San Francisco Fed president Mary Daly who told reporters after a speech that the Fed could change the maturity of its bond purchases if the yield curve steepens in a problematic way. (Axios)
COMPOSITE PMIs
Eurozone: Strong manufacturing growth fails to offset services contraction
The eurozone’s private sector economy experienced a further modest drop in output during February, although a rise in the seasonally adjusted IHS Markit Eurozone PMI® Composite Output Index pointed to a slower rate of contraction. The index posted 48.8 in February, up from January’s 47.8 and also higher than the earlier flash reading.
The latest data again indicated a broadly two-speed economy. On the one hand, manufacturing registered its strongest expansion of output in four months, fuelled by strengthened demand from both domestic and international sources. In stark contrast, the service sector – especially those areas impacted the most by social-contact restrictions – recorded another marked contraction of activity.
Italy joined Germany as the only nations to record modest growth of output during February as strong manufacturing performances more than offset ongoing weakness in services industries.
Overall declines were recorded elsewhere, with Ireland again recording the sharpest contraction, followed by Spain and then France.
Returning to the eurozone overall, the modest fall in activity was again closely linked to a decline in new orders. Latest data showed that new business fell for a fifth successive month, though February’s rate of contraction was marginal. This partly reflected the strongest increase in new export business for nearly three years.
On the employment front, there was some positive news as a net increase (albeit marginal) was recorded for the first time in 12 months. Jobs growth was seen across the region, with the exception of Spain, where another drop in staffing levels was seen. Of the remaining four nations for which data are available, France experienced the strongest rise in staffing levels.
Growth in employment was however limited by ongoing spare capacity, as evidenced by a fall in levels of work outstanding in February. Although marginal, the latest cut in backlogs extended the current period of continuous decline to two years.
Led by rapidly rising in costs in manufacturing – in turn reflective of acute input delivery delays amid an upturn in global demand and transportation challenges – overall private sector operating expenses rose sharply in February. According to the latest data, input cost inflation was recorded for the ninth successive month and to the sharpest degree recorded by the survey since November 2018.
In response to increased costs, output charges edged higher for the first time since last February, although the rate of inflation was marginal.
Finally, hopes of a successful rollout of vaccines and a noticeable dialing back of restrictions related to COVID-19 prevention helped to drive business confidence up to its highest level for three years.
The IHS Markit Eurozone PMI® Services Business Activity Index remained mired below the 50.0 no-change mark to signal a sixth successive monthly reduction in service sector activity. The index was little changed since January’s 45.4, recording 45.7 in February.
Once again, all five nations recorded a drop in activity, led by Ireland and Spain. France and Germany recorded similarly marked falls in activity, with the latter experiencing its worst performance since last May.
Driving the reduction in regional activity was again a fall in levels of incoming new work, which were down for a seventh month in a row. Export sales were also lower, albeit at the slowest rate in the past year.
Due to modest gains in both Germany and France, a net increase in eurozone service sector staffing levels was recorded during February. Though slight, it was the first time that growth has been recorded in 12 months and reflected in part more positive projections for activity in the coming year. Indeed, service sector business expectations improved in February to their highest level since April 2018.
Meanwhile, input cost inflation was unchanged on January’s five-month high in February amid reports of higher prices for a range of goods and services. The challenging business environment however meant that output charges were cut for a twelfth successive month, with all nations covered by the survey recording a reduction in prices since January.


China: Modest increase in business activity during February
Business activity across China’s service sector rose only modestly in February, with the rate of growth dipping to a ten-month low. The slowdown coincided with a softer increase in total new business, which was partly driven by a fresh decline in new export work. Panel members often mentioned that the coronavirus disease 2019 (COVID-19) pandemic, and a recent rise in cases globally, had dampened customer demand. At the same time, firms trimmed their staff numbers for the first time in seven months amid a further steep rise in operating costs. Companies expressed robust optimism towards the year ahead, however, with businesses widely anticipating customer demand to pick up once the pandemic ends.
The headline seasonally adjusted Business Activity Index edged down from 52.0 in January to 51.5 in February, to indicate a mild increase in services activity across China. Moreover, the rate of expansion was the softest recorded in the current ten-month period of rising output.
Service providers indicated that business activity rose in line with new work. Total new orders increased modestly overall, with the rate of growth likewise easing to a ten-month low. While a number of firms commented on firmer client demand, there were reports that the recent resurgence of COVID-19 cases globally had dampened sales growth.Notably, new export orders fell for the first time since last October, albeit modestly.
Service providers took a more cautious approach to workforce numbers in February and reduced their headcounts. Though only mild, it was the first time that employment had fallen since last July. Companies that noted lower staffing levels often linked this to cost-cutting initiatives and the non-replacement of voluntary leavers.
Although employment fell, there seemed little pressure on operating capacities in February. This was signalled by a further reduction in outstanding business, though the rate of depletion remained marginal. Anecdotal evidence suggested that greater efficiency and subdued sales had enabled firms to work through backlogs.
Chinese services companies registered a further steep increase in operating costs during February. Although not as sharp as that seen at the start of the year, the upturn was among the quickest seen over the past decade. Greater purchasing and staffing costs were cited as key drivers of inflation. However, efforts to remain competitive meant that firms only partially passed on higher input costs to clients, as prices charged rose modestly.
Looking ahead, service providers in China were strongly optimistic that business activity will rise over the next year. Moreover, the degree of positive sentiment strengthened since January and was among the highest seen over the past eight years. Hopes that the COVID-19pandemic will come to an end were central to upbeat forecasts, while there were also mentions of planned company expansions and new product releases.
At 51.7 in February, the Composite Output Index fell from 52.2 in January to signal a moderate increase in total business activity across China. That said, the rate of expansion was the slowest recorded in the current ten-month sequence of growth. Softer increases in output were recorded across both the manufacturing and service sectors.
Composite new orders also rose at a slower pace, with growth easing to a ten-month low. Sales rose only slightly at manufacturers, while services companies noted a mild upturn. Employment at the aggregate level, meanwhile, fell for the first time since last July,albeit modestly, driven by reductions at both manufacturing and services companies.
Composite input costs continued to increase sharply, despite the rate of inflation easing to a three-month low. Prices charged also rose at a slightly softer pace.


Note that
The Goldman Sachs Analyst Index (GSAI) rose 9.4pt to an all-time high of 76.0 in February. The composition of the survey was strong, as the orders, shipments, and employment components all increased.
Other major business activity surveys were strong on net in February.
A majority of our sector analysts report that business activity in their industry is at or above normal levels. Most also indicated that last week’s winter storm in the South and Midwest did not significantly affect their industry.
We construct the headline GSAI using the following weights: 30% for new orders, 25% for sales/shipments, 20% for employment, 15% for materials prices, and 10% for inventories.
Toronto, Vancouver home sales soar in February as condo market rebounds, low rates drive up prices
(…) In the Toronto region, home resales hit a record for February, 52.5 per cent higher year over year, with condos leading the way up, according to the Toronto Regional Real Estate Board. Condo resales in the city were 27 per cent higher than in January. (…)
The average selling price for condos in the city was still 6 per cent lower than in February of last year, but 8 per cent higher than in January.
Over all, the home price index, which is adjusted for expensive transactions, rose 15 per cent year over year to $969,600 across the Toronto region, with the biggest price increases outside the city. In Simcoe County, north of the city, the index was up 35 per cent, and to the east in Durham region, the index was up 29 per cent.
The total number of properties for sale in the Toronto region was flat compared with the previous year. Although condo listings in the city were 50 per cent above February, 2020, the number was not as high as in the fall, when more condo owners were putting their units up for sale. Condo listings have decreased since the peak in October.
In Vancouver, home sales were 73 per cent higher than in February of last year, and 56 per cent above January, with increases for detached houses as well as condos.
The total number of properties for sale was 20 per cent below the 10-year average.
The home price index reached $1,084,000 last month, 7 per cent above February of last year and 3 per cent higher over January. (…)
OPEC+ considering rolling over oil supply cuts into April, sources say
EARNINGS WATCH
One closely watched revision comes from Goldman Sachs, which now forecasts S&P 500 EPS will grow by 21% this year (up from a 13% decline a year ago) to $181. That would be a solid 10% higher than the 2019 pre-pandemic level of $165. Earnings growth will be in the 9% range next year, before settling to a more normalized 6% gain in in 2023 and 5% gain in 2024. Here’s the chart they provide:

SENTIMENT WATCH
Comment volume for Rocket, a highly shorted home loan provider, surged to nearly 19% on WallStreetBets today, according to SwaggyStocks. And the company was the fifth-most-mentioned company on Stocktwits. Shares surged 71%, giving it a market cap of about $82.6 billion. (Bloomberg)
Dumb money has never been so smart
The “dumb money” has been pretty smart lately. To a record degree, actually.
Dumb Money Confidence is a model that incorporates more than a dozen indicators that have a track record of cycling to extremes, and equating with ebbs and flows in sentiment among broad categories of investors. (…)
For the most part, these indicators reflect retail, mom-and-pop types of traders, but certainly not exclusively. Sophisticated institutional investors have just as much propensity to suffer from group-think as everyone else, so determining “smart” and “dumb” is not necessarily straightforward.
The term “dumb” itself needs to be clarified. A more accurate description would simply be “trend-following.” Most trend-followers are not dumb – they’re positioned correctly during the meats of most major trends. That sounds pretty smart.
Where this term gets its meaning is that because trend-followers use different methodologies, some waiting until trends are well-established, by the time most trend-followers hop on a trend, and most aggressively, is about the time the trend is becoming exhausted. So these traders tend to be the most net long near peaks and least net long (or most net short) near bottoms. Because most investors follow trends to some degree, these indicators tend to capture the behavior of most of the money flowing into and out of markets.
At the same time that these traders are showing aggressively optimistic behavior, Smart Money Confidence in a rally has plunged. It has been a struggle for stocks to sustain large gains when we see a Smart Money / Dumb Money spread like this.


Jack Ma’s Ant forced into arms of banks he once dubbed ‘pawnshops’ Fintech will have to rely on state-owned behemoths under online lending reforms
![]() Microsoft hack. The company urged customers to download software patches after Chinese hackers broke into some customers’ copies of its software for email, contacts and calendar. The attackers used previously undiscovered flaws as a way in.
Microsoft hack. The company urged customers to download software patches after Chinese hackers broke into some customers’ copies of its software for email, contacts and calendar. The attackers used previously undiscovered flaws as a way in.


