Payroll employment rises by 559,000 in May; unemployment rate declines to 5.8%
Total nonfarm payroll employment increased by 559,000 in May, following increases of 278,000 in April and 785,000 in March. In May, nonfarm payroll employment is down by 7.6 million, or 5.0 percent, from its pre-pandemic level in February 2020. (…)
The change in total nonfarm payroll employment for March was revised up by 15,000, from +770,000 to +785,000, and the change for April was revised up by 12,000, from +266,000 to +278,000. With these revisions, employment in March and April combined is 27,000 higher than previously reported.
In May, the average workweek for all employees on private nonfarm payrolls was 34.9 hours for the third month in a row. In manufacturing, the average workweek rose by 0.1 hour to 40.5 hours, and overtime increased by 0.1 hour to 3.3 hours. (…)
In May, 7.9 million persons reported that they had been unable to work because their employer closed or lost business due to the pandemic—that is, they did not work at all or worked fewer hours at some point in the last 4 weeks due to the pandemic. This measure is down from 9.4 million in the previous month. Among those who reported in May that they were unable to work because of pandemic-related closures or lost business, 9.3 percent received at least some pay from their employer for the hours not worked, unchanged from the previous month.
Among those not in the labor force in May, 2.5 million persons were prevented from looking for work due to the pandemic. This measure is down from 2.8 million the month before.
U.S. Services PMI: Business activity growth rate accelerates to record high in May
May PMI™ data indicated the fastest rise in business activity since data collection for the series began in October 2009. The unprecedented expansion in output was supported by a marked increase in new business, in turn buoyed by the quickest rise in new export orders for nine months. Greater business requirements resulted in a further sharp rise in employment. That said, the pace of job creation softened as firms reported difficulties filling vacancies. Strain on capacity was also reflected in another monthly rise in backlogs of work.
At the same time, the rate of input cost inflation accelerated to a series high amid ongoing supplier price hikes. In an effort to pass on greater costs, service providers raised their charges at an unprecedented pace.
The seasonally adjusted final IHS Markit US Services PMI Business Activity Index registered 70.4 in May, up from 64.7 in April and greater than the earlier released ‘flash’ estimate of 70.1. The upturn in output was the fastest on record, with the rate of expansion accelerating for the fifth month running. The increase in business activity was often linked to stronger client demand and a sustained rise in new orders. Firms also noted that the continued reopening of the economy following COVID-19 restrictions allowed for a greater range of services to be made available for customers.
Driving the expansion in output was a quicker rise in new business across the service sector during May. The rate of growth was the fastest since data collection began in late-2009. The unprecedented increase in new orders was attributed to stronger business and consumer confidence, stemming from a successful vaccination programme and the reopening of the economy. Greater foreign demand was reflected in the quickest rise in new export orders for nine months.
May data indicated a quicker rise in input costs across the service sector, as supplier price hikes intensified cost pressures. The rate of inflation accelerated for the seventh month running and was the sharpest on record.
Consequently, service providers stepped up their efforts to pass on higher costs to clients, with the pace of charge inflation quickening to the steepest in the survey’s history. Companies mentioned that greater costs were being progressively passed through to customers amid burgeoning demand.
Meanwhile, greater business requirements owing to rapid sales growth led to a further rise in staffing numbers during May. The rate of job creation remained sharp and outpaced the long-run series average. That said, the pace of increase eased slightly since April amid reported challenges enticing workers back to employment and finding suitable candidates for available vacancies.
Although the rate of backlog accumulation slowed in May, the rise in outstanding business was solid overall and among the steepest on record amid pressure on capacity.
Output expectations among service providers regarding the outlook for activity over the coming year improved in May. The degree of confidence was marked overall, with optimism stemming from looser COVID-19 restrictions and stronger client demand.
The IHS Markit U.S. Composite PMI Output Index posted 68.7 in May, up from 63.5 in April, to signal the steepest upturn in business activity since data collection began in October 2009. Faster output growth was registered across both the manufacturing and service sectors.
The overall upturn was supported by a sharper expansion in new business. Rates of growth were the fastest on record in both the manufacturing and service sectors. Overall sales were also aided by a survey record rise in foreign client demand.
Once again, inflationary pressures intensified in May. The rate of cost inflation was unprecedented amid substantial supplier shortages and delays. As a result, firms sought to pass on greater costs to their clients, with the pace of charge inflation quickening to a new series high.
Constraints on capacity led to a solid accumulation of backlogs of work, with manufacturers noting the fastest rise on record. Alongside component shortages, firms stated that challenges remained finding suitable candidates. Subsequently, the rate of job creation softened from that seen in April.
Finally, the overall degree of confidence improved in May, as service providers noted stronger expectations regarding the outlook for output over the coming year. Manufacturers were less upbeat compared to April however amid concerns about supply-chain disruptions.


")


")
Jobless Claims Fall to Pandemic Low Initial claims fell 20,000 to 385,000 last week
Weekly unemployment claims, a proxy for layoffs, fell to 385,000 last week from a revised 405,000 the prior week, the Labor Department said Thursday. Last week’s decline in claims marked the fifth straight week that new filings fell, from 590,000 the week ended April 24. (…)
Thursday’s reading brings the four-week average of initial claims—which smooths out volatility in the weekly figure—to 428,000, the lowest point since the pandemic began, though still well above pre-pandemic levels. Weekly claims averaged around 220,000 in the year before the pandemic. (…)
In mid-May, some 15.4 million Americans received unemployment benefits through regular state aid and federal emergency programs put in place in response to the pandemic. The figure, which isn’t adjusted for seasonality, was down more than 4 million from the first week of March, though it was still nearly seven times the number of people collecting benefits before the pandemic’s onset. (…)
As of late May, job postings on Indeed, a job-search site, were 26% above where they were ahead of the pandemic in February 2020, after adjusting for seasonal variation. (…)
A Census Bureau survey conducted between May 12 and May 24 found that 7.3 million people hadn’t worked in the past seven days because they were caring for children not in school or daycare, while 3.8 million were sidelined due to worries about getting or spreading the virus on the job. (…)

(Bespoke, my black line)
Restaurants, Supermarkets Can’t Find Enough Workers to Open New Locations The tight labor market is hampering new restaurant and supermarket openings, putting a potential check on growth in a food industry that is being reshaped by the pandemic.
(…) They are adding perks and bonuses to entice job seekers and in some cases delaying openings. (…) Some supermarkets are adding referral and signing bonuses. (…)
For now, food executives say higher costs for pay and benefits, as well as the hassle of deploying existing staff to new stores, are weighing on operations, potentially preventing them from grabbing more sales. (…)
He said many franchisees recently raised hourly wages by 10% for several positions. Mr. Howard estimated higher spending on overtime and average hourly wages will dent margins by as much as $100,000 annually per Fazoli’s restaurant. Fazoli’s raised prices by nearly 3% in the past month to account for higher costs, he said. (…)
U.S. Productivity Remains Strong in Q1
The first revision of nonfarm business sector productivity kept the Q1 rise unchanged at 5.4% (SAAR, 4.1% y/y), following a decline of 3.8% (SAAR, +2.6% y/y) in Q4’20. Recall, productivity growth had reached 11.2% in Q2 last year, leaving the increase in productivity for the full year at 2.5%, the largest annual increase since 2010.
Q1’21 real output was revised up to a rise of 8.6% (1.1% y/y) from 8.4% (1.1% y/y) in the preliminary report and following an unrevised 5.8% (-2.6% y/y) rise in Q4. Hours worked rose 3% (-2.9% y/y), slightly up from the earlier reported 2.9% rise in Q1 and following the 10% jump in Q4.
Unit labor costs were revised sharply up to a rise of 1.7% (4.1% y/y) in Q1 from an earlier reported decline of 0.3% (1.6% y/y). Q4 was also revised considerably, to a surge of 14.0% (6.1% y/y) versus the prior reported rise of 5.6% (4.1%) rise in Q4. Compensation per hour rose 7.2% (8.3% y/y) in Q1, up sharply from the earlier reported rise of 5.1% (5.8% y/y) and following an upwardly revised 9.7% (8.8% y/y) rise in Q4 from 1.6% (6.7% y/y). (…)
Unit labor costs in Q1’21 were 4-5% above their Q1’20 level. Booming business sales (+10.4%) saved margins but how transitory is that?

The business sector real compensation per hour was 6.3% above its pre-pandemic level in Q1’21 (+5.0% in manufacturing), following 15 years of calmness.

Bloomberg Professional Services notes that
(…) operating margin expectations have begun to fall for some companies, hampering performance for those that have faced a drop. Over the past month, margin targets were reduced on 144 of S&P 500 members, and their stocks gained only 3 bps vs. 58 bps for the index and a 229-bp gain for companies with rising margin forecasts. Slicing the index into quintiles based on changes in operating margin shows that companies with the largest drops had stock-price gains of just 63 bps vs. 436 bps for those with the greatest forecast expansion.
Health care and tech have been hit hardest by rising inflation in the period, comprising 20.2% and 18.1% of the quintile of stocks with the largest margin drop. (…)
On the whole, S&P 500 margin forecasts tend to expand faster in inflationary environments. On average, margins expand by 0.21% month-over-month in months where CPI is above 2 and only 0.06% when it’s less than 2. Most industry margins benefit in high-inflation periods as well, with the exception of some staples/discretionary sectors (food and staples retail, food beverage and tobacco, household and personal products, and retail) along with materials, pharmaceuticals, telecom and utilities.
The relationship between CPI and PPI, however, also plays an important role. While inflationary CPI environments are usually positive, more expensive input costs offset the beneficial effects of increased output prices.
Inflation might be getting a little too hot to handle for the S&P 500. Core PPI and S&P 500 operating-margin expectations tend to move together, but when inflation gets too high, it’s difficult for companies to pass it through to consumers, resulting in some margin pressure. Unfortunately, we appear to be at one of those key moments in time. Each time core PPI surpasses 2% on a year-over-year basis, operating-margin forecasts struggle in the short term. Core PPI stands at 2%.
Likewise, S&P 500 margins tend to rise as consumer prices outpace PPI, but producer prices are currently running much faster, suggesting operating-margin pressure is likely to emerge. (…)
INFLATION WATCH
Our national index increased by 2.3 percent from April to May, representing the third straight month of record-setting rent growth, going back to the start of our rent estimates in 2017. After this recent spike, year-over-year rent growth now stands at 5.4 percent nationally, and prices are now in line with where we expect they would have been if the pandemic-related rent declines of 2020 never occurred.

One of these 2 trends will prove transitory, or maybe both will:

Here’s what Nordea wrote in mid-February:
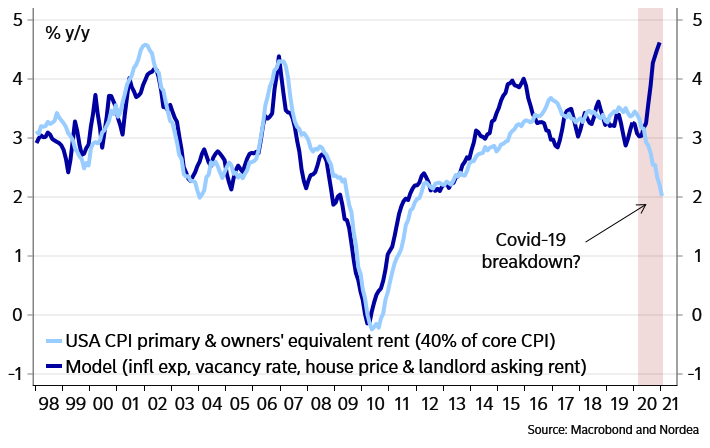
Shelter has a 42% weight in core CPI and is thereby extremely important. Currently it is running at 1.6% y/y [+2.1% in April], which is historically quite low (…). COVID-19 has clearly affected the numbers, both due to how rents are measured but also in terms of the political viability in raising rents during a deep humanitarian disaster.
What is clear, however, is that the underlying pressure to hike rents when COVID-19 cools down is massive, which probably also is true for other service prices. Apartment vacancy rates are the lowest since 1986, house prices are soaring, inflation expectations are increasing and landlords are signalling the largest increase in the asking price for rent ever. There could be a huge, latent jump in shelter in the second half of 2021.
Underlying upside US rent pressures are massive
Everybody and the Fed were totally surprised by the April inflation numbers. May’s CPI comes June 10. David Rosenberg, a noflationist, recently said that “he won’t be married to the “transitory” narrative if May’s and June’s monthly rises are as meteoric as that of April. If that happens, he sees the Fed being forced to shift its dovish rhetoric or risk losing what little credibility they’ve still got.”
Fittingly, the next FOMC meeting is June 16.
Yesterday, NY Fed president John Williams said that the economy is “on a good trajectory, but in my mind, we’re still quite a ways off from reaching the ‘substantial further progress’ that we’re looking for, in terms of adjustments to our purchases.”
Some FOMC member seem to be of a different and quickly evolving mind.
- On May 10, San Fran Fed president Mary Daly said “it’s not yet time to start thinking about talking about relaxing the accommodation we’ve given.”
- Tuesday, Philly Fed president Patrick Harker said that “it may be time to at least think about thinking about tapering.”
- But Harker may have missed the last meeting because Miss Daly told CNBC last week that, well past thinking, “we are talking about talking about tapering.”
Coincidentally, or not, the Fed surprised everybody yesterday announcing that it will start selling its SMCCF corporate bonds and ETFs next Monday.
Watch your spreads!

The Fed has announced that it will not just taper off its corporate holdings, but actively sell holdings under its Secondary Market Corporate Credit Facility (SMCCF). This did come as a surprise, however in the grand scheme of things, the amount is relatively small at just US$13.8bn. Of this, just US$5.2bn is in corporate bonds and US$8.6bn is in ETFs. This includes both investment grade and high yield ETFs. For comparison, the European Central Bank’s holdings of corporate bonds extend to a substantial €275bn. Therefore, the selling of US$13.8bn by the Fed should not have any detrimental effect on spreads or funding levels.
Furthermore, this is fully outweighed by mutual fund (& ETF) inflows. Over the past 12 months, USD investment grade inflows have amounted to a substantial US$44bn. On a year-to-date basis, USD investment grade inflows have accumulated to US$5.2bn. Bear in mind, fund flows so far this year have been positive but relatively low. This comes after the substantial inflows seen in 2020 and 2019. Looking at this year alone, the technical picture, in this sense, is now flat.
All of that said, the Fed’s move does add weight to our slight bearish outlook. It is a signal that while it’s not all out tapering, it is the start of a different phase. (ING)
(…) Drought in South America has withered crops from corn and soybeans to coffee and sugar. Record purchases by China are worsening the supply crunch in grains and boosting costs for global livestock producers. Cooking oils have soared too on demand for biofuel. (…)
The UN index has reached its highest since September 2011, climbing almost 5% last month. All five components of the index rose during the month, with gains led by vegetable oils, grains and sugar. The Bloomberg Agriculture Spot Index, measuring prices from grains to sugar and coffee, is up 70% in the past year. (…)
Summer weather across the Northern Hemisphere will be crucial in determining if U.S. and European harvests can make up for crop shortfalls elsewhere. (…)

- The worst drought in decades is escalating threats across the western U.S. and farmers, cities and power suppliers are scrambling for water. Unlike in the East, the West gets most of its water in winter months from rain or snow. Last year, drought cost the nation $4.5 billion. This year, what little snow that fell soon disappeared.
Almost three-quarters of the West is gripped by drought so severe it’s off the charts of anything recorded in the 20-year history of the U.S. Drought Monitor. The region saw little precipitation, robbing reservoirs of dearly needed snowmelt and rain. Through the end of April, 1.7 million acre-feet of water melted off California’s mountains, down from the normal rate of 8 million.
The parched conditions mean the wildfire threat is high and farmers are struggling to irrigate crops. With not a lot to go around this year, regional water issues are likely to mount, with little hope for relief.

- This John Authers’ piece in Bloomberg also fits in my “inflation watch” segment:
Compared to the average since 1950, the only asset class in which households are overweight at present is equities. Their allocation to bonds is plumb in line with average for the last seven decades, probably a legacy of the big capital gains on which many will be sitting. Meanwhile, households are very low on both cash (which is good to see) and real estate (which is surprising). For most of the postwar period, Americans have had far more wealth tied up in their house than in their stock portfolios. Now they are overweight equities and underweight their house to almost the same emphatic degree as they were at the top of the stock market in 2000. (…)
This doesn’t give any reason for anybody to bail out of equities immediately, but it should be another sign that the stock market should be viewed as being somewhere near a secular high. Expecting the next decade’s returns to be anything like those of the last 10 years certainly seems unrealistic. Davis’s own sage judgment is as follows:
In dollar amounts, the assets total a whopping $110.2 trillion, with stocks at $42.7, real estate at $35.8, cash at $16.8, and bonds at $14.9 — all trillions. Cash sounds high but it is about equal to the amount of household liabilities, so there is not much “free liquidity.” I certainly don’t see this as a short-term timing tool, but I do think it may offer a useful longer-term risk perspective if one believes that excesses tend to revert to the mean in the long run.

Bitcoin Slides After Musk Tweets Broken-Heart Emoji for Token
Biden Adds More Chinese Companies Banned From U.S. Investment The move shows the Biden White House’s willingness to continue some of the hard-line China policies started by former President Trump.
An executive order Mr. Biden signed Thursday brings to 59 [from 48] the total number of Chinese companies banned from receiving American investment and shows how his administration is continuing some of the hard-line China policies left by former President Donald Trump.
Many of the newly targeted companies are subsidiaries and affiliates of major state-owned companies and other businesses named on the earlier blacklist. They include a clutch of companies tied to the state-owned aerospace giant Aviation Industry Corporation of China and two financing affiliates of telecommunications gear-maker Huawei Technologies Co. (…)


