U.S. Household Income Surged by Record 21.1% in March Higher income, spending and saving are expected to help power a fast economic recovery in the U.S.
The 21.1% March surge in income was the largest monthly increase for government records tracing back to 1959, largely reflecting $1,400 stimulus checks included in President Biden’s fiscal relief package signed into law in March. The stimulus payments accounted for $3.948 trillion of the overall seasonally adjusted $4.213 trillion rise in March personal income.
Spending was also up sharply, increasing 4.2%, the Commerce Department said on Friday. That was the steepest month-over-month increase since last summer. (…)
The personal-saving rate surged to 27.6% in March, the second highest rate on record, eclipsed only by last April when a first round of government aid was distributed early in the pandemic.
Stimulus payments included in the latest package propelled spending the most of all three rounds of pandemic stimulus checks, according to data-analytics company Earnest Research.
People who received stimulus money drove up total spending growth by 29 percentage points in mid-March compared with the same period in 2019, Earnest transaction figures show. That outpaced bumps of 23 and 22 points after the first and second stimulus checks, respectively. (…)
Spending among stimulus recipients grew twice as fast in Pennsylvania, Texas and Florida compared with California and New York, according to Earnest, reflecting stronger stimulus effects in states that reopened faster.
“Local economies matter,” Mr. Amsel said. “If in Texas and Florida, restrictions were never as strict as New York and California, you saw that play out since April of last year.” (…)
Consumers increased spending on services by 2.2% in March from a month earlier. (…)
Personal saving amounted to about $6 trillion in March, up by nearly $5 trillion from February 2020, the month before the pandemic shut down large parts of the economy. (…)
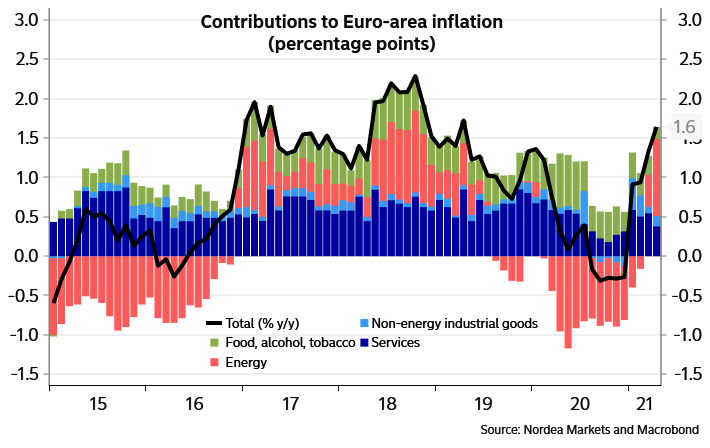
The personal-consumption expenditures index excluding food and energy, the Federal Reserve’s preferred inflation gauge, rose 1.8% in March from a year earlier. In February, this price index increased 1.4% from a year earlier. (…) (WSJ)
Change in annualised income levels versus February 2020
")
Source: Macrobond, ING
YoY changes have become meaningless for a while. This chart’s series are indexed to 100 on Feb 2020, just before the first shock. Weekly payrolls (employment x hours x wages) are back to 100.7 in spite of 8 million fewer people working. Total expenditures, which generally sync with labor income, are at 103.5 in spite of severely curtailed spending on services. Retail sales are at 116.9 and spending on durable goods at 129.5.

Still very much in the pandemic in March, Americans displayed both a willingness to spend more than their labor income and caution in barely using their stimmies overall.
As data from Pennsylvania, Texas and Florida showed, economic reopening truly stimulated spending, “twice as fast” per Earnest, meaning a significant dis-saving upon near-normality. Have money, will spend.
Chase credit card tracker data through April 26 suggest that most states have caught up last month with only 5 states significantly lagging the U.S. average trend. Note that both discretionary and nondiscretionary spending are up 20% over 27 months, a 9% annualized rate. The PCE deflator for goods was up only 2.0% during that period, less than 1.0% annualized.

“Pent-up” keeps strengthening over “Spent-up”.
U.S. Employment Cost Growth Ticks Up in Q1
The employment cost index (ECI) for civilian workers rose 0.9% in the first quarter of 2021, following a 0.7% rise in the fourth quarter of last year. The quarterly rise was also faster than the 0.7% consensus from Action Economics Forecast Survey. Year-on-year, total compensation rose 2.6%, slightly better than the 2.5% advance in the fourth quarter and matching the full-year 2020 advance.
Wage and salaries increased 1% in Q1 (2.7% y/y), up from 0.8% in Q4 2020 (2.6% y/y), while benefits grew 0.6%, matching the advances posting in Q3 and Q4 of 2020. The 2.5% year-on-year rise in Q1 was an acceleration from the 2.3% rise in the prior two quarters.
Private sector compensation rose 1% over the quarter (2.8% y/y), wages and salaries rose 1.1% (3% y/y), while private sector benefit rose 0.6% (2.5% y/y).
Compensation in goods- and service-producing industries grew 0.7% and 0.9%, respectively in Q1 (2.4% and 2.7% y/y), a slight pickup from the year-on-year growth experienced in Q4. Overall compensation for non-incentive paid occupations increased 0.8% (not seasonally adjusted) and 2.5% y/y. The y/y rise was the same as in Q4.


The ECI is one of the better measures of labor market slack as it adjusts for composition and job quality changes. Last quarter’s increase was driven by a 1.0% rise in wages, the biggest gain in 14 years. It followed gains of 0.8% and 0.5% in the two previous quarters. Annualizing the last 2 quarters, wages are rising at a 3.6% rate (+3.8% in the private sector).
ABOUT THAT SLACK
Affluent Americans Rush to Retire in New ‘Life-Is-Short’ Mindset The unprecedented surge in shares and home values during an economic crisis is easing the retirement path for those who have savings and investments.
About 2.7 million Americans age 55 or older are contemplating retirement years earlier than they’d imagined because of the pandemic, government data show. They’re more likely to be White, a group that typically has a larger amount of accumulated wealth, and many cite robust retirement accounts and Covid-19 fatigue for their early exit, according to interviews with wealth managers and federal surveys. (…)
A November study from Pew Research Center found a surge in the number of baby boomers, those born between 1946 and 1964, who reported being retired compared to previous years — 1.2 million more than the historical annual average.
Other datapoints back up the findings. The number of people expecting to work beyond age 67 fell to a record low of 32.9% last month, according to a New York Federal Reserve survey. And about 2.7 million workers age 55 and older plan to apply early for Social Security benefits — almost twice as many as the 1.4 million people in the same age group who anticipate working longer, according to a recent U.S. Census Bureau survey.
The unprecedented surge in shares and home values during an economic crisis is easing the retirement path for those who have investments. Assets for Americans ages 55 to 69 rose by $4.2 trillion in 2020, including a $2.2 trillion increase in corporate equities and mutual fund shares and a $250 billion gain in the value of private businesses, according to data from the Federal Reserve. Real estate assets soared by almost $750 billion for this group. (…)
The number of business owners who say they plan to retire sooner than expected has doubled since since last August, according to a survey by financial services firm Wilmington Trust. (….)
The loss of older workers will hurt the labor market. Those workers have strong productivity, lower absenteeism and they can train and mentor newcomers, said Susan Weinstock, vice president of financial resilience programming at seniors advocacy group AARP in Washington, D.C.
From the beginning of the pandemic, the participation rate of Americans 55+ has dropped 1.8 percentage points (5.2%) compared with -1.6pp (1.9%) for the 25-54 group. But older Americans were still leaving the labor force in March.

Not only does this mean fewer available older workers than before the pandemic, these workers’ wages typically grow much more slowly than the average. Their rising share of the working space has thus helped keep average wages lower than otherwise. The 55+ cohort accounted for 13% of all employees in 2000, 20% in 2010 and 24% currently.
![]()
It might eventually dawn on central bankers that their ZIRP forever policy is having multiple unexpected cross-effects on the economy, many being magnified by the pandemic: booming equity markets and exploding housing values are creating a huge wealth effect boosting demand when goods supply is restrained. As seen, older and wealthier workers are now opting out of the labor force, impacting the labor demand/supply balance and, likely, average economy wages. This when minimum wages are being jacked up across the U.S., not only by government fiat but also by corporations mindful of the underpaid state of these now recognized essential workers.
A year ago, Jay Powell was literally begging for fiscal support to supplement the FOMC’s extraordinary monetary stimulation. The Biden administration seems to be obliging and then some, and then some more, as Bruce Mehlman of Mehlman Castagnetti Rosen & Thomas aptly illustrates:

John Maynard Keynes to FDR in an open NYT letter in December 1933:
You are engaged on a double task, Recovery and Reform;–recovery from the slump and the passage of those business and social reforms which are long overdue. For the first, speed and quick results are essential. The second may be urgent too; but haste will be injurious, and wisdom of long-range purpose is more necessary than immediate achievement. It will be through raising high the prestige of your administration by success in short-range Recovery, that you will have the driving force to accomplish long-range Reform. On the other hand, even wise and necessary Reform may, in some respects, impede and complicate Recovery.
If Mehlman’s numbers below are right, and assuming Congress agrees, the ARP, AJP and AFP could total as much as 27% of GDP, more than twice FDR’s New Deal, not taking account that the two 2020 plans already added to 14.5% of GDP.

Powell keeps telling us that the Fed will not use binoculars and simply wait for the actual facts to confirm that the FOMC’s goals on employment and inflation have been met before tightening the monetary spigot.
He said that well before the Biden plans were released and he keeps saying the same now that he has a pretty good idea of what’s coming. Jay Powell is obviously not a Keynesian lawyer! He believes that when unemployment will be 3.5% and inflation sustainably above 2% the economy, then fully revved up by both the monetary and the fiscal engines, will naturally and gradually slow just enough to keep us at this Nirvana level of full employment and 2% inflation.
The U.S. real GDP sank 26.6% between 1929 and 1933. With the New Deal, 12.6% of GDP, it had fully recovered by the end of 1936.
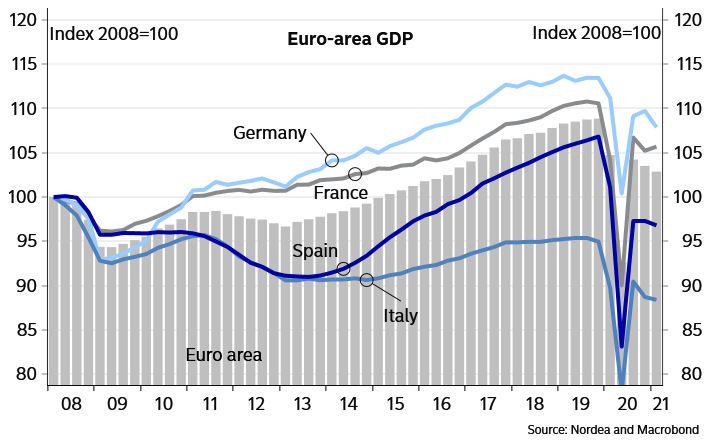
The U.S. economy declined 9.0% in Q2’20 grew but was only down 0.4% at the end of Q1’21, and it now appears that, remarkably, the level of output at the end of 2021 will be higher than what would have been the case if the pandemic had never happened.
And Biden’s “Recovery and Reform” plans will start to kick in!
Probably before the world supply chains will have been mended. Hence, as Bloomberg points out:
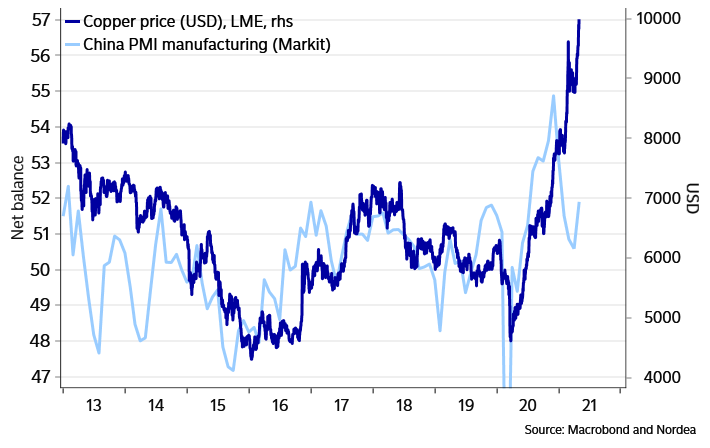
For an idea of exactly how strong the fundamentals are for commodities such as metals, agriculture and oil today, consider this: These markets are now showing the steepest backwardation in more than 14 years.
That is, the premium for commodities that can be delivered now versus later into the future is the highest it has been since at least 2007, signaling just how strong the world’s demand is for raw materials and how tight supplies are.
In commodities markets, futures are frequently pricier at longer maturities because they reflect the cost of carrying inventories over time as well as future demand expectations. But urgent demand has flipped about half of major commodity markets tracked by the Bloomberg Commodity Index including oil, natural gas, copper, soybeans into backwardation.

- U.S. Companies Scramble to Meet Surge in Demand Supply-chain snarls and labor shortages are crimping some businesses looking to ride a rebound in the U.S. economy.
(…) “I get it that the Fed doesn’t want to recognize inflation, but there is inflation,” Dover Corp. CEO Richard Tobin told investors on April 20. Raw-material prices increase the cost of components the industrial manufacturer buys, he said, and finding workers could raise the price of keeping factories running. “Clearly, at the assembly level, labor availability is becoming a problem, and that is beginning to start to move up labor costs over time,” he said.
Dover, which makes refrigerators for supermarkets and pumps for gas stations, isn’t the only company facing a tight market for American workers. Darden Restaurants Inc., which operates Olive Garden, LongHorn Steakhouse and other chains, is raising wages to attract restaurant workers. Amazon.com Inc. said last week it will dole out raises to more than 500,000 workers this spring instead of next fall as competition for workers picks up. (…)
(…) “There’s more freight than trucks, or maybe I should say, than drivers,” David Menzel, chief operating officer at freight broker Echo Global Logistics Inc., said in an earnings call Wednesday. “The ports are backlogged, demand is strong, so rates are high. On the other hand, shippers are dealing with high rates, tight capacity and disrupted supply chains.” (…)
Trucking fleets have been stepping up equipment orders and raising driver pay as they compete for labor with industries such as construction. (…)
Operators say the shortfall could deepen if cargo volumes remain high without a pause before the busy holiday shipping peak. (…)
The most recent Cass Information Systems Inc. seasonally adjusted index for U.S. freight demand rose 3.4% from February to March while the separate measure for freight expenditures rose nearly twice as fast, at 6.5%, signaling rapid growth in shipping costs.
Mr. Biesterfeld said constraints include the global semiconductor shortage, which is limiting new truck production. He cited data from transportation data provider ACT Research predicting that net Class-8 trucking capacity would grow by 3% to 3.5% this year, while C.H. Robinson expects truckload volumes to increase by 8% to 12%. (…)
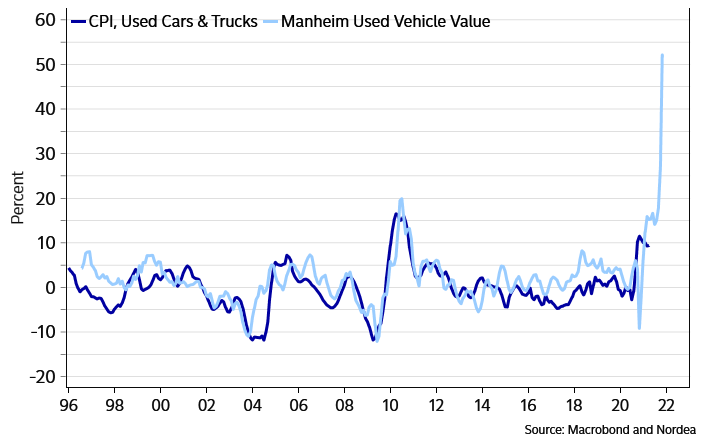
(…) “We’re seeing very substantial inflation,” the 90-year-old billionaire who apparently does not have a Fed charge card, said in his nearly 6 hour long address to investors. But it’s what he said that was especially ominous: “It’s very interesting. We’re raising prices. People are raising prices to us and it’s being accepted.”
Why does this matter? Because the ability to pass on price increases and have them stick, means the surge in prices will not be transitory, no matter how many times the Biden admin, the Fed or the Treasury lie and vow the opposite. (…)
“It just won’t stop,” Buffett added. “People have money in their pocket and they’ll pay the higher prices…. There’s more inflation going on that people would have anticipated six months ago or thereabouts” he added.
(…) it’s almost a buying frenzy, except certain areas, you can’t buy at. (…)
Nobody really knows how this will pan out but it sure seems we’re all aboard a rather extraordinarily powerful train that the whole world will be watching. Keynes to FDR again:
You have made yourself the Trustee for those in every country who seek to mend the evils of our condition by reasoned experiment within the framework of the existing social system. If you fail, rational change will be gravely prejudiced throughout the world, leaving orthodoxy and revolution to fight it out. But if you succeed, new and bolder methods will be tried everywhere, and we may date the first chapter of a new economic era from your accession to office.
Bruce Mehlman sees more pragmatic motives in Biden’s administration actions:
Most sitting Presidents see their Party lose seats in the House in their first midterms. Three of the last 4 Presidents lost the House entirely (Clinton, Obama, Trump), and 2021 redistricting will make Dem losses even more likely. With the smallest majority margin for a newly-elected Democratic President ever in the House, Team Biden understands they have just two years (714 days) to enact any desired legislation before the GOP most-likely captures control. While the Senate margin (zero) is even smaller than the House Dem margin (9), the nature of the states that are up in 2022 give Democrats a greater chance to maintain control (barely).
Biden’s Rescue, Jobs & Families proposals ($6.1T in total) entail a massive and often permanent expansion of the social safety-net, using trillions in tax increases to ostensibly address income inequality. The Administration is prioritizing racial equity outcomes in health, education, housing and employment, rather than more traditional inputs (e.g. affirmative action), advancing immigration reform, and pushing the most aggressive agenda for social change in decades.
Biden and Powell are totally synchronized.
Coincidentally, just north of the U.S. border, monetary and fiscal policies are not dissimilar:
Canadian Output on Cusp of Full Recovery After 11th Monthly Gain Output in March was about 1.3% below monthly levels recorded in February 2020. On a quarterly basis, GDP is also within 1.5% of what it was pre-pandemic.

Summers Sees Signs of Scarce Workers as Harbinger of Inflation
(…) “I am concerned that progressives have a tendency to overreach,” Summers said in an interview with David Westin on Bloomberg Television’s “Wall Street Week.” “You need to be progressive but you also need to get the arithmetic right, and I am worried that this program could overheat the economy.”
Summers, who’s a paid contributor to Bloomberg, said there was rising evidence of labor shortages and that “workers are quitting at rates they usually quit at during booms,” which made him concerned about inflation. (…)
“He [Powell] might be right. But the Fed chairmen who did the most talking about transitory factors were the Fed chairmen we had in the mid-70’s and that’s when inflation was accelerating very rapidly,” Summers said.

EARNINGS WATCH
Corporate Earnings Have Rarely Looked This Good With the earnings season more than halfway over, most companies in the S&P 500 have surpassed analysts’ profit expectations. Investors wonder how much the results have already been baked into share prices.
With the earnings season more than halfway over, most companies in the S&P 500 have surpassed analysts’ profit expectations. As of Friday, results from 87% of those that have reported were better than expected, according to Refinitiv. That is above the historical average of 65% and on pace for the highest share since Refinitiv began tracking the metric in 1994.
And companies aren’t just beating estimates—they are topping them by far more than usual. (…) companies have posted profits that have been 22.8% above expectations. All told, the recent string of strong results has S&P 500 companies on track to post their fastest rate of earnings growth since 2010. (…)
The 265 companies having reported so far showed earnings up 57.4% and analysts expect that when all 500 reports will be in, earnings will have grown 44.7% (45.9% ex-Energy), substantially better than the 24.2% expected on April 1. And Q2 is now seen even stronger!


Trailing EPS are now $153.82. Full year 2021: $182.30e, rising to $206.22 in 2022.
- VW Warns Chip Shortage to Curb Output in Coming Months
- More Than 90 New Airlines Are Launching in 2021. They Say It’s the Perfect Time. A new class of entrepreneurs believes the moment has arrived to do something that has proved difficult in the best of circumstances: Start an airline.


Americans Can’t Get Enough of Stocks Individual investors are holding more stocks than ever before as indexes hit fresh highs. They are also upping the ante by borrowing to magnify their bets or increasingly buying on small dips in the market.
Stockholdings among U.S. households increased to 41% of their total financial assets in April, the highest level on record. That is according to JPMorgan Chase & Co. and Federal Reserve data going back to 1952 that includes 401(k) retirement accounts. (…)
“In order to achieve our clients’ goals, we need to take on more risk,” Mr. Sadkin said. “We intend to continue to reallocate into risk assets while interest rates stay this low.” (…)
TECHNICALS WATCH
My favorite technical analysis service remains concerned at the lack of real, broad, convincing demand, particularly with smaller caps. Using the current buzz word, it remains constructive as it believes that the current selectivity in demand is only transitory.
China Beefs Up Antimonopoly Body Amid Regulatory Push China’s antitrust watchdog is beefing up its senior ranks as authorities step up efforts to rein in powerful technology companies.
- Fidelity Halves Its Ant Group Valuation After Beijing’s Clampdown U.S. mutual-fund giant Fidelity Investments has drastically changed its view of what Jack Ma’s Ant Group is worth after China’s regulatory crackdown on the fintech giant severely dented its growth prospects.
Rather interesting if not all that surprising: