The enemy of knowledge is not ignorance, it’s the illusion of knowledge (Stephen Hawking)

It ain’t what you don’t know that gets you into trouble. It’s what you know for sure that just ain’t so (Mark Twain)

Invest with smart knowledge and objective odds

THE DAILY EDGE: 6 APRIL 2021

Note: sorry for recent site problems as my host needed to do some maintenance.

SERVICES PMIs

USA: Fastest rise in business activity since July 2014 as new order growth reaches six-year high

March PMITM data indicated a substantial increase in business activity across the U.S. service sector, and one that was the steepest for almost seven years. Contributing to the marked upturn in output was the fastest expansion in new business for six years, reflecting strengthening client demand. Firms also registered a renewed rise in new export orders. Meanwhile, rates of input cost and output charge inflation reached fresh record peaks, as firms sought to pass on steep rises in input prices to clients.

Meanwhile, sentiment among service providers about business in the year ahead improved, helping drive employment growth to a three-month high .

The seasonally adjusted final IHS Markit US Services PMI Business Activity Index registered 60.4 in March, up from 59.8 in February and above the earlier released ‘flash’ estimate of 60.0. The rate of output growth signalled was the fastest since July 2014. Service providers often stated that the stronger expansion in business activity was due to greater client demand and the easing of virus containment restrictions in some states.

image

At the same time, new business increased further in March, with the rate of growth accelerating for the third successive month. The pace of the upturn in client demand was the quickest since March 2015. Firms attributed the expansion to greater spending by existing customers as well as the acquisition of new clients, often through more sales and marketing activities. Others suggested that higher confidence stemming from the vaccine roll-out had driven up customer spending.

Total sales were also supported by a renewed increase in new export orders, which rose for the second time in the past four months due to increased demand following easing lockdown restrictions in some markets.

On the price front, input costs soared in March. The rate of inflation accelerated to the fastest since data collection for the services survey began in October 2009. Anecdotal evidence widely linked the uptick in costs to higher prices for key inputs such as PPE, paper, plastics, fuel and transportation.

Subsequently, firms sought to pass on higher costs to clients through a sharper rise in selling prices. A number of companies also stated that stronger client demand allowed a greater proportion of the hike in costs to be passed through. The resulting rate of charge inflation was the quickest on record.

Meanwhile, business expectations regarding the outlook for output over the coming year improved in March. The degree of confidence was robust overall and among the strongest for six years. Optimism was commonly attributed to the ongoing vaccine roll-out and hopes of a substantial boost to new sales if social distancing measures are further eased during 2021.

Stronger positive sentiment was also reflected in a solid rise in employment at the end of the first quarter. The rate of job creation was the quickest for three months, as greater new business inflows sparked an increased need for additional staff. Softer pressure on capacity was evident in only a fractional rise in backlogs of work, and the slowest in the current nine-month sequence of expansion.

The IHS Markit Composite PMI Output Index* posted 59.7 in March, up slightly from 59.5 in February, to signal the fastest upturn in private sector business activity since August 2014. Although the expansion in manufacturing sector production eased, service providers registered a marked rise in output.

Supporting the increase in total activity was the sharpest rise in new business since September 2014. Manufacturers and service providers alike signalled stronger expansions in client demand. At the same time, new export orders increased solidly.

Price pressures remained elevated across the private sector in March. Rates of input cost and output charge inflation reached record highs amid severe supply chain disruptions and input shortages. Some firms noted that stronger demand conditions meant they could pass on a greater proportion of the increase to clients.

Employment continued to rise in March, and at a solid pace. Manufacturers registered a marked increase in backlogs as supply chain issues constrained production capacity.

Finally, business expectations regarding the outlook for output over the coming year improved across the private sector, and were robust overall. (Markit)

China: Solid increase in services activity in March

China’s service sector expanded at a stronger pace in March, with firms reporting the steepest increases in both activity and overall sales for three months. Panel members often attributed the upturn to a further recovery from the pandemic, which in turn boosted new projects and client numbers. Higher new orders led to greater pressure on capacities, with backlogs rising for the first time in five months, which prompted firms to add to their staffing levels. Prices data signalled solid increases in both input costs and output charges.

Optimism regarding the 12-month outlook for activity meanwhile hit its highest for over a decade amid hopes of a strong recovery from the coronavirus disease 2019 (COVID-19) pandemic.

The headline seasonally adjusted Business Activity Index posted 54.3 in March, up from 51.5 in February, to signal a solid increase in Chinese services activity. Furthermore, the rate of growth was the steepest seen for three months and slightly quicker than the series average.

image

Supporting the stronger rise in activity was a further increase in total new work placed with services companies. The rate of new order growth likewise quickened to a three-month high. New export business fell slightly, however, to suggest the upturn was largely driven by stronger domestic demand. Some companies mentioned that the pandemic continued to dampen new orders from overseas. The measure for new export business remained in contractionary territory for the second straight month, though the contraction was limited.

image

Rising intakes of new work led to renewed pressure on operating capacities, as highlighted by the first increase in outstanding business for five months. That said, the rate of accumulation was only marginal. As part of efforts to expand capacity and process orders, employment at service providers increased in March. Though modest, the upturn contrasted with a slight fall in workforce numbers during February.

Average operating expenses faced by Chinese services firms rose for the ninth month running in March. Though solid, the rate of inflation was the softest recorded since last September. Firms cited a variety of factors when explaining the latest rise in costs, including higher prices for raw materials and labour.

In order to alleviate pressure on margins, prices charged by services companies in China rose again at the end of the first quarter. The rate of inflation was the quickest seen in the year to date and solid.

Finally, business confidence improved markedly in March, hitting its highest since February 2011. Companies that projected higher business activity over the year ahead frequently linked this to forecasts of more normal business conditions and a further recovery in market demand once the pandemic ends. There were also reports that new product investment and planned company expansions would boost activity.

image

The Eurozone PMI is out tomorrow.

Nordea:

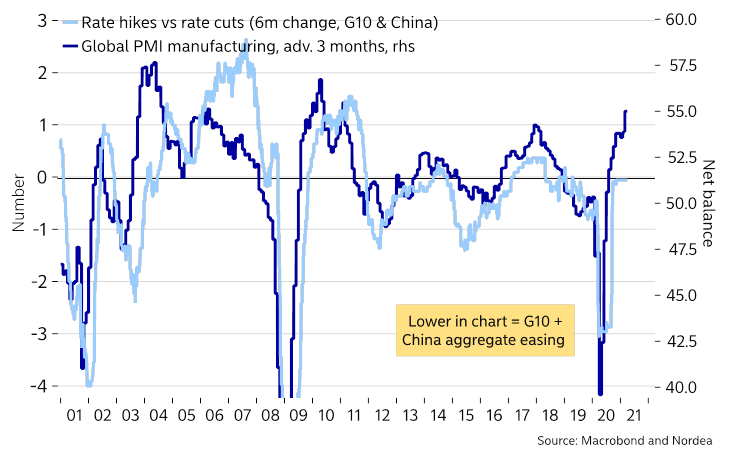
This week delivered the highest global PMI manufacturing reading since 2011, and at these levels manufacturing PMIs are actually screaming for policy tightening. The Fed and Norges Bank are likely to act much earlier than others, with an early tapering decision from the Fed very much in play (perhaps pre-signalled at Jackson Hole?).

It seems as if year over year base effects have started to show up in month over month figures such as PMIs. Maybe it is time for Markit to test whether respondents actually respond to the question asked or whether they are influenced by yearly base effects in the answers.

But we are well past the base effect in U.S. manufacturing. New orders for all manufacturing segments are above their pre-pandemic levels: total manufacturing (+1.9%), Durable Goods (+3.2%) and Core Capex (+8.5%).

fredgraph - 2021-04-06T071301.425

Another example of base effects is the Chase consumer card spending tracker going through the roof on a YoY basis. But the yellow line was almost back to its pre-Covid level in mid-March before easing a little last week.

image

This is in spite of continued depressed spending on services. Check this next chart:

image

The ISM survey on Services at the end of March:

unnamed - 2021-04-06T074829.590

Data: FactSet; Chart: Danielle Alberti/Axios

The Pent-up vs Spent-Up debate

The NY Fed puts itself in the Spent-Up camp in its latest piece “Excess Savings” Are Not Excessive:

(…) Excess savings are unlikely to unleash pent-up demand for services. One caveat to the previous reasoning is that some of the “excess savings” might be due to a dearth of spending opportunities in the sectors of the economy most affected by the virus, such as travel and entertainment. If this is true, some of that lost spending could materialize once those sectors fully re-open.

How large is this “pent-up” demand for services likely to be? On the one hand, there is little doubt that many consumers will enjoy a few extra restaurant meals and perhaps splurge on a nicer vacation after such a long period without them. On the other hand, there is a limit to how many extra restaurant meals and vacations people will be able to enjoy. To have a sense of how much of this pent-up demand might be activated by the “excess savings” accumulated during the pandemic, recall that available estimates of the propensity to consume out of the CARES Act transfers is about one-third. This means that the average household spent about 33 cents out of each dollar received in direct payments. As it turns out, this estimate is in line with those based on previous transfers of this kind, such as the Economic Stimulus Payments of 2008. Therefore, the pandemic does not seem to have substantially limited households’ ability to spend the support that they received.

The bottom line from these three sets of considerations is that, although large by historical standards, the savings accumulated by U.S. households during the pandemic do not appear to be “excessive” when set against the extraordinary need of many American families and the unprecedented government intervention to support them. It is certainly possible that some of these savings will pay for extra travel and entertainment once the COVID-19 nightmare is behind us, but our conclusion is that the resulting boost to expenditures will be limited. This conclusion does not rule out a strong economic recovery from the virus shock. It only implies that spending out of excess savings won’t be one of its major drivers.

The problem here is that pandemic savings are extraordinarily high and in past stimulus payments the savings rate tended to return near its previous level. From its current 13.6%, a return to the 8% range would boost spending tremendously.

fredgraph - 2021-04-06T093128.717

Goldman Sachs is in the Pent-Up camp:

We see several reasons why goods spending will remain strong even as the service sector fully reopens. First, the current overshoot mostly reflects delayed purchases from last spring, suggesting that at most a small amount of future goods spending has been pulled forward so far. Second, consumer expectations for goods purchases have actually increased recently, and many companies also anticipate that demand will remain elevated after the pandemic ends. Third, household income and balance sheets will likely remain supportive of purchases. (…)

After taking demand normalization into account using a category-level forecast, we estimate that real goods spending will fall in 2021H2 as consumers shift consumption back towards services but will still remain well above trend through 2022.

China Asks Banks to Curtail Credit for Rest of Year

At a meeting with the People’s Bank of China on March 22, banks were told to keep new advances in 2021 at roughly the same level as last year, said the people, asking not to be identified as the matter is private. Some foreign banks were also urged to rein in additional lending through so-called window guidance recently after ramping up their balance sheets in 2020, one of the people said. (…)

The PBOC wants banks to focus on lending to areas such as innovative technology and the manufacturing sector, it said at the March gathering. Earlier in the month, Guo Shuqing, chairman of the China Banking and Insurance Regulatory Commission, warned about bubbles in the property and financial markets, fueling concerns policy makers will begin tightening monetary policy. (…)

Last year’s stimulus pushed debt to almost 280% of annual economic output. (…)

U.S. auto industry calls for government help as it warns of impact of chip shortage A U.S. auto industry group on Monday urged the government to help as it warned the global semiconductor shortage could result in 1.28 million fewer vehicles built this year and disrupt production for another six months.
China Creates Its Own Digital Currency A cyber yuan stands to give Beijing power to track spending in real time, plus money unlinked to the global financial system dominated by the dollar. It also could soften the bite of U.S. sanctions.
John Authers: Nirvana for Stocks Rests on Faith in Fed Doves It’s the best of both worlds for equities, with economic data strong and bond yields contained. How long that can continue depends on central bankers.

(…) On Monday, the ISM services survey for last month came in with the highest figure since it started in 1997, while beating expectations by the biggest margin since Bloomberg began compiling economists’ estimates in 2008.

(…) bond yields haven’t been hit hard by April’s strong data. They have come a long way in a hurry, but it is intriguing that both inflation expectations and nominal yields have edged down a little since the beginning of the month (…).

Hedged 10-year U.S. Treasuries offer a much nicer return than equivalent bunds. Foreign buying naturally limits the increase in U.S. yields. (…)

relates to Nirvana for Stocks Rests on Faith in Fed Doves

Everyone is alive to the fact that base rates will give us scary-looking inflation of 3.5% later this year; but the market expects the headline figure to settle down at about 2.5%. As consumer price inflation tends to be a few tenths of a percentage point higher than the PCE measure that the Fed prefers to target, this shows the market thinks the Fed will get what it says it wants — inflation averaging a little above the target of 2% for a while, without accelerating. (…)

The Fed says it really cares about employment. If so, it should be happy with the unambiguously positive trends in the U.S. jobs market. However, the numbers also show that it will want to stay very easy for a while. That could keep downward pressure on yields. (…)

Growth can continue from here without putting pressure on wages and prices (…).

Over time, stocks have tended to move in tandem with the ISM manufacturing index, which again makes sense. The ISM is intended to be a leading indicator of growth, and equities are attempting to discount future growth. Over the last 20 years, the correlation has been very close, so it is to be expected that a blowout ISM number would immediately be followed by a blowout in stocks:

relates to Nirvana for Stocks Rests on Faith in Fed DovesThe bad news is that once the top is in for the ISM, equities almost always pull back. This isn’t necessarily the beginning of a bear market or a crash, but they can be expected to have a bumpier ride before long. (…)

But the story of the latest leg up is that bond yields have stopped their ascent, at least for a few days. There is some chance that faith in a dovish Fed, and the natural market balancing mechanisms that attract buyers when yields rise, can keep them where they are even if reflation continues. If that happens, equity bulls can enjoy themselves a little while longer before the rate of growth peaks.

Employers are in no Nirvana:

Prospective Hires Plied With $1,500 Signing Bonuses and Pizzas Despite high unemployment, a record share of small businesses say they have jobs they can’t fill.

(…) Sierra Pacific Industries, which manufactures doors, windows, and millwork, is so desperate to fill openings that it’s offering hiring bonuses of up to $1,500 at its factories in California, Washington, and Wisconsin. In rural Northern California, the Red Bluff Job Training Center is trying to lure young people with extra-large pizzas in the hope that some who stop by can be persuaded to fill out a job application. “We’re trying to get inside their head and help them find employment. Businesses would be so eager to train them,” says Kathy Garcia, the business services and marketing manager. “There are absolutely no job seekers.” (…)

On April 1 the National Federation of Independent Business reported that in March a record-high percentage of small businesses surveyed said they had jobs they couldn’t fill: 42%, vs. an average since 1974 of 22%. Also 91% of respondents said they had few or no qualified applicants for job openings in the past three months, tied for the third highest since that question was added to the NFIB survey in 1993.

(…) judging from the jobless rate, which the Federal Reserve tracks closely, there’s still plenty of slack in the labor market. But that’s not how employers and job counselors see it. (…)

Many of the jobs that employers can’t fill are low-paying, while the high-paying ones generally require skills that most people don’t have. (…)

Toronto Home-Price Surge Tops 20% as Bubble Debate Heats Up

New listings were up 57% from March 2020, when the onset of the pandemic temporarily caused a freeze in real estate activity. But the new supply was not able to keep up with demand spurred by low borrowing costs and demand for bigger homes, especially in the suburbs, a report from the Toronto Regional Real Estate Board said Tuesday.

Across the metropolitan area, the average price of all homes sold was C$1.1 million (about $878,000) during the month, up 21.6% from last March. Detached homes in the 905 area code, which surrounds the city’s core, sold for 31.4% more, an average of C$1.32 million. (…)

TECHNICALS WATCH

My favorite technical analysis firm is getting concerned by the recent rise in selling indicators but would await confirmation from other indicators before calling a peak.

TAXATION
  • West Virginia Sen. Joe Manchin, seen as a necessary swing vote for Democrats, says he won’t support raising the corporate tax to 28% but could see 25%. (Bloomberg)
  • Richest New Yorkers Face Tax Hike Under Proposed Budget Deal

Governor Andrew Cuomo and state lawmakers have reached a tentative agreement to raise taxes on the wealthiest New Yorkers as part of a roughly $200 billion budget deal expected to be announced as early as Monday, according to a person familiar with the negotiations.

If approved, state income-tax rates would temporarily [!] increase to 9.65% from 8.82% for single filers earning more than $1 million, according to the person, who wasn’t authorized to speak publicly because a final budget hasn’t been reached.

New York City residents with income over that threshold would pay between 13.5% and 14.8%. That compares with 13.3% on income over $1 million in California, currently the highest in the nation, according to the Tax Foundation.

Lawmakers were nearing a budget agreement that would increase corporate and income taxes by $4.3 billion a year with additional revenue going to fund aid for schools, undocumented immigrants and small businesses, the Wall Street Journal reported Sunday, citing unnamed sources. (…)

The New York agreement would create two new tax brackets. Under the proposed plan, income between $5 million and $25 million would be taxed at 10.3% and income over $25 million would be taxed at 10.9%. The new rates would expire in 2027 under the proposed plan. (…) (Bloomberg)
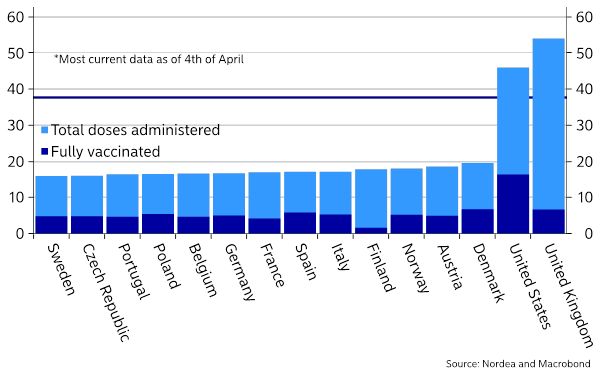
COVID-19

Doses administered and fully vaccinated people as percent of population

THE DAILY EDGE: 5 APRIL 2021

U.S. Added 916,000 Jobs in March as Hiring Accelerated

(…) and the unemployment rate, determined by a separate survey, fell to 6.0%, a pandemic low. Still, as of March, there are 8.4 million fewer jobs than in February 2020 before the pandemic hit. (…)

Friday’s report showed hiring rose in most industries, led by a gain of 280,000 in the category that includes restaurants and hotels. Employment also rose sharply in construction, most manufacturing sectors and public and private schools. Temporary help and auto manufacturing, where a semiconductor shortage has idled assembly plants, were weak spots.

Nearly two million fewer Americans reported last month they were unable to work because their employer closed or lost business due to the pandemic and 500,000 less said they couldn’t seek work due to the pandemic. The share of employees who worked remotely due to the coronavirus also declined last month, the Labor Department said. (…)

Last month, restaurants and bars added 176,000 jobs, arts, entertainment and recreation venues added 64,000 jobs, and accommodations added 40,000 jobs. Still, employment in the overall leisure and hospitality sector is down by 3.1 million, or 18.5% from February 2020. (…)

Construction added 110,000 jobs in March [after shedding 56k in February, likely weather related]. Warehousing and transportation, driven by online shopping, added 48,000 jobs. Job gains in manufacturing sectors such as metal fabrication, machinery and food processing offset the decrease in auto making. (…) (WSJ)

Also:

  • Hours worked rose to 34.9 vs 34.6 in February and vs 35 in January.
  • Average hourly earnings declined 0.1% MoM (likely mix as leisure/hospitality workers are leading the job gains) but average weekly earnings rose .7% MoM and 6.7% YoY.

The Payrolls Index (employment x hours x wages) jumped 1.4% MoM in March and is up 1.7% QoQ after +2.7% in Q4’20 and 5.8% in Q3. Weekly payrolls are now above their February 2020 peak in spite of the 8.4 million missing workers.

fredgraph---2021-04-05T080712.221_th

It is now up 2.1% YoY suggesting positive YoY growth in total spending in coming months.

fredgraph---2021-04-05T075809.938_th

Jobs Report Might Shift Thinking on Inflation, Yields Economists were caught off guard by March’s strong labor market gains and might need to play catch-up on bond yield forecasts

U.S. employers added 916,000 jobs in March or some 241,000 more than predicted by a Wall Street Journal survey of economists. February’s gains were revised higher as well. (…)

The survey week on which the March payrolls report was based came before Americans began to receive their latest stimulus checks and when tens of millions fewer vaccines had been administered than today. A report on Thursday by the National Federation of Independent Business showed a record share of respondents with job openings and a one-year high in the share of businesses that were raising wages to attract workers. (…)

U.S. March PMI at second-highest on record amid marked new order growth and supply chain disruptions

March PMITM data from IHS Markit indicated the second-strongest improvement in the health of the U.S. manufacturing sector since data collection began in May 2007. The overall expansion was supported by the steepest rise in new orders since June 2014, although production was reportedly held back by supply shortages. Supplier lead times lengthened to the greatest extent on record. At the same time, inflationary pressures intensified, with cost burdens rising at the quickest rate for a decade. Firms partially passed on higher input costs to clients through the sharpest increase in charges in the survey’s history.

The seasonally adjusted IHS Markit U.S. Manufacturing Purchasing Managers’ Index™ (PMI™) posted 59.1 in March, up from 58.6 in February but broadly in line with the earlier released ‘flash’ estimate of 59.0. The latest reading was the second-highest on record and signalled a marked improvement in operating conditions across the U.S. manufacturing sector.

image_thumb1

Goods producers registered the fastest upturn in new business for almost seven years in March. Anecdotal evidence suggested the expansion was due to a broad-based strengthening of client demand, though led by a record surge in new orders for consumer goods. Some companies also reported stockpiling efforts among their customers amid soaring input prices. New export orders also increased, albeit at the softest pace for three months.

While output rose for a ninth successive month, the faster rise in demand did not translate into sharper production growth as output was reportedly constrained by supply shortages and unprecedented extensions to lead times. Although still strong overall, the rate of expansion in output was the slowest since last October.

Manufacturers signalled the greatest deterioration in vendor performance since data collection began in May 2007.

Transportation delays, supplier shortages and coronavirus disease 2019 (COVID-19) restrictions reportedly caused logistical difficulties.

Subsequently, input prices rose markedly. The rate of cost inflation was the steepest since March 2011, with firms stating that supply shortages and transportation delays often drove prices up and led to additional fees.

Firms were, however, able to pass on part of the hike in costs to clients, as selling price inflation accelerated to a fresh series peak. The rate of increase quickened for the fifth successive month.

In line with capacity constraints, backlogs of work accumulated at the fastest pace on record in March. As a result, firms expanded their workforce numbers further and at a solid rate. Companies also noted that increased work-in-hand led to a strong depletion of post-production inventories, as current holdings of finished goods were used to fulfil new orders.

Meanwhile, manufacturers stepped up their efforts to stockpile inputs to avoid further delays and safeguard future production. Purchasing activity rose at the quickest pace since September 2018. Consequently, pre-production inventories were broadly unchanged, following a solid contraction in February.

Finally, output expectations strengthened in March. The degree of confidence was the second-highest for over six years, as firms were buoyed by hopes of a successful vaccine roll-out, fresh stimulus and a resulting boost to new sales.

Canadian manufacturers ended the first quarter with a survey-record improvement in overall business conditions. A substantial rise in new work boosted production volumes and stimulated job creation in March. The surge in demand contributed to a strong rise in backlogs, the second-fastest on record. However, material shortages and border restrictions linked to the coronavirus disease 2019 (COVID-19) pandemic continued, which contributed to the greatest lengthening in lead times since April 2020.

Rising prices for inputs including lumber and metals led to the fastest increase in average cost burdens since August 2018. The improved demand environment allowed firms to pass on higher expenses, however.

The headline seasonally adjusted IHS Markit Canada Manufacturing Purchasing Managers’ Index® (PMI®) registered 58.5 in March, up considerably from 54.8 in February, to become the highest reading in over ten years of data collection.

image_thumb3

Manufacturers reported the second-fastest rise in output levels since the series began, which was often linked to increased workloads and greater production capacity. Meanwhile, new work expanded at the joint-third fastest pace to date. Survey respondents widely commented on greater demand from both domestic and export markets.

To cater for the surge in demand, manufacturers added to workforce numbers during the month, with the rate of job creation reaching a three-month high. Despite this, there were further signs that manufacturing companies were unable to keep up with rising workloads at the end of the quarter, with volumes of unfinished business increased at a near survey-record pace. Some manufacturers noted that stretched supply chains and a shortage in the supply of material resulted in the build-up of outstanding work.

Average lead times from vendors lengthened to the second-greatest extent since the survey began in the late-2010. Anecdotal evidence suggested border restrictions (linked to COVID-19), adverse weather conditions and supplier shortages had led to worsening vendor performance.

In line with higher output, firms raised their input buying at the end of the quarter, with the latest increase the fastest in three months. Manufacturers meanwhile sought to build safety stock with the rise in pre-production inventories the largest in two-and-a-half years.

Robust demand for raw materials contributed to the strongest rate of input cost inflation since August 2018. Survey respondents commented on higher prices for steel and lumber in particular. The stronger demand environment allowed firms to pass on the higher expenses, however.

Manufacturers remain upbeat about their growth prospects over the next 12 months, with the degree of optimism the strongest since May 2019. Some companies based their expectations on a return to normality following vaccination rollouts whilst others hoped for stronger economic conditions.

  • U.S. manufacturing sector index races to 37-year high in March: ISM

The Institute for Supply Management (ISM) said on Thursday its index of national factory activity jumped to a reading of 64.7 last month from 60.8 in February. That was the highest level since December 1983. (…)

Its forward-looking new orders sub-index jumped to 68.0 in March. That was the highest reading since January 2004 and was up from 64.8 in February. Factories also received more export orders, while order backlogs swelled. (…)

More from the ISM report:

  • Of the 18 manufacturing industries, 17 reported growth in March
  • Customers’ Inventories Index at an all-time low
  • Backlog of Orders Index growing to an all-time high.
  • The Prices Index expanded for the 10th consecutive month, indicating continued supplier pricing power and scarcity of supply chain goods.
  • “Demand remains strong. Significant supply impacts on raw materials due to the Texas freeze. All major raw-material and suppliers on force majeure.” (Chemical Products)
  • “We have had to provide better compensation to keep qualified talent.” (Fabricated Metal Products)
  • “Business is even stronger for us this year through the third quarter, and we expect a very healthy growth of our manufacturing sales.” (Electrical Equipment, Appliances & Components)
  • Commodities Up in Price

Acetone (2); Acrylonitrile Butadiene Styrene (ABS) Plastic (3); Adhesives; Aluminum (10); Aluminum Extrusions (2); Brass Products; Copper (10); Copper Products; Corn; Corrugate (6); Corrugated Boxes (5); Crude Oil (4); Diesel (3); Electrical Components (4); Electronic Components (4); Epoxy Resins; Ethylene; Freight (5); Foam Products; High-Density Polyethylene (HDPE) (3); Isocyanate; Labor — Temporary; Light Emitting Diode (LED) Displays; Lumber (9); Medium-Density Fiberboard (MDF); Nylon Fiber (3); Ocean Freight (4); Oil-Derived Products (2); Packaging Supplies (4); Paper Products (4); Petroleum-Based Products; Phosphates; Plastic Resins (7); Plasticizers; Polyethylene (2); Polypropylene (9); Polyvinyl Chloride (PVC) (6); Propylene (3); Resin-Based Products (2); Rubber Products (2); Semiconductors (2); Solvents — Other (2); Soybean Products (6); Steel (8); Steel — Carbon (4); Steel — Cold Rolled (7); Steel — Galvanized; Steel — Hot Rolled (7); Steel — Scrap (4); Steel — Stainless (5); Steel Products (7); Styrene; Surfactants; Wire Products; Wood — Pallets (4); and Vinyl Acetate Monomer.

  • Commodities Down in Price: None.
  • Commodities in Short Supply

Adhesives; Corrugated Boxes (5); Electrical Components (6); Electronic Components (4); Epoxy Resins; Fiberboard; Foam Products; Freight; Light Emitting Diode (LED) Displays; Lumber; Personal Protective Equipment (PPE) — Gloves (13); Plasticizers; Polyols; Polypropylene (2); Polyvinyl Chloride (PVC); Plastic Resins — Other; Plastic Products (2); Semiconductors (4); Solvents; Steel (4); Steel — Carbon; Steel — Hot Rolled (5); Steel — Stainless; Steel Products (2); Vinyl Acetate Monomer; and Wood Products.

Note: The number of consecutive months the commodity is listed is indicated after each item.

U.S. Light Vehicle Sales Strengthen During March

U.S. sales of light vehicles strengthened last month as COVID-19 vaccines were more readily available. The Autodata Corporation reported that light vehicle sales during March surged 13.0% to 18.00 million units (SAAR) and were up by more than one-half y/y.

Sales of light trucks jumped 13.3% (66.0% y/y) during March to a record 13.99 million units. (…) Trucks’ share of the light vehicle market improved to a record 77.7%.

Auto sales increased 12.0% (35.9% y/y) last month to 4.01 million units, the highest level since February of last year. (…)

Imports’ share of the U.S. vehicle market increased last month to 24.4%, up from a low of 19.9% during all of 2015. (…)

China looks to rein in lending to cool property boom Small and foreign banks rush to ‘radically’ reduce loans that buoyed Covid recovery

The FT reveals that after new loan growth hit 16% in the first two months of the year, the PBOC instructed domestic and foreign lenders “to keep new loans in the first quarter of the year at roughly the same level as last year, if not lower”.

Mortgage Firms Warned to Prepare for a ‘Tidal Wave’ of Distress

Mortgage companies could face penalties if they don’t take steps to prevent a deluge of foreclosures that threatens to hit the housing market later this year, a U.S. regulator said Thursday.

The Consumer Financial Protection Bureau warning is tied to forbearance relief that’s allowed million of borrowers to delay their mortgage payments due to the pandemic. To avoid what the bureau called “avoidable foreclosures” when the relief lapses, mortgage servicers should start reaching out to affected homeowners now to advise them on ways they can modify their loans. (…)

More than 2 million borrowers as of January had either postponed their payments or failed to make them for at least three months, the bureau said. Once government-authorized forbearance plans begin to end in September, hundreds of thousands of people may need assistance getting back on track.

Some 10.9% of subprime borrowers with outstanding auto loans or leases were more than 60 days past due in February, up from 10.7% in January and 8.7% a year prior, according to credit-reporting firm TransUnion. It marked the sixth consecutive month-over-month increase and the highest level in monthly data going back to January 2019.

More than 9% of subprime auto borrowers were more than 60 days past due in the fourth quarter, the highest quarterly figure in data going back to 2005. (…)

Many lenders granted customers one to three months of relief before requiring them to start paying again. Some customers started the pandemic in relatively good financial shape but have fallen into what is considered subprime, which many lenders define as those with credit scores of 600 or less on a scale of 300 to 850. (…)

Subprime financing accounted for about 19% of the number of auto loans and leases originated in 2020, down from roughly 22% a year prior, according to Experian PLC.

That decline has contributed to the increasing proportion of subprime delinquencies. With fewer subprime loans being made, the delinquent borrowers make up a bigger share of the subprime pool. (…)

The share of borrowers with midrange to near-perfect credit scores who have missed auto-loan or lease payments remains close to 0%, according to TransUnion. (…)

OPEC, Allies Agree to Boost Output, Betting on Demand Rebound OPEC and an alliance of other top oil producers agreed to boost their collective production by more than two million barrels a day over coming months.

The Organization of the Petroleum Exporting Countries and a group of other big producers led by Russia agreed to boost output in May by 350,000 barrels a day, and by the same amount again in June, according to delegates. They agreed to then increase output by another 450,000 barrels a day in July. Saudi Arabia, meanwhile, agreed to start easing separate, unilateral cuts of one million barrels a day that it put in place earlier this year. It plans to end those cuts altogether by the end of July, delegates said. (…)

Ahead of the meeting between the two groups, Saudi Arabia had initially backed plans to keep production unchanged, delegates said. The decision to hike output “was a complete U-turn,” one of them said. (…)

US retail trading cools as hot stocks fade and lockdowns ease Stimulus cheques fail to ignite new surge with consumers saving for holidays and goods

(…) “Sitting on these losses, investors are less likely to deploy capital immediately,” said Viraj Patel, a strategist at Vanda. “We’re not seeing net selling — they’re just waiting for a rebound in some of these names.” (…)

The WSJ adds:

(…) companies across the industry experienced steep declines in traffic in March, compared with February. Robinhood Markets Inc., for example, saw about a 35% drop-off in traffic, according to SimilarWeb, whose data doesn’t capture traffic via apps. (…) “People are still more engaged than they have been historically, ” said Devin Ryan, director of financial technology research at JMP Securities, noting that trading activity is still higher than many periods of 2020. (…)

Canada’s IPO craze hit by growth stock selloff, Canadarm maker MDA slashes deal size by 20%

U.S. Growth Stirs Fears of New ‘Taper Tantrum.’ This Time May Be Different. Red-hot U.S. economy draws billions from emerging markets, reviving memories of past investor flight, but developing world entered pandemic stronger

(…) As investors rush to buy U.S. assets, they have driven U.S. Treasury bonds yields sharply higher this year. Should that continue, economists worry that the higher returns offered for riskless investments in the world’s largest economy could pull money from emerging markets, where vaccine campaigns have barely begun. (…)

Indeed, over the past month, central banks in Brazil and Russia, in addition to Turkey, have raised interest rates, in part to defend against capital outflows and to support their currencies. (…)

The increase in emerging markets’ interest rates awakened memories of the so-called “Taper Tantrum” of 2013. In May of that year, then-Federal Reserve Chairman Ben Bernanke told lawmakers the central bank was considering a slowdown in its purchases of government bonds, without actually announcing such a change in policy.

To many Fed watchers, he was simply repeating a view first expressed in January 2013. But investors took fright and pushed yields on U.S. government bonds sharply higher, sending shock waves around the world, with particularly troubling consequences for emerging markets.

To stem the 2013 outflow of capital, a number of central banks in large developing countries had to raise their key interest rates, thereby slowing their economies. Should they be forced to do so again this year, it would add to an already weak recovery from the effects of the pandemic. (…)

In 2013, current-account deficits—a measure of how much capital a country needs—had been large for a number of years, so it was a problem when investors became reluctant to provide more capital. Now, according to Fitch Ratings, those gaps are significantly smaller.

Fitch economists estimate that current-account deficits for 81 countries they monitor will be just 2% of annual economic output this year, compared with 3.2% in 2013. (…)

“I wouldn’t discount the possibility of a repeat of 2013,” said Stephen Schwartz, head of sovereign ratings for the Asia-Pacific region at Fitch Ratings, but “even if there were to be a repeat, it would likely be contained.”

A 28% Tax Rate Will Cost Companies, but Not Equally Tax bills would rise most for U.S.-focused firms that benefited more from 2017 tax cuts, offsetting some gains from stimulus spending.

A tax increase, which would take effect as early as January 2022, would cut into corporate profits as the economy recovers, and the Biden plan could reduce the earnings of companies in the S&P 500 by at least 10%, said accounting analyst Dave Zion of the Zion Research Group. (…)

Those with a high proportion of domestic earnings are directly affected by the rate increase while multinationals are likely to focus more on the changes to the minimum tax on foreign income. (…)

Large U.S. multinational companies paid an 8.8% tax rate on their world-wide income in 2018, down from 15.8% in 2017, according to data released recently by the congressional Joint Committee on Taxation. (…)

The Biden plan also raises taxes on U.S. companies’ foreign income. It would create a 15% minimum tax on companies’ income as reported on financial statements—partly a response to companies that report profits to investors but use legal credits and deductions to reduce their tax bills.

That tax is likely to be scaled-back from the version Mr. Biden campaigned on; it would cover only about 200 companies and avoid clawing back the benefits of many tax credits, including those for corporate research. (…)

COVID-19

Countries set to pay economic price for failing to control Covid Nations with fresh infections and slower vaccination face weaker recovery, research suggests

U.S. infections rising (CalculatedRisk)

COVID-19 Positive Tests per Day

Via John Authers:

  • Diverging paths:relates to Markets Can’t Process This ’60s-Style Recovery
  • But there is also that:

relates to Markets Can’t Process This ’60s-Style Recovery