FLASH PMIs
Eurozone economy returns to growth for first time in six months
Eurozone business activity returned to growth in March, fueled by a survey record increase in manufacturing output as global demand continued to revive from the pandemic. The service sector was again hit by virus-related restrictions, though even here the decline was the weakest since last August. Hiring picked up as firms boosted capacity in line with fuller order books and optimism about the year ahead. Sentiment was tarnished, however, by concerns over rising virus infection rates.
March also saw firms’ costs rise at the fastest rate for a decade, pushing prices charged for both goods and services higher during the month. Goods prices rose especially markedly, posting the largest rise for almost ten years, often linked to suppliers hiking prices amid record supply chain delays as shortages worsened.
The headline IHS Markit Eurozone Composite PMI® rose from 48.8 in February to 52.5 in March, according to the preliminary ‘flash’ reading. By rising above 50.0, the latest reading indicated the first increase in business activity since last September, with the current expansion the largest recorded since last July and the second-steepest seen over the past 28 months.
Divergent trends were seen by sector. While manufacturing output growth accelerated sharply to the highest since data were first available in 1997, the service sector continued to be constrained by the coronavirus disease 2019 (COVID-19) pandemic, with social distancing restrictions leading to a seventh successive monthly fall in business activity.
The rate of contraction in the service sector nevertheless moderated to the slowest seen over this period, thanks to spill-over benefits from strong manufacturing growth, a modest easing of virus containment measures and encouraging prospects for the year ahead.
The manufacturing upturn was led by a record surge of factory production in Germany, accompanied by the fastest production growth since January 2018 in both France and the rest of the region as a whole.
Germany also outshone in terms of service sector performance, recording the first (albeit modest) expansion of activity for six months while France and the rest of the euro area merely saw rates of contraction moderate.
Looking at growth over both sectors combined, Germany’s resulting upturn was the strongest for just over three years (the composite PMI rising from 51.1 to 56.8), contrasting with a decline in France for the seventh successive month (albeit with the index at 49.5, up from 47.0 in February). The rest of the region saw a modest return to growth for the first time since last July (composite index at 50.6 versus 48.2 in February).
Inflows of new business also returned to growth over the eurozone as a whole, increasing to the greatest extent since last July. Export orders rose especially sharply, rising at a pace rarely exceeded in the survey’s history due largely to an unprecedented increase in manufacturing, in turn led by a record rise in Germany.
The upturn in order book inflows caused backlogs of work to rise for the first time in 28 months, growing especially sharply in Germany.
Companies responded to the accumulation of uncompleted orders with a second successive month of net hiring, with employment growing at the steepest pace since November 2019.
Manufacturers saw headcounts rise at a rate not seen since August 2018 while a far more modest rate of job creation was seen in the service sector, although even here the rise was the largest since the onset of the pandemic.
France reported the highest rate of job creation, with jobs growth at the steepest since October 2018, while Germany reported the largest payroll gain since June 2019. Job losses meanwhile eased in the rest of the region to the lowest since the pandemic started.
Job creation was also supported by business expectations for the year ahead remaining elevated, although optimism waned slightly from February’s three-year high due in part to concerns over a third wave of virus infections.
The return to growth was accompanied by a further increase in price pressures. Average prices charged for goods and services rose to a degree not seen since January 2019, with goods prices rising particularly steeply, posting the largest gain for almost a decade. Prices rose far more modestly in the service sector, yet the increase was notable in being the first since the pandemic began.
Higher charges often reflected rising costs. Average input prices across both manufacturing and services rose in March at the sharpest rate for a decade. Factory input cost inflation struck the highest since March 2011, often linked to supply shortages. March saw supplier delivery times lengthen to the greatest extent in the survey’s 23-year history. However, service sector input costs also grew sharply, rising at the fastest pace since February of last year. Higher costs were observed across the board, with Germany reporting the steepest increases.


Japan: Downturn in private sector activity persists in March
At 52.0 in March, the headline au Jibun Bank Japan Manufacturing Purchasing Managers’ Index™ (PMI)® rose from 51.4 in February to signal a quicker improvement in operating conditions. Although output growth softened slightly, new order volumes expanded at the fastest pace since October 2018. That said, manufacturers remained reluctant to take on additional staff, as job shedding continued for a third consecutive month. Moreover, positive sentiment eased in March, with the level of optimism the softest for nine months.
The au Jibun Bank Flash Japan Services Business Activity Index rose from 46.3 in February to 46.5 in March, indicating a softer deterioration in the services sector. New business inflows reduced at the softest pace since October 2020, amid ongoing restrictions on movement. Positively, the pace of job creation quickened in March and was the fastest for 22 months. Firms also remained confident that activity would increase over the next 12 months, despite optimism dipping slightly in comparison to February.

HOUSING
Harsh winter weather throughout the country kept many potential home buyers indoors last month. Sales of new single-family homes declined 18.2% (+8.2% y/y) during February to 775,000 units from 948,000 in January, revised from 923,000. Earlier figures also were revised. The Action Economics Forecast Survey expected 879,000 sales in February.
Sales fell throughout the country. Midwest sales dropped 37.5% (+4.9% y/y) to 85,000, the lowest level since last June. In the West, sales weakened 16.4% (-8.1% y/y) to 194,000, down from last October’s high of 277.000. Sales in South were off 14.7% (+20.2% y/y) to 458,000. Falling by 11.6% both m/m and y/y were sales in the Northeast to 38,000 [-11.6% y/y], well below a June 2020 high of 52,000.
The median price of a new home fell 1.1% (+5.3% y/y) in February to $349,400. Working 1.4% higher (7.7% y/y) to $416,000 was the average price of a new home. These prices are not seasonally adjusted.
The supply of new homes for sale in February rose to 4.8 months, up from 3.5 months in October. The median number of months a new home stayed on the market after completion declined to 3.2, after surging to 4.5 months in both August and September of last year.

The South (blue) remains THE growth area: February new home sales were 5% above their 2019-2020 average. Excluding the South (black), February sales were back to their flat trend line. New home sales in the West are down 8.1% YoY, 2.5% below their 2019-2020 average.

Existing-home sales fell 6.6% in February from the previous month, but sales are still 9.1% higher than last year, per the National Association of Realtors. While the South remains the clear growth leader, existing home sales are up in every region YoY in February.

Declining affordability remains the problem for the lower income segment of the population.

These people are more likely to shop for used houses given that the median price of newly built houses is $349k while the median existing-home sales price is $313,000, 15.8% higher than in February 2020, with all regions posting double-digit price gains.

But existing housing inventory in February fell to a record low of 1.03 million units, down by 29.5% YoY — the fastest decline on record.
The NAR says that properties typically sold in 20 days, also a record, and homes with price tags between $250,000 and $500,000 were on the market for just 14 days.

- ING says that housing will be a major GDP growth driver in 2021.
The recovery in the housing market has led a turnaround in the construction sector as the left-hand chart below shows. The National Association of Home Builders reports that sentiment remains close to all-time highs (it has a 36-year history) with construction employment having risen by 805,000 since April and with housing starts hitting a 14-year high in December.
With home prices well supported by decent demand amidst a dearth of supply this should incentivise more construction activity despite the higher costs for building materials, such as lumber and steel. Consequently, residential investment is likely to continue making a strong contribution to GDP growth this year.
A strong housing market also boosts demand elsewhere in the economy. Housing activity is strongly correlated to retail sales – as people move to a new home they typically spend money on new furniture and home furnishings, garden equipment and building supplies such as a new paint job and a bit of home improvement. It also results in demand for moving services while generating legal and mortgage fees within the service sector, which should also all help boost economic activity through this year.
Construction spending & residential investment (YoY%)
Source: Macrobond, ING

The downside from all this is that higher housing costs will feed through into higher consumer price inflation. As the chart below shows, the rent of primary residence CPI component (7.8% of the CPI basket by weight) and owners’ equivalent rent of residences (24.2% of the CPI basket by weight) typically lag turning points in the S&P Case Schiller house price series by around 14 months.
The chart suggests that housing will soon be contributing positively to US inflation readings, which given housing’s combined CPI weighting of 32% is a key reason why we believe that inflation will stay higher for longer than the Federal Reserve thinks.
Surging house prices to push consumer price inflation higher
Source: Macrobond, ING

MORE SUPPLY PROBLEMS
- Auto Dealerships Face Inventory Squeeze The car industry entered 2021 hoping to restock, but supply-chain problems are extending the crunch—meaning slimmer pickings, higher prices and longer waits.
(…) The lack of new cars stands as a barrier to what could be a strong bounceback year for the industry. (…)
A monthslong shortage of semiconductors has forced auto makers to cut production of even their most-lucrative vehicles. Winter storms in Texas last month disrupted plastics production, leading to shortages of seat foam and other materials, car makers and suppliers have said. A backup at West Coast ports is delaying vehicle-part shipments from Asia. (…)
At the end of February, dealers had 2.7 million vehicles in stock or being shipped to stores, a 26% drop from the same month last year, according to Wards Intelligence. (…)
Car companies on average spent about $3,562 per vehicle on discounts and other sales incentives in February, a $600 drop from the same month a year earlier, according to research firm J.D. Power. (…)
GM has said the lost production could hurt pretax profit by as much as $2 billion this year; Ford pegged the hit at up to $2.5 billion. (…)
- Unusual Leap in Gas Prices Puts $3 a Gallon in Sight The prospect of summer drivers crowding U.S. highways is powering steep gains in the price of gasoline, a sign of economic recovery and a boon for the pandemic-ravaged energy industry.
(…) That marks a 30% increase over this time last year, when the pandemic’s lockdowns slammed fuel usage. (…)
Supporting gasoline’s climb is a rebound in crude-oil prices and a big drop in the amount in storage. The price of West Texas Intermediate crude has advanced by more than 60% since the end of October to $57.76 a barrel Tuesday, even after a recent tumble. Crude accounts for 56 cents of every dollar consumers spend on gasoline, according to the Energy Information Administration.
Refiners throttled back output last year in response to lower prices and weak demand. The winter freeze that struck Texas in February then knocked some of the nation’s biggest out of action. The combination dragged stocks of motor gasoline below normal levels for March. (…)
- LDPE plastic film is used for dry cleaner bags, bread bags, paper towel overwrap, and shipping sacks. LLDPE is used for plastic wrap, stretch wrap, pouches, toys, covers, lids, pipes, buckets, containers, cables, geomembranes, and flexible tubing.

- Suez Canal Is Blocked by Container Ship Causing Huge Traffic Jam Egyptian authorities worked to dislodge a giant container ship that remained stuck in the Suez Canal, blocking all traffic on one of the world’s busiest shipping arteries.
This last one is surely transitory…
Meanwhile, demand is rising sharply as Americans receive their new stimmies as Chase’s Spending Tracker reveals:

From Bank of America’s own card spending data: “Just as initial stimulus payments started arriving, spending on athletic footwear and apparel jumped over 19% from the prior year. (via Axios)
Even though confidence remains low:

So far, pent up wins over spent up.
Powell Says Stimulus Package Isn’t Likely to Fuel Unwelcome Inflation “We might see some upward pressure on prices. Our best view is that the effect on inflation will be neither particularly large nor persistent,” he said, reiterating comments he has made repeatedly since the measure was enacted earlier this month.
(…) Ms. Yellen said President Biden’s post-pandemic plans will likely need to be paid for with tax increases, such as returning the corporate tax rate to 28%. But she said those changes wouldn’t come until the pandemic is over and would ultimately help the economy. (…)
But there’s more stimulus seemingly coming:
- Biden Administration Officials Put Together $3 Trillion Economic Plan The first proposal in the multipart package would center on roads, bridges and other infrastructure projects, while the second is expected to focus on education and other priorities.
(…) The first proposal would center on roads, bridges and other infrastructure projects and include many of the climate-change initiatives Mr. Biden outlined in the “Build Back Better” plan he released during the 2020 campaign.
That package would be followed by measures focusing on education and other priorities, including extending the newly expanded child tax credit scheduled to expire at the end of the year and providing for universal prekindergarten and tuition-free community college, the people said.
The packages could face a difficult path through the narrowly divided Congress, and Democrats aren’t all in agreement on how they should move forward with their spending and tax proposals. Mr. Biden is expected to be briefed on the details of the proposals this week, and the people warned that the strategy is preliminary. Mr. Biden would need to sign off on the legislative strategy for it to move forward. (…)
If the proposals add up to $3 trillion over a decade, that would represent 1% of GDP and a 5% increase in federal spending beyond current projections.
Democrats are also exploring raising the top marginal income-tax rate for high-income individuals, increasing capital-gains taxes and tightening international tax rules on companies, according to lawmakers and aides. Sen. Ron Wyden (D., Ore.), the chairman of the Senate Finance Committee, is expected to detail more international-tax proposals soon. (…)
How Not to Panic About Inflation Remember the lessons of the 2010-2011 scare.
Paul Krugman is “betting” it’s all transitory, making no distinction between monetary stimulus (post 2009) and direct-to-consumer fiscal stimulus.
(…) The key thing to understand is that there are really two kinds of inflation.
The prices of some goods, like oil and soybeans, fluctuate all the time, changing day by day or even minute by minute in response to changes in supply and demand. Inflation in these goods is easy come, easy go; prices may soar quickly when demand is high or supply is tight, but they can plunge just as quickly when market conditions change.
Many other prices, however — including the prices of labor, that is, wages and salaries — change much less frequently. Most workers’ wage rates are adjusted just once a year.
And stagflation, it turns out, mainly involves these “sticky” prices. (…)
So what’s going to happen in the months ahead? We’ll probably see a number of transitory price increases, not just because the economy is booming, but also because the lingering effects of the pandemic have produced some unusual disruptions — for example, a global shortage of shipping containers.
The question will be whether these price increases are a 2010-2011-type blip or something more dangerous. Smart observers will look past the headlines to measures of underlying inflation — not just the Fed’s standard “core” measure but things like the Atlanta Fed’s sticky price index as well. Anecdotal evidence, otherwise known as “talking to people,” will also be important: Are businesses actually starting to set prices and wages based on the expectation of high future inflation?
If they aren’t — and my bet is that they won’t be — then the lesson of 2010-2011 will remain: Don’t panic.
Now as then there are people eager to denounce government attempts to help the economy. And it’s certainly possible that the American Rescue Plan will turn out, in retrospect, to have been too much of a good thing. But don’t let the usual suspects seize on a few months’ inflation data as evidence of looming disaster.
David Rosenberg, rarely in agreement with Krugman, presents the bullish view on bonds:
The future is one of frugality, and not frivolity. This will be the “Boring Twenties,”not the “Roaring Twenties.”The longer end of the Treasury market has peak inflation and peak Fed tightening priced in, and is supremely oversold. Enough said.This week’s Treasury auctions will be a critical test.
- Sentiment is at its low:

- “Bond yields have always peaked out and rolled over at these levels.” Like Ronald Reagan, I trust but verify: the red dots are approximately where sentiment bottomed above. Rosie is right!

ZeroHedge adds a trading angle to this “worst in decades bloodbath”:

This almost unprecedented carnage has strategists predicting large quarter-end rebalancing flows out of equities and into Treasuries. Bank of America strategists estimated that $88.5 billion could shift into U.S. fixed income, including $41 billion into Treasuries.
And we do now know who the most recent marginal seller was.
Since the start of the year, 85% of the cumulative decline in TY futures prices occurred in the overnight session, i.e., Japan is almost single-handedly responsible for the dump surge in yields this year! (…)
Hornbach writes that “we have good reason to believe the selling from Japan won’t last… into April.” That’s because the fiscal year in Japan ends on March 31.
Source: Bloomberg
Source: Bloomberg


Scott Minerd, Global CIO, Guggenheim Investments offers yet another angle:
(…) The question investors face is whether the selloff has more room to run. Our analysis suggests it has largely run its course. The market is now pricing in a neutral rate of 2.35 percent, nearly in line with the Fed’s optimistic long run dots. The chart below shows that the bond market has had difficulty sustaining rates at or near the Fed’s neutral rate projection, and we see no reason to expect a different result this time. Nor do we expect the Fed to revise up its neutral rate estimate.
The Fed’s Optimistic Neutral Rate Projection Is Almost Fully Priced In
Source: Guggenheim Investments, Bloomberg. Data as of 03.19.2021. FOMC neutral rate projection is the median “Longer Run” dot from the Summary of Economic Projections. Market neutral rate projection is the 5-year forward 5-year Overnight Index Swap rate. Fed Funds Rate is depicted using the interest rate on excess reserves.

But is oversold really bullish? From SentimenTrader:

“Oversold” doesn’t always mean “buy” and this seemed to be the case here.
When the contract first fell more than 8% below its 100-day average, it tended to lose even more ground over the next 2 months. The 10 prior signals did not provide a consistent signal that mean-reversion was about to rear its head.
And economic surprises remain good so far per Citigroup (via Ed Yardeni):

And if the economy grows 4% or more in nominal terms, and 10Y Ts yield range between 0% and 2.5% below nominal GDP growth rate like they have for the last 20 years, the yield range is 1.5% to 4.0%.

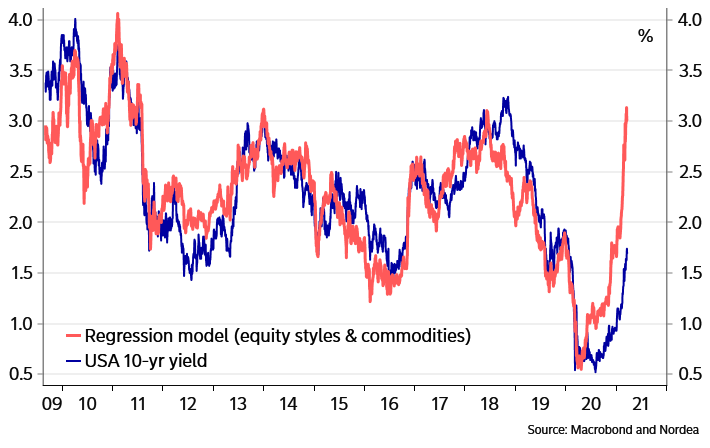
In fact, Nordea’s models suggest 2.0-3.0%:
US 10-year should be heading to 2% …
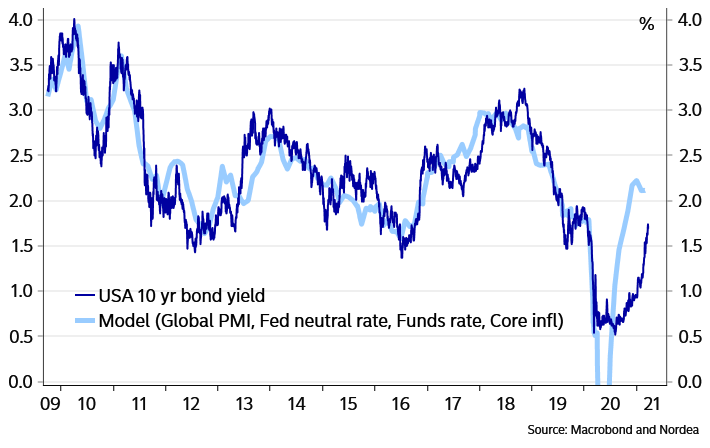
… or higher if other markets are consulted
Nordea to Krugman:
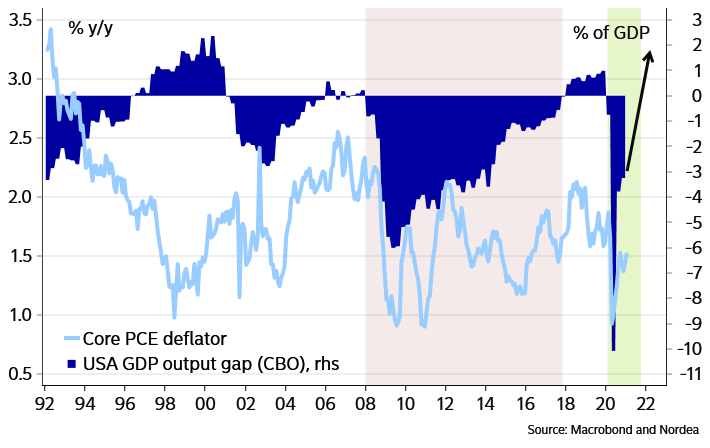
It is important to understand that the slump of 2020 was a disease-driven supply shock and not a recession where economic imbalances got laid bare as central banks tightened policy by hiking rates. From a macro perspective, 2020 was nothing like the financial crisis, after which it took 10 years to close the output gaps created by the crisis. This time, as soon as the root cause of the supply shock is cured, which will be very soon, the economies can be expected to get back to the starting point very quickly.
The US output gap
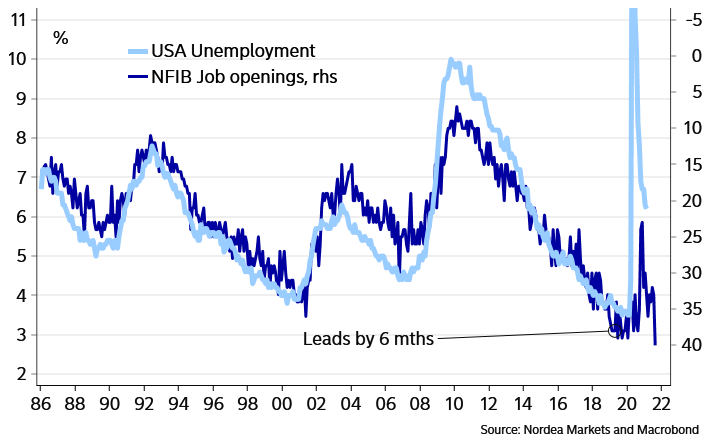
I think this also will be true when it comes to the labour market. Central banks are currently clearly worried that it will take a long time before that happens. Interestingly, the share of US small businesses that have job openings is at an all-time high, something that historically has meant rapidly dropping unemployment numbers.
Unemployment should drop fast
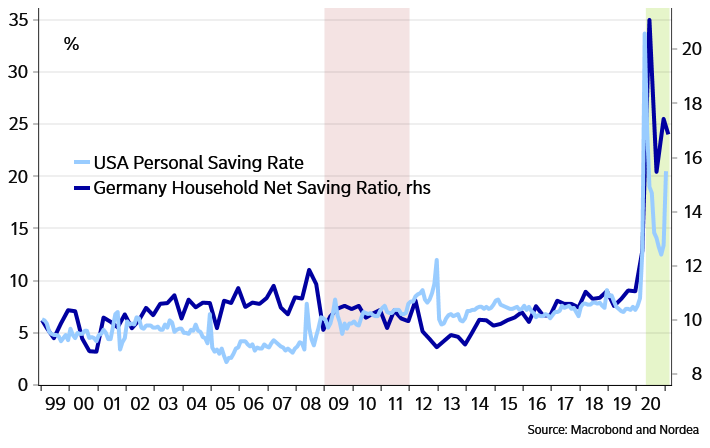
(…) It has basically never happened before that the world exits a recession with a huge pile of cash in households’ hands. This was true already before Biden’s new stimulus checks. It is thus not only reasonable to believe that output gaps will close quickly, but also that we could see the most positive output gaps for decades.
A huge pile of cash to spend
25% of U.S. Has Received a Shot
(…) The glacial speed of vaccination programs in many parts of the Asia-Pacific will mean social distancing and travel bans deep into the second half of 2021—and potentially beyond. Currently, China has deployed fewer than six vaccine doses per 100 people, according to Our World in Data, compared with the U.S. figure of 38 and the European Union’s 13. Developed economies in the region trail even further behind: South Korea, Japan and Australia have each deployed fewer than two doses per 100 people. (…)


")