The enemy of knowledge is not ignorance, it’s the illusion of knowledge (Stephen Hawking)

It ain’t what you don’t know that gets you into trouble. It’s what you know for sure that just ain’t so (Mark Twain)

Invest with smart knowledge and objective odds

THE DAILY EDGE: 25 July 2023: Stagflation?

Note: I am travelling for the next several weeks, impacting frequency and depth.

FLASH PMIs:

USA:

This is how S&P Global summarizes its U.S. Flash PMI survey:

July is seeing an unwelcome combination of slower economic growth, weaker job creation, gloomier business confidence and sticky inflation.

The overall rate of output growth, measured across manufacturing and services, is consistent with GDP expanding at an annualized quarterly rate of approximately 1.5% at the start of the third quarter. That’s down from a 2% pace signalled by the survey in the second quarter.

However, growth is being entirely driven by the service sector, and in particular rising spend from international clients, which is helping offset a becalmed manufacturing sector and increasingly subdued demand from US households and businesses.

Furthermore, business optimism about the year-ahead outlook has deteriorated sharply to the lowest seen so far this year. The darkening picture adds downside risks to output growth in the coming months which, alongside the slowing in the pace of expansion in July, will keep alive fear that the US economy may yet succumb to another downturn before the year is out.

The stickiness of price pressures meanwhile remains a major concern. As the survey index of selling prices has acted as a reliable leading indicator of consumer price inflation, anticipating the easing to 3% in June, it sends a worrying signal that further falls in the rate of inflation below 3% may prove elusive in the near term.

The report often mentions subdued demand and new orders overall, including in domestic services, continued pressures on wages in spite of greater labor availability, and sticky inflation.

The rate of output charge inflation meanwhile picked up in July. Firms sought to pass through higher costs and increased interest rate payments to customers, with the overall rise driven by service providers. The pace of increase at services firms was steeper than the long-run series average. Goods producers noted little change in selling prices, with the rate of inflation the joint-slowest in the current 38-month sequence of increase.

EUROZONE: Flash PMI signals steeper downturn and cooling price pressures at start of third quarter

On inflation:

Inflationary pressures meanwhile moderated in July, with gathering deflation in manufacturing compounded by slower service sector inflation. Measured across both sectors, the rate of input cost inflation fell again in July, down for a tenth straight month to its lowest since November 2020 and dropping further below the survey’s long-run average. Average prices charged for goods and services meanwhile rose at the slowest rate for 29 months.

In manufacturing, falling demand for inputs, combined with improved supply, led to further discounting in supply chains. Over the 25-year survey history, only the six-month period to May 2009 has seen a steeper rate of decline in average factory input prices than witnessed in July. Lower costs fed through to lower manufacturing selling prices, which dropped for a third successive month and at the sharpest pace since September 2009.

While service sector input costs continued to rise at a rate well above the survey’s long-run average, buoyed in particular by upward wage pressures, the rate of increase slowed for a fifth consecutive month, edging down to the lowest since May 2021. Average prices charged for services also rose at a reduced pace, the rate of inflation at its lowest since October 2021.

The European Central Bank’s own bank lending survey does not provide an optimistic view of economic activity in the months ahead. With both credit standards tightening and demand for loans weakening, investment activity is set to weaken further. For the ECB, this will help to soften inflation pressures later on. The percentage of banks that are tightening credit standards is lower than in the first quarter, but overall the net percentage is still substantial at 14% compared to 27% between January and March. Risk perceptions are the main contributor to tightening standards at the moment.

Demand for borrowing is down further according to the survey and higher interest rates are an important contributor to the weakening demand for loans. This shows that the tightening effects from monetary policy are significant at the moment and will translate into weaker investment over the remainder of 2023. In this already weak economy in which growth has stagnated and recent indicators were weakening – the eurozone PMI for July indicated contraction – this has become a bigger point of debate for the ECB at the coming meetings to determine the end of the hike cycle.

Bank lending has weakened substantially since the start of ECB tightening, but it has been a gradual process so far. The bank lending survey continues to show significant tightening effects, but so far there has not been a cliff-edge effect on credit. While the ECB will take these results as a clear sign that the record hike cycle will have a substantial effect, we don’t expect it to influence Thursday’s rate decision too much. We expect the ECB to hike by 25bp in July.

JAPAN: Output continues to rise but new order growth slows sharply

China Sales Indexes Start Third Quarter Badly: Sharp falls in July in almost all China Indexes presage falling economic activity

The Sales Managers July Survey data reflects a further significant slowdown in economic growth. Covid related problems haven’t gone away completely: no less than 42 % of Chinese companies surveyed said they remained negatively impacted by Covid in one way or another, but the percentage is way down from the 55% recorded as recently as January.

China Sales Indexes Start Third Quarter Badly

The Manufacturing indexes continue to show bigger falls in activity than Services sector data.
Business Confidence is down sharply in the Manufacturing sector, and is now at its lowest point for almost 4 years.
The Manufacturing Sales Growth Index is at its lowest reading in over 3 years. And even the staffing Index, normally a lagging indicator, is at a 14 month low.
The Services sector did little better, with almost all indexes now below the 50 “no growth” level.
Consequently the all sector indexes did little to lift the rather gloomy picture spelt out by the seperate sector data.
Overall the Chinese economy, seemingly set earlier in the year on a rapid resumption of growth, now looks to have – at best – faltered in its ambitions.
Given the shrinking prospects for global growth in a world grown more suspicious of international trade, the absolute rate of growth achievable in the remainder of 2023 remains difficult to predict.

THE DAILY EDGE: 24 July 2023

Note: I am travelling for the next several weeks, impacting frequency and depth.

Knight-Swift Profit Plunges on Weak Trucking Demand The truckload carrier says it believes retailers are ‘in the late innings’ of their inventory destocking

Revenue dropped 21% to $1.55 billion, with revenue from its core truckload segment falling 15.5% to $829.4 million. Revenue from the freight brokerage logistics business fell 52%, driven by a 35% decline in loads from shippers. Analysts surveyed by FactSet had forecast revenue of $1.28 billion.

The company also saw operating expenses decline 10% to $1.46 billion in the period.

Chief Executive David Jackson said trucking demand has been hit by a destocking of excess inventories by retailers following a sharp buildup in 2022. “We believe we are in the late innings of inventory destocking and expect to see a normalization of imports and seasonality in coming quarters,” he said.

Phoenix-based Knight-Swift lowered its guidance for full-year earnings to a range from $2.10 to $2.30, down from previous guidance of $3.35 to $3.55. The new lower guidance includes a projected loss of 25 cents to 30 cents a share from U.S. Xpress, a truckload carrier Knight-Swift acquired earlier this year.

This merits 2 observations/comments:

  1. Are we in “the late innings of inventory destocking”? If we consider the inventory to sales ratio, we’re actually in overtime. Total businesses’ I/S is back below pre-pandemic levels. Only wholesalers’ I/S is still above. Unless Americans really tire of buying goods, destocking may have run its course.
  2. Ex U.S. Xpress, EPS are seen in the $2.45-2.60 range, down 25% from the previous guidance. As one serious analyst puts it: “with the stock up on the year and the 2023 EPS outlook now halved from January, the valuation doesn’t work, no matter what part of the cycle the TL market is
    currently in (interestingly, despite 4 consecutive guide downs, we still haven’t missed the opportunity for a downgrade, as the
    willingness to “buy the trough” in the shares was so strong all year).”

Th Cass Freight shipments index keeps slipping (-1.9% MoM s.a.) 18 months into its down cycle which Cass says typically last from 21 to 28 months.

Cass Freight Index Shipments June 2023

Cass says that “Freight markets continue to work through a downcycle” but reckon that “dynamics are shifting as real incomes improve and the worst of the destock is in the rearview.”

Americans in Their Prime Flood Into the Job Market The share of people between 25 and 54 either working or seeking jobs rose this year to the highest level since 2002.

(…) Prime-age workers now exceed prepandemic levels by almost 2.2 million.

The resurgence of midcareer workers is driven by women taking jobs.

The labor-force participation rate for prime-age women was the highest on record, 77.8% in June. That is well up from 73.5% in April 2020.

Men, however, tend to be employed at higher rates. The overall prime-age participation rate rose in June to 83.5%, the highest since 2002.

Women aren’t having as many children—there were about 3.66 million births in 2022, 655,000 fewer than the peak in 2007—so child-care responsibilities have decreased.

Julia Pollak, chief economist at ZipRecruiter, said it is possible for women’s participation to rise further if employers adopt or the government requires additional family-friendly policies. U.S. female participation lags behind that of other industrialized economies in part because of the cost of child care, which is subsidized elsewhere. (…)

Actually, women just got back to their pre-pandemic level while men are 2.6% above.

fredgraph - 2023-07-22T061425.461

image

High Rates, Low Supply Hinder Home Buying This Summer

Existing home sales, which make up most of the housing market, decreased 3.3% in June from the prior month to a seasonally adjusted annual rate of 4.16 million, the National Association of Realtors said Thursday. That was the slowest sales pace since January. June sales fell 18.9% from a year earlier.

The national median existing-home price fell 0.9% in June from a year earlier to $410,200, the second-highest level on record in data going back to 1999, NAR said. (…)

New homes accounted for nearly one-third of single-family homes for sale nationwide in May, compared with a historical norm of 10% to 20%. (…)

Nationally, there were 1.08 million homes for sale or under contract at the end of June, unchanged from May and down 13.6% from June 2022, NAR said. (…)

The number of new listings in June fell 26% from a year earlier, according to Realtor.com.

Big Regional Banks Reported Stable Deposits—Great News for Investors Shares of Citizens Financial, U.S. Bancorp and KeyCorp are up this week.

Many banks, including KeyCorp, Western Alliance Bancorp and Zions Bancorp, posted sharp profit declines. But their deposits were stable or higher compared with the first quarter, a relief after customers yanked their money earlier this year across the industry. Other regional lenders including Citizens Financial Group and M&T also posted higher deposits over the quarter. (…)

The KBW Nasdaq Bank Index added more than 6% this week, and the KBW Nasdaq Regional Banking Index climbed by even more. (…)

Profit fell short of Wall Street estimates at many regional banks in the second quarter—even powerhouses like Truist Financial, Fifth Third Bancorp and U.S. Bank. Giant counterparts JPMorgan Chase and Wells Fargo, meanwhile, beat expectations and posted blockbuster profit increases in the process.

The declines were especially sharp at some regional banks whose deposits have proved more flighty, with year-over-year profit sliding 17% at Western Alliance and 14% at Zions. (…)

A number of regional banks dimmed their profit forecasts for the year. Many have started to hoard more cash rather than using it to make new loans, as they brace for potential new regulations. (…)

Banks have already started to take hits on these loans, especially office properties that have lost value since the pandemic, or they have stashed away money for future losses they expect. Even the vaunted Goldman Sachs took a big second-quarter write-down on its real estate holdings, much of it tied to office properties.

M&T said net charge-offs more than doubled from a year earlier to $127 million, driven by several office buildings in New York City and Washington, D.C., as well as a large healthcare company in New York state. At PNC Financial Services, net charge-offs for commercial real-estate loans jumped to $87 million, from $10 million in the previous quarter and $4 million a year earlier.

From the economy’s viewpoint, it is best to focus on credit. Since the first week of April, right after SVB, total loans and leases are down $26B. Outside of recessions, the pandemic and the immediate post GFC crisis (2010-11), this is the worst credit contraction ever. If this is a demand problem, the economy must be contracting. If this is a supply problem, the economy could be about to contract.

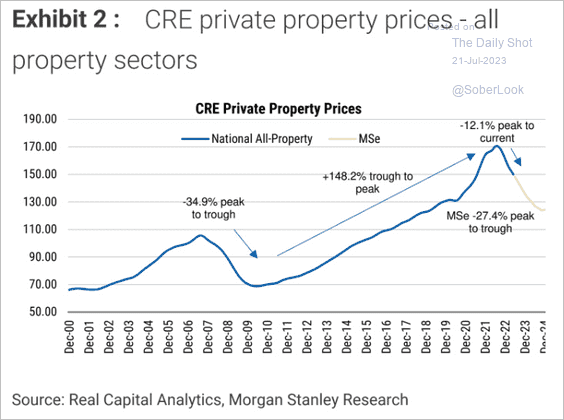
  • Commercial property prices are headed lower. (The Daily Shot)

Source: Morgan Stanley Research; @dailychartbook

With the return to office seemingly plateauing at about 50 percent occupancy, the long-term impact of remote work on New York’s office values looks even more dire than previously thought.

That’s according to an update from researchers at New York University and Columbia University, who revised a study they released last year measuring the effect of work-from-home on New York City’s office stock.

The update, published in May, now calculates that the city’s offices as a whole will lose 44 percent of their pre-pandemic value by 2029 — up from the estimated 28 percent when the authors first published the study a year ago.

“We now estimate a more persistent work-from-home regime, which has more of an impairment of office values even in the long run,” NYU’s Arpit Gupta, one of the authors, wrote in an email. (…)

New York’s office buildings saw a notable uptick in physical occupancy after Labor Day last year, hitting nearly 47 percent. But that seems to have been somewhat of a ceiling. As of May, occupancy was slightly higher than 48 percent. (…)

New York’s office buildings saw a notable uptick in physical occupancy after Labor Day last year, hitting nearly 47 percent. But that seems to have been somewhat of a ceiling. As of May, occupancy was slightly higher than 48 percent. (…)

(…) rising borrowing costs led AmEx to raise its provisions for credit losses to $1.2 billion from $410 million a year ago as it braced for potential defaults in debt repayments. (…)

EARNINGS WATCH

From Refinitiv:

Through July. 21, 89 companies in the S&P 500 Index have reported earnings for Q2 2023. Of these companies, 73.0% reported earnings above analyst expectations and 19.1% reported earnings below analyst expectations. In a typical quarter (since 1994), 66% of companies beat estimates and 20% miss estimates. Over the past four quarters, 73% of companies beat the estimates and 22% missed estimates.

In aggregate, companies are reporting earnings that are 7.4% above estimates, which compares to a long-term (since 1994) average surprise factor of 4.1% and the average surprise factor over the prior four quarters of 4.2%.

Of these companies, 60.7% reported revenue above analyst expectations and 39.3% reported revenue below analyst expectations. In a typical quarter (since 2002), 62% of companies beat estimates and 38% miss estimates. Over the past four quarters, 71% of companies beat the estimates and 29% missed estimates.

In aggregate, companies are reporting revenues that are 1.5% above estimates, which compares to a long-term (since 2002) average surprise factor of 1.3% and the average surprise factor over the prior four quarters of 2.2%.

The estimated earnings growth rate for the S&P 500 for 23Q2 is -7.9%. If the energy sector is excluded, the growth rate improves to -2.2%.

The estimated earnings growth rate for the S&P 500 for 23Q3 is 0.8%. If the energy sector is excluded, the growth rate improves to 6.7%.

The estimated revenue growth rate for the S&P 500 for 23Q2 is -0.8%. If the energy sector is excluded, the growth rate improves to 3.0%.

image

Trailing EPS are now $213.99, down 2.7% from the end of June. Full year 2023: $217.46e. Forward: $229.94e, up 2.0% from the end of June. 2024e: $244.59

GS

  • There has been almost a 3 standard deviation move in bearish responses to the AAII + II surveys from one of the highest readings on record last year to now the lowest since the heights of the pandemic liquidity frenzy. (Callum Thomas)

  • Indeed, the seasonal tendency is for higher volatility around this time of the year; climaxing around October. With sentiment increasingly frothy, valuations back to expensive levels, and still murky macro, the path higher may not be as smooth or simple as it seems. (Callum Thomas)
  • Valuations by Market Cap Range

Source: @nategeraci

  • From Ed Yardeni:

image

image