Payrolls Data Showing Solid Wage Growth Keeps Fed on Track to Hike Rates
- Payrolls climbed by 209,000 in June, below economists’ forecasts but still rising at a healthy clip. The unemployment rate fell to 3.6%. Average hourly earnings rose 4.4% on a year-over-year basis, up from a 4.3% pace in May.
- The relatively strong job gains, coupled with the re-acceleration of wages and the drop in unemployment cements the case for a Fed hike this month and will add to the conversation about more tightening being needed later this year. This is a labor market that’s still very tight.
- Most industries added jobs, with health care and government driving gains. The leisure and hospitality industry added a meager 21,000 jobs, while construction employment rose by 23,000.
- Services accounted for more than half of new hiring in June with 120,000 new jobs. Manufacturing added about 7,000 new jobs. Government jobs made up more than a quarter of new hiring in June, up from 18% between January and May.
Last week, I wondered how long can the manufacturing recession last before it begins to also meaningfully impact services, noting that, in 2007-08, aggregate hours worked in manufacturing declined 3.6% before services peaked.
June data and revisions to previous months show that manufacturing hours worked have stabilized since April and are down only 1.0% since their January peak.
Aggregate Hours Worked, Manufacturing & Services

The chart below covers the 15 months of Fed tightening. The monthly growth in goods-producing jobs (black), which include construction and manufacturing, dropped from +68k on average during the first 5 months on the chart to +15k during the last 5. During the 5 months prior to each of the last 3 recessions, including the mild 1990 recession, goods-producing jobs declined an average of 50k per month before dragging service-producing jobs down.

The lags are still lagging. It’s getting very late for a second half recession, even for one in 1H’24.
Seeking to tame demand, 500bps of tightening have yet to show any meaningful effect.
From the FOMC’s viewpoint, the June labor data were the strongest since January. Jobs growth slowed to 1.6% a.r. but hours worked rose and wages are not decelerating. In fact, Q2 wages rose at a 4.3% annualized rate, up from 3.9% in Q1.

Aggregate weekly payrolls (employment x hours x wages) rose 6.3% YoY in June, in line with the average of the previous 3 months. Real payroll income keeps rising given PCE inflation averaging 4.0% YoY in April and May.

On a MoM basis, aggregate payrolls jumped 0.8% in June after +0.3% in May and 0.5% in April. For Q2: +1.1% or 4.5% annualized, down from 1.6% or 6.5% annualized. Personal expenditures should grow similarly per the chart above.
Given headline inflation at +2.3% annualized in the last 3 months, thanks to surprisingly weak energy prices, real expenditures should keep growing, sustaining overall demand and core inflation.
Since March 2022, while the Fed funds rate skyrocketed 500bps, oil and natural gas prices cratered 35% and 48% respectively, freeing up a lot of discretionary income, unusually counteracting the Fed’s monetary policy.
For the FOMC, the unexpected result is that real consumer demand is sustained by rapidly slowing headline inflation, counteracting its very restrictive policy, and keeping the targeted core inflation rates much higher than what the normal playbook dictated.
While headline inflation is receding (+2.3% a.r. in the last 3 months), the Cleveland Fed’s Inflation Nowcasting model, through July 7, is forecasting core CPI up 0.42% (+5.1% a.r.) in July and core PCE up 0.36% (+4.4% a.r.), same pace as June’s.

The “good news” is that this unlucky (!) Fed, juggling with so many erratic balls, is not slowing demand enough to bring core inflation down to its target.
The “bad news” is that this totally focused Fed could well keep hiking until the bite is strong enough. Hopefully, it won’t get unlucky again and see those volatile energy prices “unexpectedly” spike back up…
And there’s this other known unknown explained by the Fed staff on June 23::
In Figure 2, we present our estimates for the accumulated stock of excess savings. Broadly speaking, advanced economies have followed a similar hump-shaped path so far, with a large increase in excess savings in 2020 and parts of 2021, followed by a decrease in the stock of excess savings which reflects a period of below-trend savings rates as households use their accumulated buffer to fuel consumption.
That said, we note that the United States’ path differs slightly from other countries, as its stock of excess savings increased more rapidly, peaking in 2021Q3, and then decreased more quickly.
As a result, its excess savings stock, at least computed according to our method, is currently completely depleted, which contrasts with other advanced economies where households still hold a buffer of excess savings of about 3 to 5 percent of GDP. Given the more rapid drawdown of excess savings, aggregate demand in the United States is likely to have been supported more than in other countries over the past year. (…)
Absent any further shocks to disposable income or savings behavior, our analysis suggests that the accumulated average AFE [Advanced Foreign Economies] excess savings should be unwound by the end of the year.

Also, this known known: Student loan cliff ahead
The Supreme Court’s decision to overturn the Biden plan on student loan forgiveness complicates an already tricky situation for the U.S. economy.
The coming student loan cliff is the latest in a string of withdrawals of pandemic-era supports. These include the end of both stimulus checks and child care tax credits, as well as the pullback on SNAP benefits and Medicaid supports.
Overall, the resumption of student loan payments will pull $70 billion a year out of the economy, according to an estimate from Moody’s Analytics. The spending reduction will be about 0.4%, Moody’s estimates. (Axios)
Canada: Job Growth Remains Firm
- Employment increased by 60k in June, above expectations (+21k) and largely driven by job gains in the services-producing sector.
- Employment increased by 50k in the services-producing sector and by 10k in the goods-producing sector.
- The unemployment rate ticked up to 5.4%, above consensus expectations.
- Year-over-year wage growth ticked down 1.2pp to +3.9% in June and sequential wage growth was also soft. Three-month annualized wage growth declined to +2.4% (+3.4% in May) and MoM wage growth was essentially flat.
- GS:
The improved data raises some risk of a hold at this week’s July meeting, but we expect the BoC will deliver another 25bp hike. The accumulated evidence from 2023H1 suggests that activity remains too firm, progress on the BoC’s preferred sequential core inflation measures has stalled out, and the continued rebound in house prices raises the risk of a pickup in shelter inflation. We therefore expect that the BoC will decide further tightening is necessary.
Beyond July, we expect that the BoC will follow a meeting-by-meeting approach to policy and maintain our forecast that the cycle will end this week with a 5% terminal rate. However, we see policy risks as skewed toward further tightening. Despite having made more inflation progress than other DMs, the BoC seems relatively more determined to return inflation to 2%. Firmer than expected activity or inflation data—particularly if the shelter inflation outlook continues to worsen or the disinflationary core goods impulse fades sooner than expected—could therefore easily push the BoC to hike again before end-2023.
Progress on the BoC’s Preferred Sequential Core Measures Has Stalled Since the End of Last Year

China on brink of consumer deflation Latest signs of economic weakness likely to spur calls for government stimulus measures
- Deflation Looms in China as Rebound Loses Steam China’s consumer inflation flatlined in June after two months of meager growth, while factory-gate prices fell at their fastest pace in more than seven years.
(…) Consumer prices didn’t budge in June from a year earlier, after growing 0.2% in May and 0.1% in April. The reading is the weakest since February 2021 and undershot a 0.2% increase anticipated by economists surveyed by The Wall Street Journal.
Stripping out the more volatile food and energy prices, core inflation in China decelerated from 0.6% in May to 0.4% in June, reflecting sluggish demand for goods and services.
China’s producer prices index, a gauge of prices charged by manufacturers, fell 5.4% from a year earlier in June, the weakest reading since December 2015 and marks the ninth straight month of year-over-year declines. (…)
In truth, China’s headline CPI stalled from a high base last year. On a MoM basis, total CPI rose 1.4% annualized in June after +2.6% in May.
But China continues to suffer from stalled goods consumption in the U.S.. Per Goldman numbers, core goods inflation was -0.8% YoY in June after -0.2% in May. Inflation in services fell to +0.7% YoY in June after +0.9% in May. On a MoM basis, services CPI inflation edged up from 0.1% a.r. in May to 0.3% in June.
China’s shipments to the U.S. dropped 8.5% YoY in the first five months of 2023, down 12.2% in May (-18% in USD terms).
Axios says that “Both as a percentage of total imports and as a percentage of GDP, Chinese imports are now at the lowest they’ve been in 20 years.

- Mind The Gap! Shein’s tariff arbitrage (Axios)
Not all Chinese imports get registered as imports. Specifically, if a shipment falls beneath a certain “de minimis” value, it neither gets inspected nor taxed by U.S. Customs. That de minimis value is $800 — high enough to cover effectively all of the shipments from Chinese fast-fashion giants Shein and Temu.
“The de minimis provision is foundational to Shein and Temu’s business models,” finds a House of Representatives report into the companies. Shein and Temu between them ship about 600,000 packages per day to the U.S. under the de minimis exception.
The Gap, a company that sources clothing in China and ships it in bulk, paid about $700 million in import duties in 2022. Shein and Temu, by contrast, paid nothing.
If Shein does decide to go public in the U.S., possible changes to the de minimis rule will be very high up on its list of risk factors.
Meanwhile, compounding the problem(s), the Chinese real estate dominos are finally crumbling as ADG explains:
(…) June residential property sales tumbled by 18% sequentially and 42% from their year-ago levels, according to estimates from Raymond Cheng, managing director of CGS-CIMB Securities in Hong Kong. “The numbers are really bad,” Cheng told the South China Morning Post, noting that June typically represents one of the busier months of the year. Nationwide transactions will decline 5% across the full year per guesstimates from S&P Global, following the 28% drop logged in 2022.
Bourgeoning inventories complement that slowdown, as home listings across 13 major cities expanded by 25% over the first five months of the year, according to E-house China Research and Development Institutions, with supply in Shanghai and Wuhan vaulting by 82% and 72%, respectively. “The real situation is a bit worse than what was expected,” China Vanke, the Middle Kingdom’s second largest property firm by sales, warned at a shareholder meeting Friday.
A busted land auction in China’s tech hub underscores the grim backdrop for real estate developers. Shimao Group Holdings came up empty in efforts to find a buyer for a $1.8 billion Shenzhen, Guangdong Province project today, despite offering the portfolio at a 20% discount to its appraised value, Bloomberg reports, citing data from JD.com. Shimao, which defaulted on $1 billion worth of dollar bonds last year, shelled out $3.3 billion for the gargantuan lot back in 2017, initially planning to erect a 500-meter skyscraper before the project went pear shaped. (…)
As the property market remains in the dumps, financial breathing room is in short supply. Thus, off-balance sheet borrowings among the LGFV [local government financing vehicles] category topped $9 trillion as of Dec. 31, estimates the International Monetary Fund, up 65% from three years earlier and equivalent to more than half the nation’s nominal GDP for 2022. For context, total U.S. state and local government debt stands at about $3.2 trillion. Meanwhile, cash positions among a sample of 2,892 LGFVs collected by the Rhodium Group last month collectively fell 10.3% on an annual basis, marking the first such decline in five years.
State owned banks are turning to a time-worn remedy in response. Bloomberg relays that lenders such as China Construction Bank and Industrial & Commercial Bank of China are increasingly opting to amend and extend (or is that extend and pretend?), offering financing to “qualified” LGFV’s with 25-year maturity schedules, rather than the decade long borrowing terms typically extended to high quality corporate borrowers. What’s more, some of those loans include waivers on interest or principal repayments during the first four years, reportedly reflecting lenders’ confidence “that local authorities will not let any of [the LGFV’s] fail.”
The 25% jump in listings suggests that many Chinese owners are moving off the sidelines and capitulating. That could be ugly.
EARNINGS WATCH
The Q2 earnings season starts this week but we already got 18 early reporters in with a beat rate of 78% and a surprise factor of +5.5%, even though their earnings dropped 21.4% YoY on flat revenues.
Corporate America must also be positively impacted by lower energy costs. In Q2, average WTI and natural gas prices are down 32% and 71% YoY respectively.
Q2 earnings are seen down 6.4%, slightly worse than on July 1.

Earnings pre-announcements have ben much better than at the same time after Q1:

Trailing EPS are now $215.07. Full year 2023: $219.14e. 12-m forward: $230.26. Full year 2024: $244.88.

The Rule of 20 P/E is behaving like in 2001 when the R20 P/E uncharacteristically did not fall back to the “20” fair value area but bounced back up. That was not because of a rising market, rather earnings falling faster than equities, right in the recession and an aggressively easing Fed.
The conventional P/E ratio is 19.1x forward EPS. We’ve been there before but not very often…

- NDR: “Additional rate hikes would reemphasize a challenge the market has not faced since before the financial crisis: cash is a reasonable alternative to equities. The S&P 500 GAAP earnings yield is below the T-bill yield for the first time since 2001 (chart, left). Earnings growth may need to accelerate more than analysts are suggesting for investors to justify reallocating into equities.”

Stock Market Short Sellers That Helped Fuel This Year’s Rally Are Finally Giving Up
(…) Shifting sentiment can be seen in data showing bearish positions in exchange-traded funds slipped to three-year lows while shorts in S&P 500 futures were unwound at the fastest pace since 2020. Meanwhile, the population of optimists is exploding, with bullish newsletter writers in Investors Intelligence survey outstripping bearish ones by 3-to-1, the highest level since late 2022. (…)
Large speculators, mostly hedge funds that saw their net short positions in S&P 500 swell to a record at the end of May, were busy unwinding bets in the following four weeks. Their bearish holdings fell by 226,000 contracts over the stretch, the largest drop since mid-2020, according to data from the Commodity Futures Trading Commission compiled by Bloomberg.
Among newsletter writers tracked by Investors Intelligence, those classified as bullish rose to 54.9% while the proportion of bears fell to 18.3%. That’s in stark contrast from the end of last year, when bears exceeded bulls. (…)
Source: Yardeni Research
In ETFs, short interest is near a three-year low based on its percentage of market value, according to Markit data compiled by Morgan Stanley’s sales and trading team. Short interest in individual companies — while not dissipating completely — has sunk back toward median levels across most industries. (…)


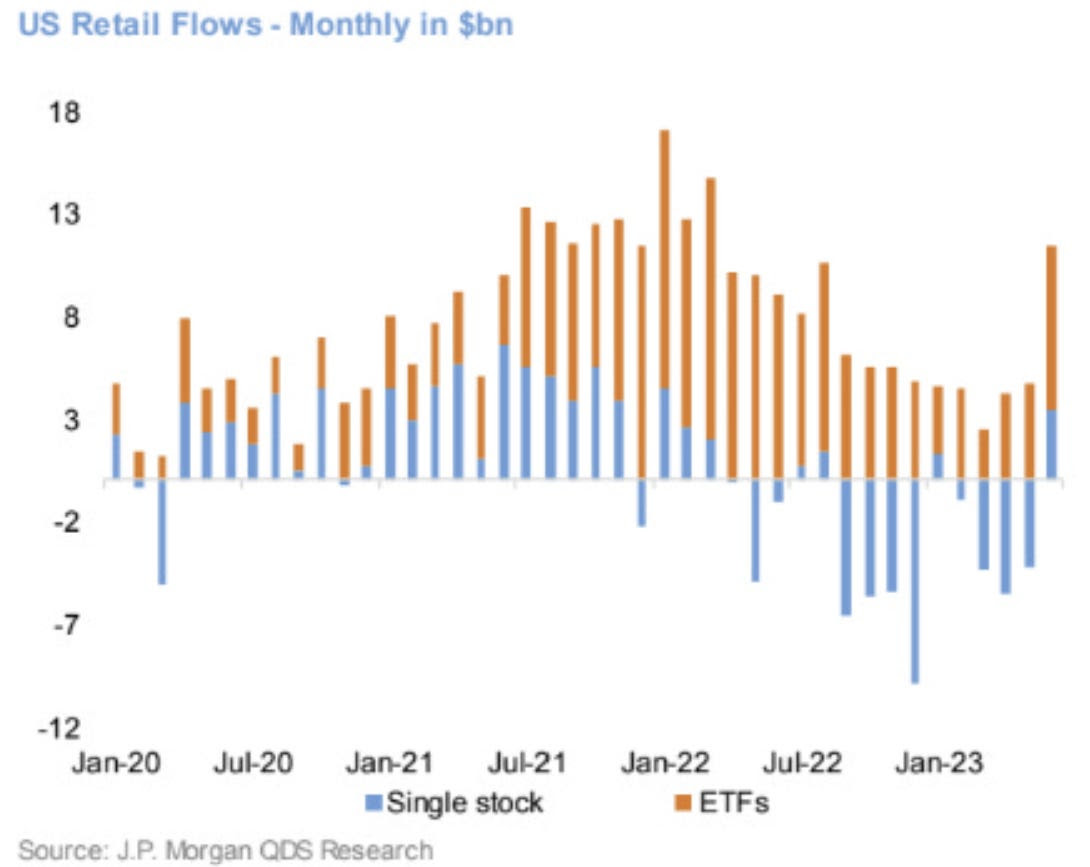
- Retail Flows:
Source: Daily Chartbook
- How much are you willing to pay for tech? Great chart via Soc Gen’s Edwards showing the latest tech PE expansion vs trailing EPS. AI is great, but what price are you willing to pay to own the hype? (The Market Ear)

Soc Gen
El Nino! Sea temp headed for record

Data: Climate Reanalyzer. (Average reflects 1982-2011 mean). Chart: Rahul Mukherjee and Simran Parwani/Axios
The globe set or tied four daily heat records last week (Monday-Thursday), and had six straight days (and counting!) with global average surface temperatures exceeding 17°C (62.6°F). That hasn’t happened since such data began in 1940 — and likely not for many centuries before that, Axios’ Andrew Freedman reports.
The seas take in about 90% of the excess heat trapped by greenhouse gasses. So global water temperatures are also hitting all-time milestones. A strengthening El Niño in the Pacific Ocean is adding extra heat — and is likely to yield a record warmest year in 2023 and 2024.
The U.S. this week will endure an intensifying, long-duration heat wave extending from Arizona and New Mexico to southwestern Texas. A heat wave will also keep going in Florida. Numerous daily — plus some monthly, and even all-time records — may be broken.


