Empire State Manufacturing Survey
Business activity increased in New York State for the first time in five months, according to firms responding to the April 2023 Empire State Manufacturing Survey. The headline general business conditions index shot up thirty-five points to 10.8. New orders and shipments surged. Delivery times held steady, and inventories moved higher.
Despite the increase in activity, both employment and hours worked declined for a third consecutive month. Input price increases moderated, while selling prices increased at the same pace as last month. Looking ahead, businesses continued to expect little improvement in conditions over the next six months.


McKinsey, Bain Delay Some M.B.A. Start Dates to 2024 Top consulting firms say job offers are secure, but start dates are getting pushed back; EY cuts 3,000 workers in the U.S.
(…) Consulting firms are among the biggest recruiters of business-school talent. Delaying the start dates for so many fresh grads is causing anxiety on campuses and suggests these businesses may have wider concerns about the economy. (…)
On Monday, Ernst & Young LLP, the accounting and consulting firm, said it would cut about 3,000 U.S. employees, or less than 5% of its workforce, after assessing current economic conditions. KPMG LLP said in February that it would lay off several hundred people in its consulting division in February, according to a spokesman. (…)
- Accenture Is Delaying New-Hire Starts on Top of Job Cuts The professional-services giant is slowing hiring of recent graduates after slashing 19,000 jobs.
- Amazon Warns of Weaker Cloud Sales as Businesses Cut Spending
All related. Widespread cost cutting amid slowing demand:

Brookfield Default on DC Office Buildings Is Industry’s Latest The rise of remote work creates uncertainty in the industry.
Brookfield Corp. funds have defaulted on a $161.4 million mortgage for a dozen office buildings, mostly around Washington, DC, as rising vacancies hit property values.
(…) prices on office properties falling about 25% in the past year, according to Green Street. In the Washington metro area, office property values have plunged 36% through March from a year earlier, according to the Green Street index.
Brookfield, a major office owner, previously defaulted on debt tied to two Los Angeles buildings, the Gas Company Tower and the 777 Tower. Landlords including Columbia Property Trust, owned by funds managed by Pacific Investment Management Co., and a venture started by WeWork Inc. and Rhone Group have also defaulted on office debt.
“We have always focused on quality, so 95% of what we own are trophy and Class A buildings that continue to see strong demand globally and benefit from the flight to quality,” Brookfield spokesperson Kerrie McHugh said in an emailed statement. “While the pandemic has posed challenges to traditional office in some parts of the US market, this represents a very small percentage of our portfolio.” (…)
- Howard Marks on CRE loans
Total U.S. bank assets exceed $23 trillion. Banks collectively are the biggest real estate lenders, and while we only have rough ranges for the data, they’re estimated to hold about 40% of the $4.5 trillion of CRE mortgages outstanding, or around $1.8 trillion at face value. Based on these estimates, CRE loans represent approximately 8-9% of the average bank’s assets, a percentage that is significant but not overwhelming. (Total exposure to CRE may be higher, however, as any investments in commercial mortgage-backed securities have to be considered in addition to banks’ holdings of direct CRE loans.)
However, CRE loans aren’t spread evenly among banks: Some banks concentrate on parts of the country where real estate markets were “hotter” and thus could see bigger percentage declines; some loaned against lower-quality properties, which is where the biggest problems are likely to show up; some provided mortgages at higher loan-to-value ratios; and some have a higher percentage of their assets in CRE loans. To this latter point, a recent report from Bank of America indicates that average CRE loan exposure is just 4.5% of total assets at banks with more than $250 billion of assets, while it’s 11.4% at banks with less than $250 billion of assets.
Since banks are so highly levered, with collective equity capital of just $2.2 trillion (roughly 9% of total assets), the estimated amount the average bank has in CRE loans is equal to approximately 100% of its capital. Thus, losses on CRE mortgages in the average loan book could wipe out an equivalent percentage of the average bank’s capital, leaving the bank undercapitalized. As the BofA report notes, the average large bank has 50% of its risk-based capital in CRE loans, while for smaller banks that figure is 167%.
Notable defaults on office building mortgages and other CRE loans are highly likely to occur. Some already have. But that doesn’t necessarily mean the banks involved will suffer losses. If loans were made at reasonable LTV ratios, there could be enough owners’ equity beneath each mortgage to absorb losses before the banks’ loans are jeopardized. Further, mortgage defaults generally don’t signal the end of the story, but rather the beginning of negotiations between lenders and landlords. In many cases, the result is likely to be extension of the loan on restructured terms.
No one knows whether banks will suffer losses on their commercial real estate loans, or what the magnitude will be. But we’re very likely to see mortgage defaults in the headlines, and at a minimum, this may spook lenders, throw sand into the gears of the financing and refinancing processes, and further contribute to a sense of heightened risk. Developments along these lines certainly have the potential to add to whatever additional distress materializes in the months ahead.
Bankers said (The Transcript and others):
- “I wouldn’t use the word credit crunch if I were you. Obviously, there’s going to be a little bit of tightening. And most of that will be around certain real estate things. You’ve heard it from real estate investors already. So I just look at that as a kind of a thumb on the scale. It just means the finance conditions will be a little bit tighter and increases the odds of a recession. That’s what that is. It’s not like a credit crunch. (…) “We expect the second quarter and the rest of the year to remain challenging.”” – JPMorgan Chase ($JPM ) CEO Jamie Dimon
- Customer activity is still relatively strong” – Wells Fargo ($WFC ) CFO Michael Santomassimo
- “I don’t quite believe it. So the rate curve — the Fed has the rate curve — forward short-term rate curve, almost 1% higher than what the market has…So there is a risk of higher rates for longer. And don’t just think of just the Fed funds rate because I think you should — for our planning, I’d be thinking more about, it could be 6 and don’t — and then think about the 5- and 10-year rate, which could be 5. And I think if those things happen, I’m not saying they’re going to happen. I just think people should prepare for them.” – JPMorgan Chase ($JPM ) CEO Jamie Dimon
- “…the part of the issue that we face here is you have an interest rate forward curve that’s suggesting cuts out there…We kind of think the Fed’s going to hold through the year and cut next year. Personally, I think they might hold longer than that.” – PNC Financial Services Group ($PNC ) CEO William Demchak
Schwab, State Street Customers Take Out Billions in Deposits Banks across the board are under pressure to pay depositors more as interest rates continue to rise.
At Schwab, the brokerage giant, deposits fell 11% to $326 billion from the previous quarter and were down 30% from a year earlier. State Street, one of the largest custody banks, said Monday that deposits totaled about $224 billion at the end of the first quarter, down 5% from December and 11% from a year ago.
All told, $41 billion in deposits left Schwab during the first three months of the year, and $11.8 billion left State Street. (…)
State Street’s net interest income fell 3% from the December quarter, surprising investors who had heard State Street executives predict in early March that interest income would be little changed in the first quarter. (…)
The bank’s executives said Monday that net interest income would slip another 5% to 10% in the second quarter as customers shifted noninterest-bearing deposits into those that pay interest—or put their cash in other alternatives. (…)
Schwab executives have said customers’ shift from deposits to higher-yielding investments slowed as the first quarter wore on. (…)
- Apple Makes the iPhone a Home for Savings Accounts Apple Card holders can open an account with a 4.15% annual percentage yield.
(…) The high-yield savings accounts, available in conjunction with Apple’s credit card, are one of the tech company’s latest steps into the financial-services space, which also include an option to allow customers to “buy now, pay later” on certain of its hardware products.
The company partnered with Goldman Sachs to offer consumers those options, part of Apple’s effort to transform the iPhone into a digital wallet that can help keep consumers linked to the software ecosystem behind its devices. (…)
- Americans Using Buy Now, Pay Later for Groceries Risk ‘Cycle of Debt’ With inflation squeezing budgets, more consumers are turning to instant credit apps to make ends meet.
(…) Almost half of Americans have used BNPL apps, and about 1 in 5 rely on them to buy groceries, according to a recent survey from LendingTree Inc. Some 27% use the loans as a bridge to their next paycheck.
The BNPL business surged during the pandemic—five of the main lenders in the US originated loans worth $24.2 billion in 2021, up from $2 billion in 2019, according to the Consumer Financial Protection Bureau (CFPB). The model typically allows buyers to spread payments out evenly without accruing interest, making it an attractive alternative to credit cards, with US interest rates at their highest level since 2007. (…)
BNPL can be the last option to tide consumers over after other financing choices are exhausted, or the only viable route for those unable to gain access to traditional credit. (…)
A $400 purchase can snowball if consumers don’t fully budget for upcoming payments. Marco Di Maggio, an economist at Harvard Business School who has studied BNPL, says such programs may encourage shoppers to spend more at checkout. “They tend to see it as a $100 purchase, and they forget about the other $300—that’s what puts them in trouble,” he says. (…)
A March 2, 2023 research by the Consumer Financial Protection Bureau found that:
Sixty-nine percent of BNPL borrowers were revolving on at least one credit card at the time of the survey, meaning that they carried over a credit card balance from one billing cycle to the next. For credit card revolvers, the interest rate starts immediately for a purchase, so even for a six-week, pay-in-four purchase, credit cards are much more expensive than a zero-interest BNPL loan.
BNPL borrowers therefore may choose zero-interest BNPL financing over revolving on a credit card with relatively high interest that compounds over time. For non-revolvers, the proposition of BNPL is generally at most a two-week, interest-free extension on the deadline for repayment, as non-revolvers do not begin paying interest until the end of the grace period, which is typically a billing cycle.
BNPL financing may be particularly attractive to consumers with lower credit scores because the alternative average percentage rate (APR) interest on credit card debt is particularly high for this group compared to consumers with higher credit scores.
And concluded:
BNPL borrowers were, on average, much more likely to be highly indebted, revolve on their credit cards, have delinquencies in traditional credit products and use high-interest financial services such as payday, pawn, and overdraft compared to non-BNPL borrowers. They are more likely to also have traditional credit products like credit and retail cards, personal loans, and student loans, but have lower liquidity and savings compared to non-BNPL borrowers. However, markers of financial distress were apparent for these consumers even prior to the widespread usage of BNPL starting in 2019.
An important question for future research is whether BNPL improves the financial health of consumers in distress or exacerbates these differences.
Total bankruptcy filings in January shot up 19% in January to 31,087, up 19% from a year ago, according to data from Epiq, a legal research firm. The number of Americans who filed for bankruptcy across Chapters 7, 11 and 13 shot up 20% in January from a year ago.
 (S&P Global)
Speaking of bankruptcies, Goldman warns that
The Debt Limit: The Deadline Could Be Sooner Than Expected.
While the data are still very preliminary, weak tax collections so far in April suggest an increased probability that the debt limit deadline will be reached in the first half of June. We have been projecting that Treasury could operate without a debt limit increase until early August.
A June deadline would raise the possibility of a short-term extension. We are generally skeptical of reports that congressional Republicans might pass a short-term debt limit extension, as voting to raise the debt limit twice is harder than voting once. That said, if the Treasury announces in May that the deadline is only a few weeks away, there would be little time to negotiate a deal and a short-term extension could provide a way out. While not our base case, a June deadline would make a short-term extension a plausible scenario.
China’s Economy Rebounds After Covid Isolation The rebound in the first three months of the year tees up a revival in growth that is expected to buoy the global economy.
China’s economy expanded 4.5% in the first quarter of the year compared with the same three months a year earlier, China’s National Bureau of Statistics said Tuesday, a better performance than the 4.0% pace expected by economists polled by The Wall Street Journal.
Compared with the previous quarter, when China was hit by a wave of Covid infections after the abrupt end to its zero-tolerance Covid policies in December, the economy expanded 2.2%. (..)
China’s headline measure of joblessness, the surveyed urban unemployment rate, fell to 5.3% in March, from 5.6% in February. But youth unemployment rose for a third straight month, with joblessness among those aged 16 to 24 rising to 19.6%, from 18.1% in February.
Separately, Tuesday’s data showed retail sales in China rose 10.6% in March compared with a year earlier, handily topping expectations, while industrial production rose 3.9%, falling short of projections.
Exports also rose, aided by a surprise resurgence in goods shipments in March. Data last week showed resilient demand for Chinese products from Southeast Asia and Russia. Exports to Russia more than doubled in March from a year earlier, highlighting deepening economic ties between the two like-minded neighbors.
Meanwhile, investment in buildings, machinery and other fixed assets declined 0.3% in March from the previous month, hurt by weakness in real estate, China’s statistics bureau said Tuesday. For the first quarter as a whole, real-estate investment fell 5.8% compared with the same period a year earlier.
New construction starts by real-estate companies fell 19.2% in the first three months of the year, accelerating from the 9.4% decline in the first two months of the year.
(…) Still, the March data showed China’s recovery from 2022 — when Covid lockdowns and a property slump dragged GDP growth down to the second-weakest pace since the 1970s — will be gradual rather than “V-shaped.”
Growth in industrial output remains below pre-pandemic rates, while property investment continued to contract, even though housing sales have started to expand again. Weak real estate construction was to some extent offset by a surge in infrastructure investment led by state-owned companies.
The jobs market and wage growth also haven’t returned to normal. Incomes of urban residents grew just 2.7% in inflation-adjusted terms during the first quarter from a year earlier, well below growth rates above 5% in pre-pandemic years. The youth unemployment rate climbed close to a record, while the nationwide urban jobless rate remained elevated. (…)
The production of micro computer equipment fell 22% and integrated circuit output also slumped, adding to evidence of a broader slowdown in the electronic supply chain in East Asia that has hit South Korea’s exports. (…)

Investors Most Underweight Stocks Versus Bonds Since 2009, BofA Says Worries about a recession are taking hold, the latest fund manager survey found.
In the most bearish survey of this year — the first after banking turmoil roiled markets last month — investors indicated that fears of a credit crunch had driven up bond allocation to a net 10% overweight — the highest since March 2009. A net 63% of participants now expect a weaker economy, the most pessimistic reading since December 2022.
Still, the bearish turn in sentiment is a contrarian signal for risk assets, strategist Michael Hartnett wrote in the note. If “consensus lust for recession” isn’t satisfied in the second quarter, the “pain trade” would be a rally in bond yields and bank stocks, he said. Hartnett was correctly bearish through last year, warning that growth fears would fuel a stock exodus. (…)
- Cash allocation has remained above 5% for 17 consecutive months — second only to the 32-month dot-com bear market
- A net 49% of investors expect IG bonds to outperform HY bonds over the next 12 months — the most on record (…)


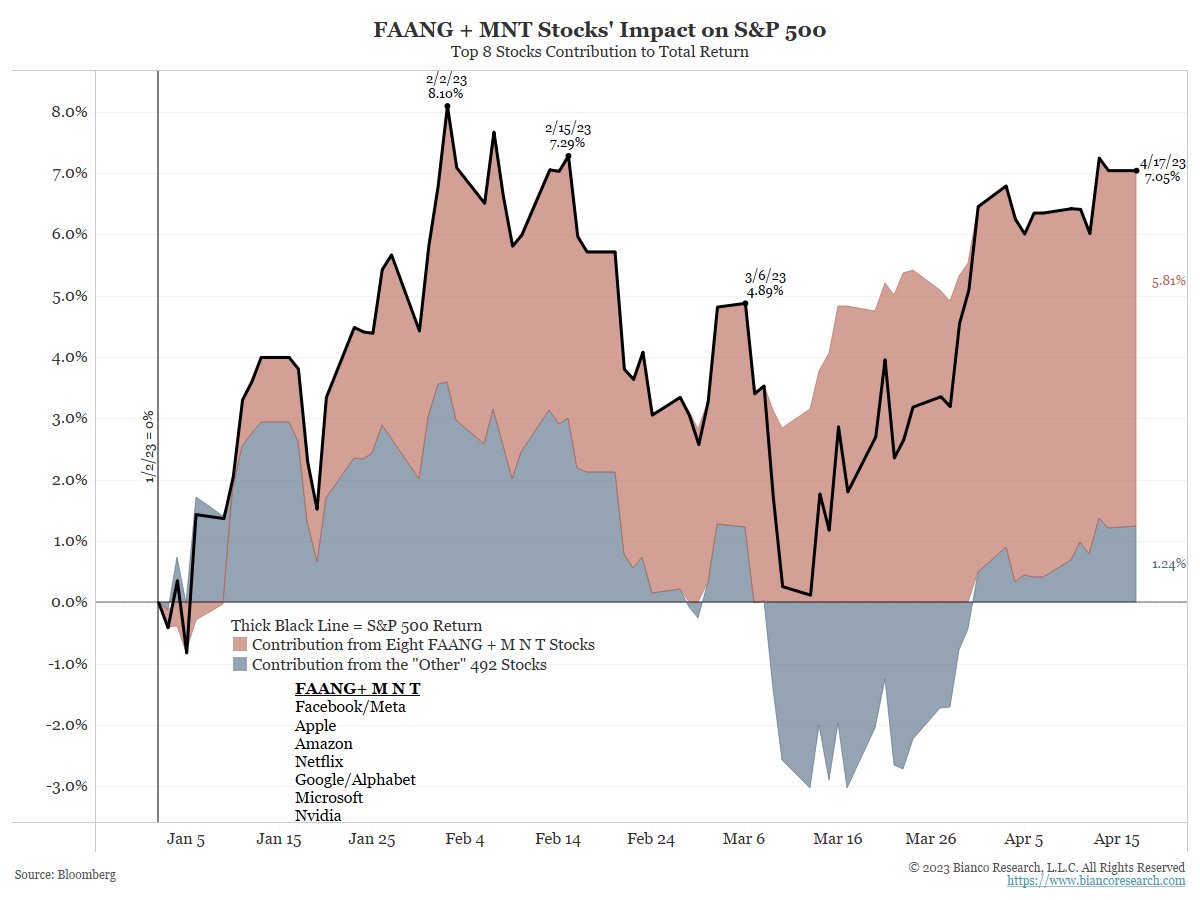
- Jim Bianco biancoresearch.eth
How concentrated has the SPX’s 7.05% YTD rally been? 5.81% of this gain is from the eight FAANG+MNT stocks (listed on the chart) 1.24% of this gain is from the “other” 4.92% stocks in the SPX. FAANG+MNT is 25.4% of the SPX’s market cap, and 82.4% of its YTD gain.
Cash has gained 1.29% YTD.
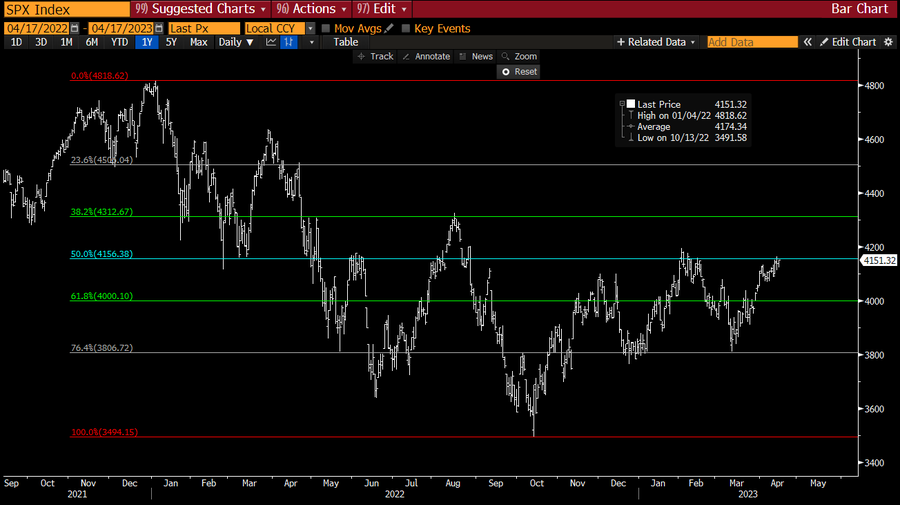
After nearly 16+ months since the peak in stock prices, they have not retraced more than 50% of their losses (cyan). And they have been unable to establish an uptrend of almost a year. “All is well” should not see the SPX struggle to establish an uptrend for a year.