Households Boosted Spending in April but Drew Heavily on Savings Closely watched inflation reading eased slightly but remained near four-decade high
Consumer spending rose by a seasonally adjusted 0.9% last month, the Commerce Department said Friday, with households spending more on services and autos. The savings rate fell to 4.4%, from a downwardly revised 5% the prior month. (…)
Consumer prices rose 6.3% in April from a year earlier, down from 6.6% in March, as measured by the Commerce Department’s personal-consumption expenditures price index. (…)
Prices rose a seasonally adjusted 0.2% in April from March, slowing from a 0.9% rise a month earlier as energy prices edged down after having surged in March. The index increased at an annual rate of 6.9% from three months earlier in April, slowing slightly from an 8% annualized pace in March.
On a monthly basis, core prices were up a seasonally adjusted 0.3%, the same as in February and March. The core index rose at a three-month annualized rate of 4% in April, down from 4.4% in March and the slowest pace since September 2021. (…)
The Commerce Department said personal income rose a seasonally adjusted 0.4% last month. Adjusted for inflation, disposable income was flat during the month, showing that wage increases are struggling to keep up with price rises and that consumers are drawing on their savings to make purchases.
Spending figures aren’t adjusted for inflation, meaning higher prices constitute part of the picture. When taking inflation into account, personal-consumption expenditures rose 0.7% in April, with durable goods spending up 2.3%, nondurable goods spending up 0.2%, and services spending up 0.5%.
Spending on automobiles and parts was the largest component of the increase in durable-goods spending, while food services, accommodations, and utilities made up the largest increases in services spending. (…)
The surprise was from durable goods where real spending surged 2.3% in April following a 0.7% increase. Real outlays on motor vehicles jumped 3.9% surge after a revised 2.5% March increase, initially reported as a 2.0% drop. Real spending on recreational goods & vehicles improved 2.1% (3.7% y/y) after easing 0.1% in March. Real expenditures on home furnishings & appliances improved 0.5% after declining in the prior two months.
The March revision in real spending on vehicles from a 2.0% drop to a 2.5% increase is rather puzzling given that unit sales declined 4.0% in March.

Consumption expenditures have fallen back in line with aggregate weekly payrolls (employment x hours x wages) which are now rising at a 7.0-7.5% annualized rate.

The PCE price index rose 6.3% YoY in April from +6.6% in March. It is now rising 2% more slowly than the CPI (+8.2%), the widest differential since 1981. Estimated substitution has likely run its course.

That would leave real consumption growth in the 1.0-1.5% range going forward assuming steady growth in payrolls and a stable savings rate around its current, unusually low, 4.4% level, down from 5.0% in March.

The good news is that durable goods prices have stopped rising:

Lower oil prices drove prices of nondurables down in April but that will reverse in May.
The intrigue is in services inflation, rising at a 4.6% annualized rate since January per the PCE index but at a 7.6% rate per the CPI, the latter unusually significantly outgrowing the former in each of the last 4 months:

The differences between PCE and CPI inflation are most significant in services. The Cleveland Fed explains the major differences:
(…) the biggest differences between the CPI and PCE arise from the differences in their baskets.
The first difference is sometimes called the weight effect. (…) The CPI is based on a survey of what households are buying; the PCE is based on surveys of what businesses are selling.
Another aspect of the baskets that leads to differences is referred to as coverage or scope. The CPI only covers out-of-pocket expenditures on goods and services purchased. It excludes other expenditures that are not paid for directly, for example, medical care paid for by employer-provided insurance, Medicare, and Medicaid. These are, however, included in the PCE.
Finally, the indexes differ in how they account for changes in the basket. This is referred to as the formula effect, because the indexes themselves are calculated using different formulae. The details can get quite complicated, but the gist of the matter is that the PCE tries to account for substitution between goods when one good gets more expensive. (…)
This chart from the Brookings Institute highlights the different weights:

The two largest differences are among services: housing (CPI: 42% including shelter at 33%, PCE 23% including shelter at 15%) and medical care (9% vs 22%).
Housing inflation is currently 5.9% YoY per the CPI, one full percentage point higher than the PCE’s 4.9%. With the large weight difference, it shaves 1.2% off the PCE vs the CPI, at a time when shelter costs are accelerating and pressuring consumer budgets.
A similar situation occurred in the inflationary years of the late 1960’s and 1970s when PCE housing meaningfully lagged CPI-housing. Between 1967 and 1982, total PCE inflation averaged 10.5% while total CPI inflation averaged 12.3%. During the same 15 years, PCE-housing inflation averaged 10.7% while CPI-housing inflation averaged 14.3%. Housing thus accounted for 40% of the spread between PCE and CPI inflation.
PCE inflation is the Fed’s preferred measure but, for most Americans, housing costs account for much more than 23% of their total expenditures. We also know that rental costs inflation is currently understated in the CPI.
The costs of medical care service are currently rising 3.5% YoY, substantially less than CPI-services inflation of 5.4%, a rather unusual difference. In the last 35 years, medical inflation exceeded services inflation each year but 3 (and only minimally) and outgrew total services inflation 11.6% to 6.0% annually on average.
In all, April’s 0.25% MoM increase in PCE inflation (CPI = +0.33%) was a relief that could prove short lived.
- The substitution effect may have peaked.
- Housing costs are clearly accelerating which is likely to filter through PCE data, even with its much lower weight.
- Medical care services inflation has been subdued at 1.9% in 2021 but is accelerating in 2022: +3.8% a.r. in Q4’21, +5.1% in Q1’22 and +6.3% in April per CPI data. The oversize PCE weight will soon reflect this acceleration. On a YoY basis, April was up 3.5% but trending toward 5.5% by mid-year.
Aside from statistical quirks, from most Americans’ standpoint, the CPI measure of out-of-pocket expenses with a more realistic 32% weight for shelter is a better reflection of the inflation bite off their weekly paycheck.
As mentioned above, headline CPI is +8.2% YoY in April, against labor income rising 7.0-7.5%.
When Nordstrom and Bloomingdale posted strong sales last week, we were all relieved to see that affluent Americans are still spending merrily. But it does not offset the very weak sales volumes registered by the much larger retailers like WalMart, Target and Amazon, particularly the first two which revealed that late March and April sales were very soft, with actually declining demand. Middle and low-income consumers are getting squeezed and have little choice but to consume less and trade down.
The risk is that consumers also elect to cut on services which accounted for 70% of total expenditures pre-pandemic but currently only 65%, the same proportion as before the Great Financial Crisis.
In fact, real spending on services is only 1.1% above its pre-pandemic level. Assuming people wish to fully return to their previous lifestyle or do “revenge spending”, real services would need to rise 9.3% or $750B to reach the pre-covid trendline (blue line).

There are 2 potential problems with that:
- Real disposable income has not increased since February 2020 and has, in fact, been declining steadily since July 2021. So a return to trend would require that Americans spend an additional 5% of their disposable income on services bringing services spending to 61% of total income, a level not seen since 2010.
- Because of weak income growth and the disproportionate size of services vs goods, a $750B increase on services would need to seriously eat into durables and nondurables spending. Food and Energy take 45% of all nondurables and thus make this category less flexible. Actually, high inflation on food and energy will make it difficult to “borrow” from nondurables. Spending on durables would therefore need to be cut. But $750B equals 34% of all spending on durables and 150% of the increase of the past 2 years.
The math dos not work. If services are expected to take the lead from durable goods, the retail segment of the economy will suffer along with S&P 500 companies which are mainly goods sensitive.
Either employment and wages accelerate, or inflation decelerates. The former would tend to boost inflation while the latter would likely need a softer economy, even more so given the statistical peculiarities mentioned previously. Unless Americans, ever the optimists, take their savings rate even lower.
Goldilocks would be nice.
Alternative data collected by the likes of GS, BofA and JPM suggest slower consumer spending in May, particularly on goods. Job growth also seems to have slowed.
Gallup’s Economic Confidence Index measured -45 in May, down from -39 in each of the previous two months. It is the lowest reading in Gallup’s trend during the coronavirus pandemic, and likely the lowest confidence has been since the tail end of the Great Recession in early 2009.

Oil Jumps as EU Commits to Partial Russian Crude Ban Crude prices extended recent gains after the European Union said it would impose an oil embargo on Russia, while U.S. stock futures wobbled between small gains and losses.
Businesses Brace for Consumers to Rein in Spending Shoppers are growing cautious, and companies from Walmart to Procter & Gamble are altering course to reflect changing budgets.
(…) Over 80% of American consumers plan to cut back spending by buying cheaper or fewer products, according to a May survey of 1,014 people by NPD. (…)
Some Walmart customers are also switching to less-expensive store brands for items such as dairy and deli meat even as sales of big-ticket items such as gaming consoles and patio furniture remain strong, Walmart U.S. Chief Executive Officer John Furner said on a call with analysts earlier this month.
“We see both of those things happening at the same time,” he said. (…)
Some retailers that serve wealthier shoppers where sales were strong in recent months say they aren’t seeing a slowdown yet. (…)
- Car-Insurance Bills Are Rising, With More Increases to Come Rates are up as much as 20% as insurers struggle with inflation.
(…) “These cost increases are going to be here for a while,” said Allstate Corp. ALL 2.39%▲ Chief Executive Tom Wilson, speaking about inflation in repairing and replacing vehicles. “So we’ve been raising prices pretty aggressively, as well as reducing our expenses.” (…)
Car repairs and replacement vehicles are more expensive. Insurers are paying for longer rental periods than they used to, amid shortages of body-shop technicians and delays in getting repair parts, among other cost pressures. In addition, traffic fatalities surged in 2021 to a 16-year high.
During the first quarter, Allstate increased rates in 28 states an average of 9.3% for its Allstate car-insurance brand. An Allstate senior executive told analysts in an earnings call in early May that, “given the ongoing inflationary pressure, we have increased the magnitude of rate increases we expect to take in the rest of 2022.” (…)
From the middle of last year when some insurers began raising rates aggressively, the industry through early May obtained increases on about 61% of its base of personal-auto premiums, said Elyse Greenspan, an analyst with Wells Fargo Securities. For now, the rate increases are “not enough to offset the elevated loss trend.” (…)
Robots Pick Up More Work at Busy Factories Rising wages and worker shortages, compounded by increases in Covid-19-related absenteeism, are changing some manufacturers’ attitudes about robots.
Orders for workplace robots in the U.S. increased by a record 40% during the first quarter compared with the same period in 2021, according to the Association for Advancing Automation, the robotics industry’s trade group. Robot orders, worth $1.6 billion, climbed 22% in 2021, following years of stagnant or declining order volumes, the group said. (…)
The number of robots deployed in the U.S. per 10,000 workers has traditionally trailed countries such as South Korea, Japan and Germany, according to the International Federation of Robotics. (…)
While auto makers and manufacturers of auto components accounted for 71% of robot orders in 2016, their share declined to 42% in 2021, the automation association said. Meanwhile, robots made inroads into other sectors including food production, consumer products and pharmaceuticals. Executives said improved capabilities are allowing robots to be programmed for more-complex tasks requiring a mixture of strength and nimbleness. (…)
“The robots are becoming easier to use,” said Michael Cicco, chief executive officer of Fanuc America, a unit of Japan’s Fanuc Corp., a major supplier of industrial robots. “Companies used to think that automation was too hard or too expensive to implement.”
Daron Acemoglu, an economics professor at Massachusetts Institute of Technology, said factories’ increasing reliance on automation will lead to an oversupply of human labor that will drive down wages in the years ahead, unless other U.S. industries can absorb displaced manufacturing workers. (…)
![]() Manufacturing employment was rising faster than production before the pandemic. Since February 2020, production is up 5.1% but employment is down 0.4%. That’s 710k fewer employees than pre-pandemic. Since the line crossed in June 2020, production rose 11.6% but employment increased only 5.8% and the gap is accelerating.
Manufacturing employment was rising faster than production before the pandemic. Since February 2020, production is up 5.1% but employment is down 0.4%. That’s 710k fewer employees than pre-pandemic. Since the line crossed in June 2020, production rose 11.6% but employment increased only 5.8% and the gap is accelerating.

But it’s not only in manufacturing:
- Dollar Tree Targets Speed, Productivity in Supply Chain Upgrades The discount retailer is bulking up capital spending and bringing more technology to distribution as it increases its store count
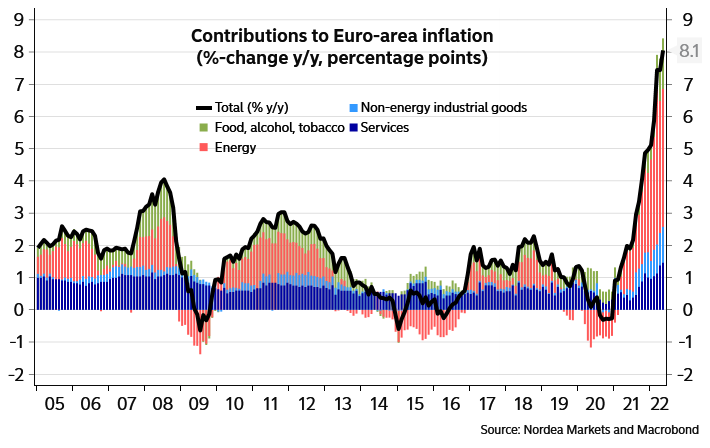
Euro-area inflation: breaking another record Euro-area inflation accelerated to 8.1% in May. While high energy and food prices explained two thirds of headline inflation, also core inflation accelerated and was 3.8% in May.
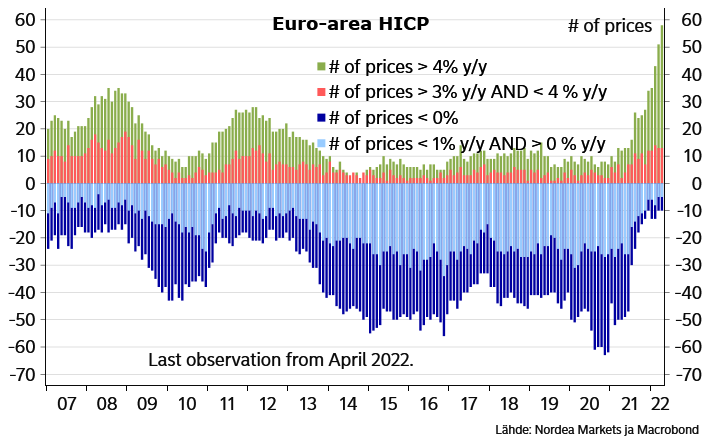
Record number of rapidly rising prices
- British Airways staff threaten summer strike Unions seize on travel chaos to demand higher wages
(…) British Airways said check-in staff had rejected a 10pc payment offer for the current year. (…) The Telegraph revealed over the weekend that pilots are facing a 9pc salary cut next year under a pay deal agreed at the height of the pandemic and designed to fund salaries for staff left out of work. (…)
Martin Chalk, general secretary of pilots union Balpa said this weekend: “As executives and shareholders consider tucking in their napkins prior to dipping their snouts back into the bonus and dividend troughs, pilots warn that they will, through their union Balpa, insist full salaries and conditions are reinstated and their sacrifices are properly recognised.” (…)
Goldman Sachs on U.S. inflation:
(…) high inflation has become quite broad-based, with a component-level decomposition of the PCE inflation basket showing that 50% of core services excluding shelter increased by at least 4% (annualized) over the past six months. (…) Our GS shelter inflation tracker edged down 0.1pp to +6.7% in April, and continues to point to a pickup in the official shelter series from its current +4.8% year-on-year rate. (…)
The gap between available jobs and workers stands at +5.6mn workers, the most overheated level in post-war history both in absolute terms and relative to the size of the population. (…)
Our index of company price announcements is at the highest level since our series began in 2010, and mentions of the word “inflation” were the most frequent since at least 2010 so far in this quarter’s Russell 3000 earnings calls. (…)
China’s Economic Downturn Shows Signs of Easing The pace of economic decline in China slowed in May, but economists are skeptical about a big revival as long as the government takes a zero-tolerance approach to Covid-19 outbreaks
(…) China’s official manufacturing purchasing managers index rose to 49.6 in May, China’s National Bureau of Statistics said Tuesday, from April’s 47.4—the lowest in more than two years. It beat the 48.9 reading economists polled by The Wall Street Journal were expecting.
A separate gauge of activity in services and construction also improved, rising to 47.8 in May from 41.9 in April. (…)
Tuesday’s data suggest the economic pain continued through May, underscoring the risk of contraction for the economy in the second quarter. Gauges of overall factory production, export demand and new orders [48.2 vs 42.6] all remained in negative territory, according to the surveys. (…)
The French economy is in recession and inflation has not yet peaked A double whammy for the French economy: inflation continues to rise and reached 5.2% in May, while first-quarter GDP has been revised down. We believe the French economy is currently in recession and we are revising down our growth forecast for 2022
GDP figures for the first quarter have been revised downwards significantly. Instead of the previously estimated stagnation, GDP actually contracted by 0.2% in the first three months of the year. The contraction is explained by a strong decrease in household consumption (-1.5%), particularly in transport equipment and manufactured goods. Despite the dynamism of investment (+0.6%), domestic demand contributed negatively to economic growth, to the tune of -0.6 points.
The contribution of inventories (+0.2 points) and foreign trade (+0.2 points) cannot compensate enough to pull the French economy out of contraction. This bad news is compounded by the downward revision of annual growth for 2021 to 6.8% from the previously estimated 7%. This new profile leads to a marked revision of the carry-over effect for the rest of 2022: at the end of the first quarter, it now stands at 1.9%, compared to 2.4% at the time of the previous estimate.
Looking ahead, the news is not very encouraging. The data on consumption in volume of goods for the month of April, published by INSEE this morning, indicate a further decline in household consumption, of -0.4%. Both food consumption and consumption of manufactured goods are down over the month (-1.1% and -0.3% respectively). Only energy consumption increased (+0.7%), as a result of the more unfavourable weather conditions in April.
The second quarter has thus started very badly for the consumption of goods. While the consumption of services is probably much more dynamic, it is likely that household consumption will again contribute negatively to growth in the second quarter, given the inflationary context and the decline in confidence. Consequently, a further contraction of GDP in the second quarter is expected. It means that, in our view, the French economy is currently in a de facto recession.
For the second half of the year, we expect a slight recovery. The third quarter should see a significant increase in tourism activity against the backdrop of the end of health restrictions and the return of foreign tourists, which should help to achieve quarterly growth of around 0.4%. The fourth quarter will probably be a little less dynamic. Given the various downward revisions, we are now expecting growth of 2.1% for the year as a whole (compared with 2.7% previously). This is therefore a significantly lower figure than the expected 4% that was used by the executive to establish the 2022 budget. With the recession, inflation at 5% and rising interest rates, the first months of the new government are likely to be more complicated than expected.
TECHNICALS WATCH
The relief rally from oversold levels has shown no true leadership according to my favorite technical analysis firm. It sees no strong evidence to support a firm, sustainable bottom at this time.
But we had the first equity inflow in 7 weeks

(EPFR via The Market Ear)
This is from Callum Thomas at Topdown Charts:
Upside-Downside Ups and Downs: Here’s the rolling counts of extreme upside vs downside volatility (percent changes above/below a certain threshold: the original was daily and 1% +/- threshold). I mentioned this indicator a while back, and @exposurerisk has run with this alternative indicator, dubbing it the Thomas Counts.
But anyway, the key point is it puts on clear display the shifts in market regime from upside frenzy to downside fear. It’s charts like this (and the macro backdrop) that make me think we’re still early in the bear phase, and that this does represent a market regime change rather than a reversion to “buy the dip“.

Source: @exposurerisk
Callum also has this sentiment piece:
One of the things we need to remember is that the macro backdrop has been steadily worsening over the past year, and it represents a flip or a coming full-circle of the momentous macro backdrop that we enjoyed in the wake of the pandemic stimulus packages.
This chart shows global equities (MSCI All Countries World Index, in local currency terms) against a composite of macro-related sentiment indicators from Consensus Inc. (treasuries, commodities, currencies, equities). Key point is it’s gone from extreme optimism to now slightly net-bearish.
(…) Pattern recognizers will also note that it kind of looks eerily similar to 2008.
All this is to say I don’t think we’re out of the woods just yet. I don’t think we get let off that lightly after such a prolonged (and more recently: preposterous) period of excess. Proceed with caution.

Evergrande discussing staggered payments, debt-to-equity swaps for $19 billion offshore bonds
Evergrande’s entire $22.7 billion worth of offshore debt including loans and private bonds is deemed to be in default after missing payment obligations late last year. (…)
As part of the proposal, Evergrande is looking to repay offshore creditors the principal and interest by turning them into new bonds, which will then be repaid in instalments over a period of seven to 10 years, said one of the sources.
Offshore creditors also will be allowed to swap a portion of their debt into stakes in the developer’s Hong Kong-listed property services unit, Evergrande Property Services Group Ltd (6666.HK), and electric vehicle maker China Evergrande New Energy Vehicle Group Ltd (0708.HK), said the two sources. (…)
Evergrande is reeling under more than $300 billion in liabilities and has become the poster child of the country’s property sector crisis as it lurched from one missed payment deadline to another. (…)
Most Evergrande dollar bonds had fallen below 10 cents on the dollar as of Friday morning. (…)
Shares of Evergrande Property Services and Evergrande New Energy Vehicle, as well as the parent, have been suspended for roughly two months. None of them have yet filed their financial results for 2021 because audit work had not been completed.
The property management unit is also under an internal probe since March to find out how banks seized its 13.4 billion yuan in deposits that had been pledged as security for third party guarantees. (…)
The company saw contracted sales plunged by 39% in 2021 from the previous year.
The government is so worried that the economy would get too weak before Xi’s coronation:
China announced an easing of lending requirements for homebuyers. Due to a sharp rise in the banks’ NPL ratios with developer loans, however, this may not translate into an effective stimulus for the Chinese economy.

Goldman Says Bull Market in Battery Metals Is Finished for Now
Where we’re growing
America’s top 15 cities by percentage growth last year were clustered in Arizona, Texas and Florida, with a few in Idaho and one in Tennessee. The U.S. is spreading out, heading South and West and creating new boomtowns, tech hubs and powerhouses. (From a Census Bureau release last week)
Data: Census Bureau. Map: Baidi Wang/Axios