Global price gauge hits new high as input cost inflation accelerates sharply
Inflationary pressures have risen worldwide to the highest for at least a decade as a surge in demand is accompanied by widespread supply constraints in the provision of goods and services. The survey data point to a steep rise in consumer price inflation across the world in coming months, most notably in the US, where prices charged for consumer goods rose especially sharply.
The input prices index from the JPMorgan Global Composite PMI, compiled by IHS Markit from its proprietary business surveys, rose to its highest since August 2008 in March, indicating by far the steepest rate of input cost inflation seen since the global financial crisis. (…)
The increase in costs has fed through to the steepest increase in average selling prices for goods and services for over a decade, the recent rate of increase greatly exceeding anything seen since comparable data were first available in late-2009.
Upward price pressures showed signs of spreading from manufacturing through to services, and also to consumers. Manufacturers’ material prices rose at a pace not exceeded since April 2011, the rate of increase accelerating markedly on February, while service sector costs (which includes wages, rents and other costs as well as materials and fuel) registered the largest gain since September 2008.
(…) It was not surprising to therefore see that the highest price pressures were recorded for intermediate goods – products sold as inputs to other companies, such as electrical and electronics components – as companies not only sought to ensure adequate supply for current production, but also often sought to build additional stocks to safeguard against future supply issues. Average selling prices for intermediate goods consequently rose at the fastest rate yet recorded since data were first available in October 2009.
A survey high was also recorded for prices charged for investment goods, such as machinery and equipment, while consumer goods prices increased at the steepest rate for a decade, mainly reflecting the pass-through of these higher intermediate goods prices to final products, as well as greater shipping costs.
However, in one of the strongest indications that the upturn in price pressures is filtering beyond manufacturing, a survey high was also recorded for rates charged for business-to-business services.
Looking into the sector data in more detail, only banking and transportation charges fell during March, with the latter down only very marginally. However, while the banking sector also reported lower costs during the month, meaning its margin squeeze was the lowest of all sectors covered by the PMIs, the latter saw a survey record rise in costs, pointing to heavily squeezed margins. (…)
The steepest increase in average prices charged for goods and services was seen in the US, where the latest rise was the steepest recorded since survey data for the US were first available in 2009. Especially steep increases were also seen in the UK, which saw the largest monthly rise since November 2017, as well as in Brazil and Russia, where increases were among the highest recorded by the surveys.
Selling price inflation meanwhile hit the highest since the start of 2019 in the eurozone and the highest since November 2016 in China.
In contrast, only a muted rise in average goods and services prices was seen in India, and Japan reported a marginal decline, albeit registering the weakest fall since the pandemic began.
One of the most important drivers of the above-average rise in selling price inflation in the US was an especially steep hike in prices charged for consumer goods. Not only did US consumer goods producers report the largest rise of all major goods and services product sectors ever recorded by IHS Markit’s US survey, but the rate of increase far exceeded that reported in Europe and Asia, hinting at an especially marked pass-through to consumer price inflation in the US.


- Trying to protect profits:
US small businesses hiking prices at the fastest pace ever?
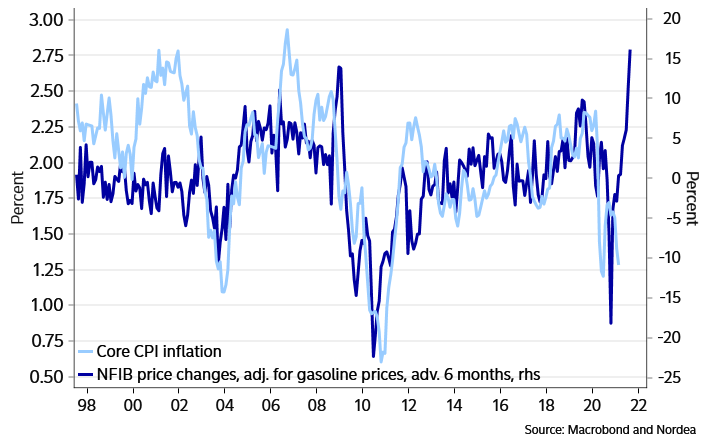
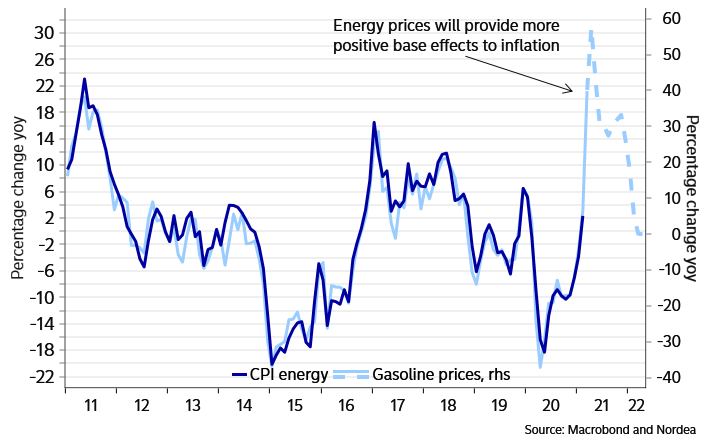
- Gasoline prices were up 40% yoy in March, and historically this can have a tendency to spill over to core inflation measures (especially to the core PCE deflator). Alas, it usually does so only after a delay of one month – so we probably should not expect much (core) inflationary fireworks already this day. We will, however, see headline inflation surge above 2%, perhaps to 2.4%. (Nordea)
CPI inflation to start soaring due to energy price base effects
- Shoppers Are About to Realize Just How Messed Up Shipping Has Become Port congestion issues are bad news for Americans eager to upgrade their wardrobes. But retailers may end up benefitting—at least a little.
(…) In a recent survey conducted by Jefferies, when consumers were asked what category they would like to spend discretionary dollars on once the pandemic subsides, clothing and accessories came second behind bars, restaurants and pubs. Shoppers are already returning in healthy numbers: Same-store foot traffic at apparel and accessories retailers fully recovered to 2019 levels in the last week of March, according to data from ShopperTrak and Citi. (…)
In a National Retail Federation survey conducted in March before the Suez Canal blockage, 98% of surveyed retailers said they had been impacted by port or other shipping-related delays. More than half the respondents said congestion was adding at least three weeks to their supply chains. (…)
As of January, retail stores had enough inventory to cover just over a month of sales—a record low. In their most recently reported fiscal quarters, Macy’s and Kohl’s inventory levels were down more than 25% compared with a year earlier, while apparel companies Tapestry,Capri Holdings and VF, which owns brands including Timberland, Dickies and North Face, all saw inventory levels that were at least 15% lower. (…)
Ralph Lauren noted that its average selling price grew 19% in its quarter ended Dec. 26 compared with a year earlier. Victoria’s Secret owner L Brands was able to charge at least 30% more for lingerie in North America in its quarter ended Jan. 30 compared with a year earlier, while a sister brand, PINK, was able to command almost 40% higher prices. (…)
“For the first time in a very long time, retailers have pricing power,” notes Simeon Siegel, analyst at BMO Capital Markets. (…)

The producer price index rose 4.4% from a year earlier after gaining 1.7% in February, the National Bureau of Statistics said Friday, higher than the 3.6% median estimate in a Bloomberg survey of economists. The consumer price index increased 0.4% after falling for two straight months. (…)
“Our research has found that China’s PPI has a high positive correlation with CPI in the U.S.,” said Raymond Yeung, chief economist for Greater China at Australia and New Zealand Banking Group Ltd. “The higher-than-expected PPI data could impact people’s judgment of inflation pressure in the U.S. and globally, and this impact shouldn’t be underestimated.” (…)
Consumer-price deflation in recent months was driven mainly by falling pork prices, a key component of China’s CPI basket. While prices are likely to pick up, the slow recovery in household spending means inflation will likely remain subdued. Core consumer prices, which exclude volatile energy and food costs, rose 0.3% in March from a year earlier, while food prices fell 0.7%. (…)

While costs are rising, demand is solid, particularly for goods:
(…) The savings sitting in Canadian bank accounts exceed even the most ambitious spending targets signalled by the government. Consumers have about $220-billion of cash on hand – about $180-billion more than is normal, and equal to about 10 per cent of Canada’s economy, Mr. McKay said. And there is more cash on companies’ balance sheets. In the U.S., equivalent deposits are closing in on US$1.8-trillion, representing a similarly large share of the economy.
“That’s just unprecedented. It’s almost 10 [times] what a consumer would normally carry through a cycle,” Mr. McKay said. (…)
Neither banks nor economists can predict how much of the pent-up cash will be spent, and what proportion will be saved or invested. But even assuming that consumers strike a middle ground, RBC’s forecast points to economic growth rates “that start to get up closer to double digits” in percentage terms, Mr. McKay said. “We feel that the central banks will have to move the short end of the curve in the latter part of next year to start to address some of these pressures building up.” (…) (Globe & Mail)
Through April 4, the Chase spending tracker is 5.8% below its pre-Covid trend…

…but discretionary spending is accelerating (24% above Jan. 2019) while Travel and Entertainment is sharply recovering, suggesting that consumers are not slowing down discretionary purchases to accommodate other “needs”.

U.S. Initial Unemployment Insurance Claims Unexpectedly Increase
Initial claims for unemployment insurance rose to 744,000 during the week ended April 3 from 728,000 during the prior week, revised from 719,000. The Action Economics Forecast Survey anticipated 690,000 initial claims for the latest week. The 4-week moving average rose to 723,750, up slightly from the previous week.
Initial claims for the federal Pandemic Unemployment Assistance (PUA) program fell sharply to 151,752 for the week ending April 3, from 237,065 in the previous week. It was the lowest level since the first week of January. The PUA program covers individuals such as the self-employed who are not included in regular state unemployment insurance. Given the brief history of this program, which started April 4, 2020, these and other COVID-related series are not seasonally adjusted.
Continuing claims for regular state unemployment insurance fell to 3.734 million during the week ended March 27 from 3.750 million in the previous week. The state insured rate of unemployment held steady at 2.6%, the lowest level since the third week of March of last year. Continuing PUA claims rose slightly to 7.554 million in the week ending March 20.
The number of Pandemic Emergency Unemployment Compensation (PEUC) claims rose modestly to 5.636 million from 5.516 million in the prior week. That program covers people who were unemployed before COVID but exhausted their state benefits. Extended PEUC benefits, which were included in the American Rescue Plan bill, totaled 786,962.
The total number of all state, federal and PUA and PEUC continuing claims fell slightly to 18.165 million, the lowest level since the first week of January. This grand total is not seasonally adjusted.
Fed Minutes Show Expectations for Stronger Economic Recovery Officials raised their forecasts for economic growth and inflation, reiterating at their March meeting plans for continued policy support
(…) Still, most of the 18 officials at the meeting expected rates to remain pinned near zero through 2023 and expressed no readiness to reduce the bond purchases last month, according to minutes of the meeting, released Wednesday.
“While generally acknowledging that the medium-term outlook for real GDP growth and employment had improved, participants continued to see the uncertainty surrounding that outlook as elevated,” the minutes said. Fed officials thought their “current guidance for the federal funds rate and asset purchases was serving the economy well.” (…)
While some Fed officials said the scenario could drive employment and spending up faster than anticipated, most didn’t see an outsize risk of inflation becoming a problem, the minutes showed. (…)
Although…
GM Idles Production at Plants as Chip Shortage Worsens Scant supplies of in-demand semiconductors prompted General Motors to idle several North American factories and extend shutdowns at others, putting a strong sales rebound in jeopardy.
GM said Thursday that three plants previously unaffected by semiconductor supply problems will be idled or have output reduced for one or two weeks, including a factory in Tennessee and another in Michigan that make popular midsize sport-utility vehicles. (…)
The moves follow news last week that Ford Motor Co. would deepen production cuts in North America, including idling for two weeks a factory near its headquarters in Dearborn, Mich., that makes the F-150 pickup truck, its biggest moneymaker. (…)
The chip shortage, also affecting products such as videogames, is among a number of factors hobbling global commerce in recent months, including backups at California ports, plant closures due to the Texas freeze in February and the ship stuck in the Suez Canal last month. (…)
The pace of U.S. vehicle sales in March leapt to its second-highest level ever for that month, the National Automobile Dealers Association said Thursday. That is despite the shriveling discounts available amid tight inventories caused largely by chip-related production problems. The average new-vehicle incentive fell nearly $1,000 last month compared with a year earlier, to about $3,500, the association said. (…)
The number of vehicles on dealership lots or en route to stores fell 10% to about 2.4 million by the end of March compared with a month earlier, according to research firm Wards Intelligence. (…)
GM has estimated the chip shortage could hurt pretax profit by as much as $2 billion this year. Ford has said its hit could be $2.5 billion. (…)
This year’s production cuts have prompted temporary layoffs of thousands of factory workers at GM, Ford and Stellantis who are represented by the United Auto Workers. In addition to unemployment aid, those workers get supplemental pay under the union’s labor contract. (…)
- What do Apple, Nissan and Internet routers have in common? They’re all hit by the chip squeeze. Production of some MacBooks and iPads is delayed due to chip and display shortages, Nikkei reported. It also said Nissan will reduce car output by about 3,000 units. And Internet routers may be next: Broadband providers have been quoted order times of up to 60 weeks, more than doubling previous waits, people familiar said. (Bloomberg)
- The vacancy rate for regional malls in the U.S. reached a record 11.4% in the first quarter, up from 10.5% in the fourth quarter — the largest increase on record, according to Moody’s Analytics. (CNBC)
China Car Sales Soar to Pre-Pandemic Levels Retail sales of passenger cars in China hit 5.09 million vehicles in the first quarter, up 69% from a year earlier, when Covid-19 sent sales plummeting.
(…) The latest quarter’s sales about matched the 5.08 million passenger cars sold in the first quarter of 2019, though they fell short of first-quarter 2018’s 5.7 million.
The drop in China’s stock market has depressed consumption since mid-February, undermining the recovery of the world’s largest auto market. Car sales in March were down 19% from January.
First-quarter sales of electric cars jumped to 437,000 vehicles, CPCA said, more than four times the year-earlier total. (…)
With Beijing’s commitment to achieve carbon neutrality by 2060, the CPCA projected that two million electric cars would be sold in China this year, almost 10 times as many as last year, driven by strong consumer demand and technological advancements.
A shortage of chips and other components has been disrupting car production, and the effects will deepen in the April-June quarter, not easing until year-end, the government-backed China Association of Automobile Maunfacturers projected Friday. (…)
RISK MANAGEMENT
- China’s Record Surge of Defaults Driven by Property Developers Real estate firms made up 27% of last quarter’s record $15.1 billion of missed payments on onshore and offshore bonds, according to data compiled by Bloomberg. Chinese companies overall defaulted on 74.75 billion yuan ($11.4 billion) of local notes during the first three months of 2021, more than double the old record set a year earlier, while defaults nearly tripled to $3.7 billion for offshore bonds.
- China Flags Deeper Clampdown on Debt Growth at Local Banks
China’s government told smaller, local financial institutions to step up risk management and avoid “excessive” growth, stepping up a campaign to clamp down on a build up in debt as the economy stabilizes.
At a meeting of the Financial Stability and Development Committee on Thursday, Vice Premier Liu He called for “zero tolerance” on illicit activities, telling regulators to strengthen supervision of shareholders and owners of financial institutions, risk concentration, connected transactions and data authenticity, according to an official statement. (…)
The central bank has also told the nation’s major lenders to curtail loan growth for the rest of this year after a surge in the first two months stoked bubble risks, people familiar with the matter have said. At a meeting with the People’s Bank of China on March 22, banks were told to keep new advances in 2021 at roughly the same level as last year. (…)
The Office of the Superintendent of Financial Institutions (OSFI) is proposing changes to the mortgage stress test for uninsured mortgages that would effectively require borrowers to qualify at a rate of 5.25 per cent instead of the Bank of Canada’s benchmark five-year rate of 4.79 per cent. (…)
Under current rules, borrowers need to prove they can make their mortgage payments at a rate that is either two percentage points above their actual contract, or at the central bank’s benchmark, whichever is higher. With the interest rate on a five-year fixed loan below 2 per cent, the central bank rate has become the minimum threshold or minimum qualifying rate. (…)
The plan is now open for comment and OSFI expects to implement it on June 1.
It will likely exacerbate the market runup over the next few months as borrowers race to qualify at the lower rate. “It will make the situation worse, since demand will rise as buyers will try to move ahead of the change and accelerate purchasing activity,” said Benjamin Tal, CIBC’s deputy chief economist.
Many parts of Ontario, the Maritimes, British Columbia and Quebec have seen price increases of 20 per cent to 35 per cent during the pandemic. The price for a typical detached home in some Ontario suburbs has gone up at least $100,000 in three months. (…)
-
Data from Bank of America show the bank’s large institutional clients were net sellers of equities for the fourth straight week last week and hedge funds are starting to join them. “Last week, as the S&P 500 breached 4000 and our work suggests increasing signs of equity euphoria, BofA Securities clients were net sellers of US stocks,” the company’s data analytics team said in a note. The bank’s sell-side indicator rose for the third month in a row to a 10-year high and the closest to a contrarian “Sell” signal since May 2007, analysts noted. (Axios)
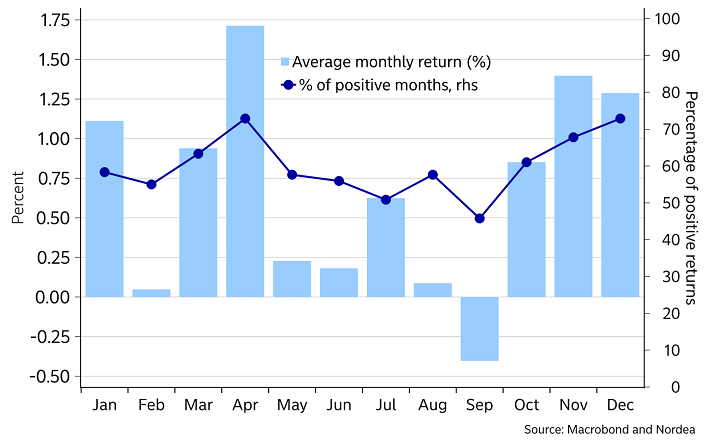
S&P500 – worse seasonality approaching
-
Retail retreat For now seven consecutive weeks, trading activity has declined on Charles Schwab’s (SCHW) platform – Most recently, trading volume declined -10% W/W to 6.2M trades for the week ending April 2nd (-40% below peak January levels).

- Half of investors see the glass half empty, at least in a survey the firm conducted at the end of March. “The policy backdrop for stocks under Biden now skews towards the pessimists,” said Lori Calvasina, RBC’s head of U.S. equity strategy.

- That pessimism makes Janet Yellen’s pitch all the more important. The Treasury unveiled a report expanding on the tax proposals released last week in Joe Biden’s economic package, with the secretary saying the government would take in an extra $2.5 trillion over 15 years.
But many just don’t care:
- More money poured into stocks in past five months than over last 12 years: BofA Investors have pumped more money into equities over the past five months than in the last 12 years, BofA’s weekly flow figures showed on Friday, as ultra-easy monetary policies and unprecedented stimulus has sparked a secular shift into stocks.
BofA said $576 billion had gone into equity funds in the past five months, beating the combined $452 billion inflows seen in the last 12 years,
Based on clients’ asset allocations, Bofa said a record 63.6% of the money was invested in stocks, 18.5% in debt and 11.6% in cash.
The exuberance has however slowed in recent weeks, with investors pouring $22.7 billion into cash during the week to Wednesday, on top of the nearly $100 billion committed in the last two weeks.
As of late February, investors had borrowed a record $814 billion against their portfolios, according to data from the Financial Industry Regulatory Authority, Wall Street’s self-regulatory arm. That was up 49% from one year earlier, the fastest annual increase since 2007, during the frothy period before the 2008 financial crisis. Before that, the last time investor borrowings had grown so rapidly was during the dot-com bubble in 1999. (…)
“It fuels bull markets and it exacerbates bear markets and to a certain extent you put it on the list of irrational exuberance,” said Edward Yardeni, president of consulting firm Yardeni Research. “The further that this stock market goes, the higher that margin debt will go, and when something blows up that will be one of the factors for why stocks are going down.” (…)

Equity allocation of the US household sector looks to have printed a new high this spring. The chart made by JPM “Flows & Liquidity” shows sum of equities held directly or via mutual fund shares or via Defined Contribution plans as % of total financial assets. HH equity allocation is up until Q4 2020 and extrapolated since then based on market price changes till April 05th 2021.

On a year-to-date basis, M&A volumes remain the strongest since 2000 – driven by a wide range of sectors.
Goldman on why it will continue: “we believe management teams will have confidence to pursue strategic opportunities that best position their firms for growth. Still-attractive funding costs may also provide a tailwind for deals that may require debt financing”

The support mechanisms are clear: 1) A sustained equity market rebound; 2) Lower for longer short-end rates; 3) Fed support and lower credit spreads; 4) Wide open capital markets; 5) Accelerating SPAC activity, and most important, more certainty on the forward look with a broader vaccine rollout.

- Spac boom under threat as deal funding dries up Hundreds of blank-cheque companies face uncertainty after investors balk at high valuations
New York Taxes Go Skyscraper High A weak and desperate Cuomo caves to the left on everything.
The WSJ editorial board:
The budget deal Gov. Andrew Cuomo cut this week with the Legislature lifts the top marginal rate on the state’s income tax to 10.9%, from today’s 8.82%. Add New York City’s top local tax of 3.88%, and the total is 14.78%. Take a knee, California (top marginal rate of 13.3%), and recognize America’s new tax king. Wall Street types already are migrating to Florida, which has an income tax of 0%.
Mr. Cuomo’s budget deal also raises the business franchise tax to 7.25%, from 6.5%. This affects many independent proprietors and will be another incentive to escape from Manhattan. (…)
PAINT WITH (BIG) NUMBERS!
Axios’ Felix Salmon:
The top two most expensive living artists at auction are David Hockney and Jeff Koons — both veterans of multiple museum shows, monographs, and and deeply considered works of scholarship.
- The next two most expensive artists, however, are Beeple and Sacha Jafri, neither of whom commands any respect among art-world cognoscenti.
- Both sell directly to collectors and eschew museums, galleries, connoisseurs, or, really, any desire to be placed within the history of art. They just make pictures that certain rich folk like to look at.
A ridiculously large canvas by Jafri recently sold for $62 million, despite (or perhaps because of) the fact that, as art critic Blake Gopnik tells me, “no one who cares about art cares about Sacha Jafri. His art is laughably lame.”
Here’s Jafri’s 17,000 square feet “The Journey of Humanity”:

Artnet News adds this for the artist in you:
There’s no sketches. There were no drawings,” Jafri told the BBC. “I was literally pouring paint, and then putting another layer on top and another layer, another layer, another layer, just feeling my way through it until something magical happened.”
It was also physically demanding work, with the artist constantly bending over to paint on the floor of the hotel ballroom. Jafri injured his pelvis and feet, and had to have emergency spine surgery. Still, he persisted, with the ultimate goal of raising $30 million for charity.
In the end, Jafri more than doubled that total thanks to the buyer, Abdoune, the chief executive of Altius Gestion International Holding. At the auction held at the Palm, he agreed to purchase the entire piece, which Jafri had originally planned to sell in 70 smaller sections across four auctions.
“I come from a poor family, and I knew at times how it feels to have nothing to eat,” Abdoune told Agence France Presse. “The painting was very powerful when I saw it, and, for me, it would have been a mistake to separate the pieces.”
Adboune plans to build a museum to house the painting, and to set up a charitable foundation with Jafri, according to the BBC.
Previously, Jafri’s high-water mark at auction was just TWD$2.16 million ($70,745), for a 2019 auction at Ravenel in Taiwan, according to the Artnet Price Database.
![]()
![]()
![]() So many signs now that there is way too much money around…
So many signs now that there is way too much money around…

")
")
")


