U.S. GDP Growth Revised Up to 1.4% in First Quarter The revision reflected stronger exports and consumer spending on services
(…) That was up from an earlier estimate of 1.2% growth, and forecasters expect a further pickup in the second quarter, which ends Friday. Macroeconomic Advisers on Thursday projected a 3.3% GDP growth rate for the spring quarter and the Federal Reserve Bank of Atlanta’s GDPNow model earlier this week predicted 2.9% growth. (…)
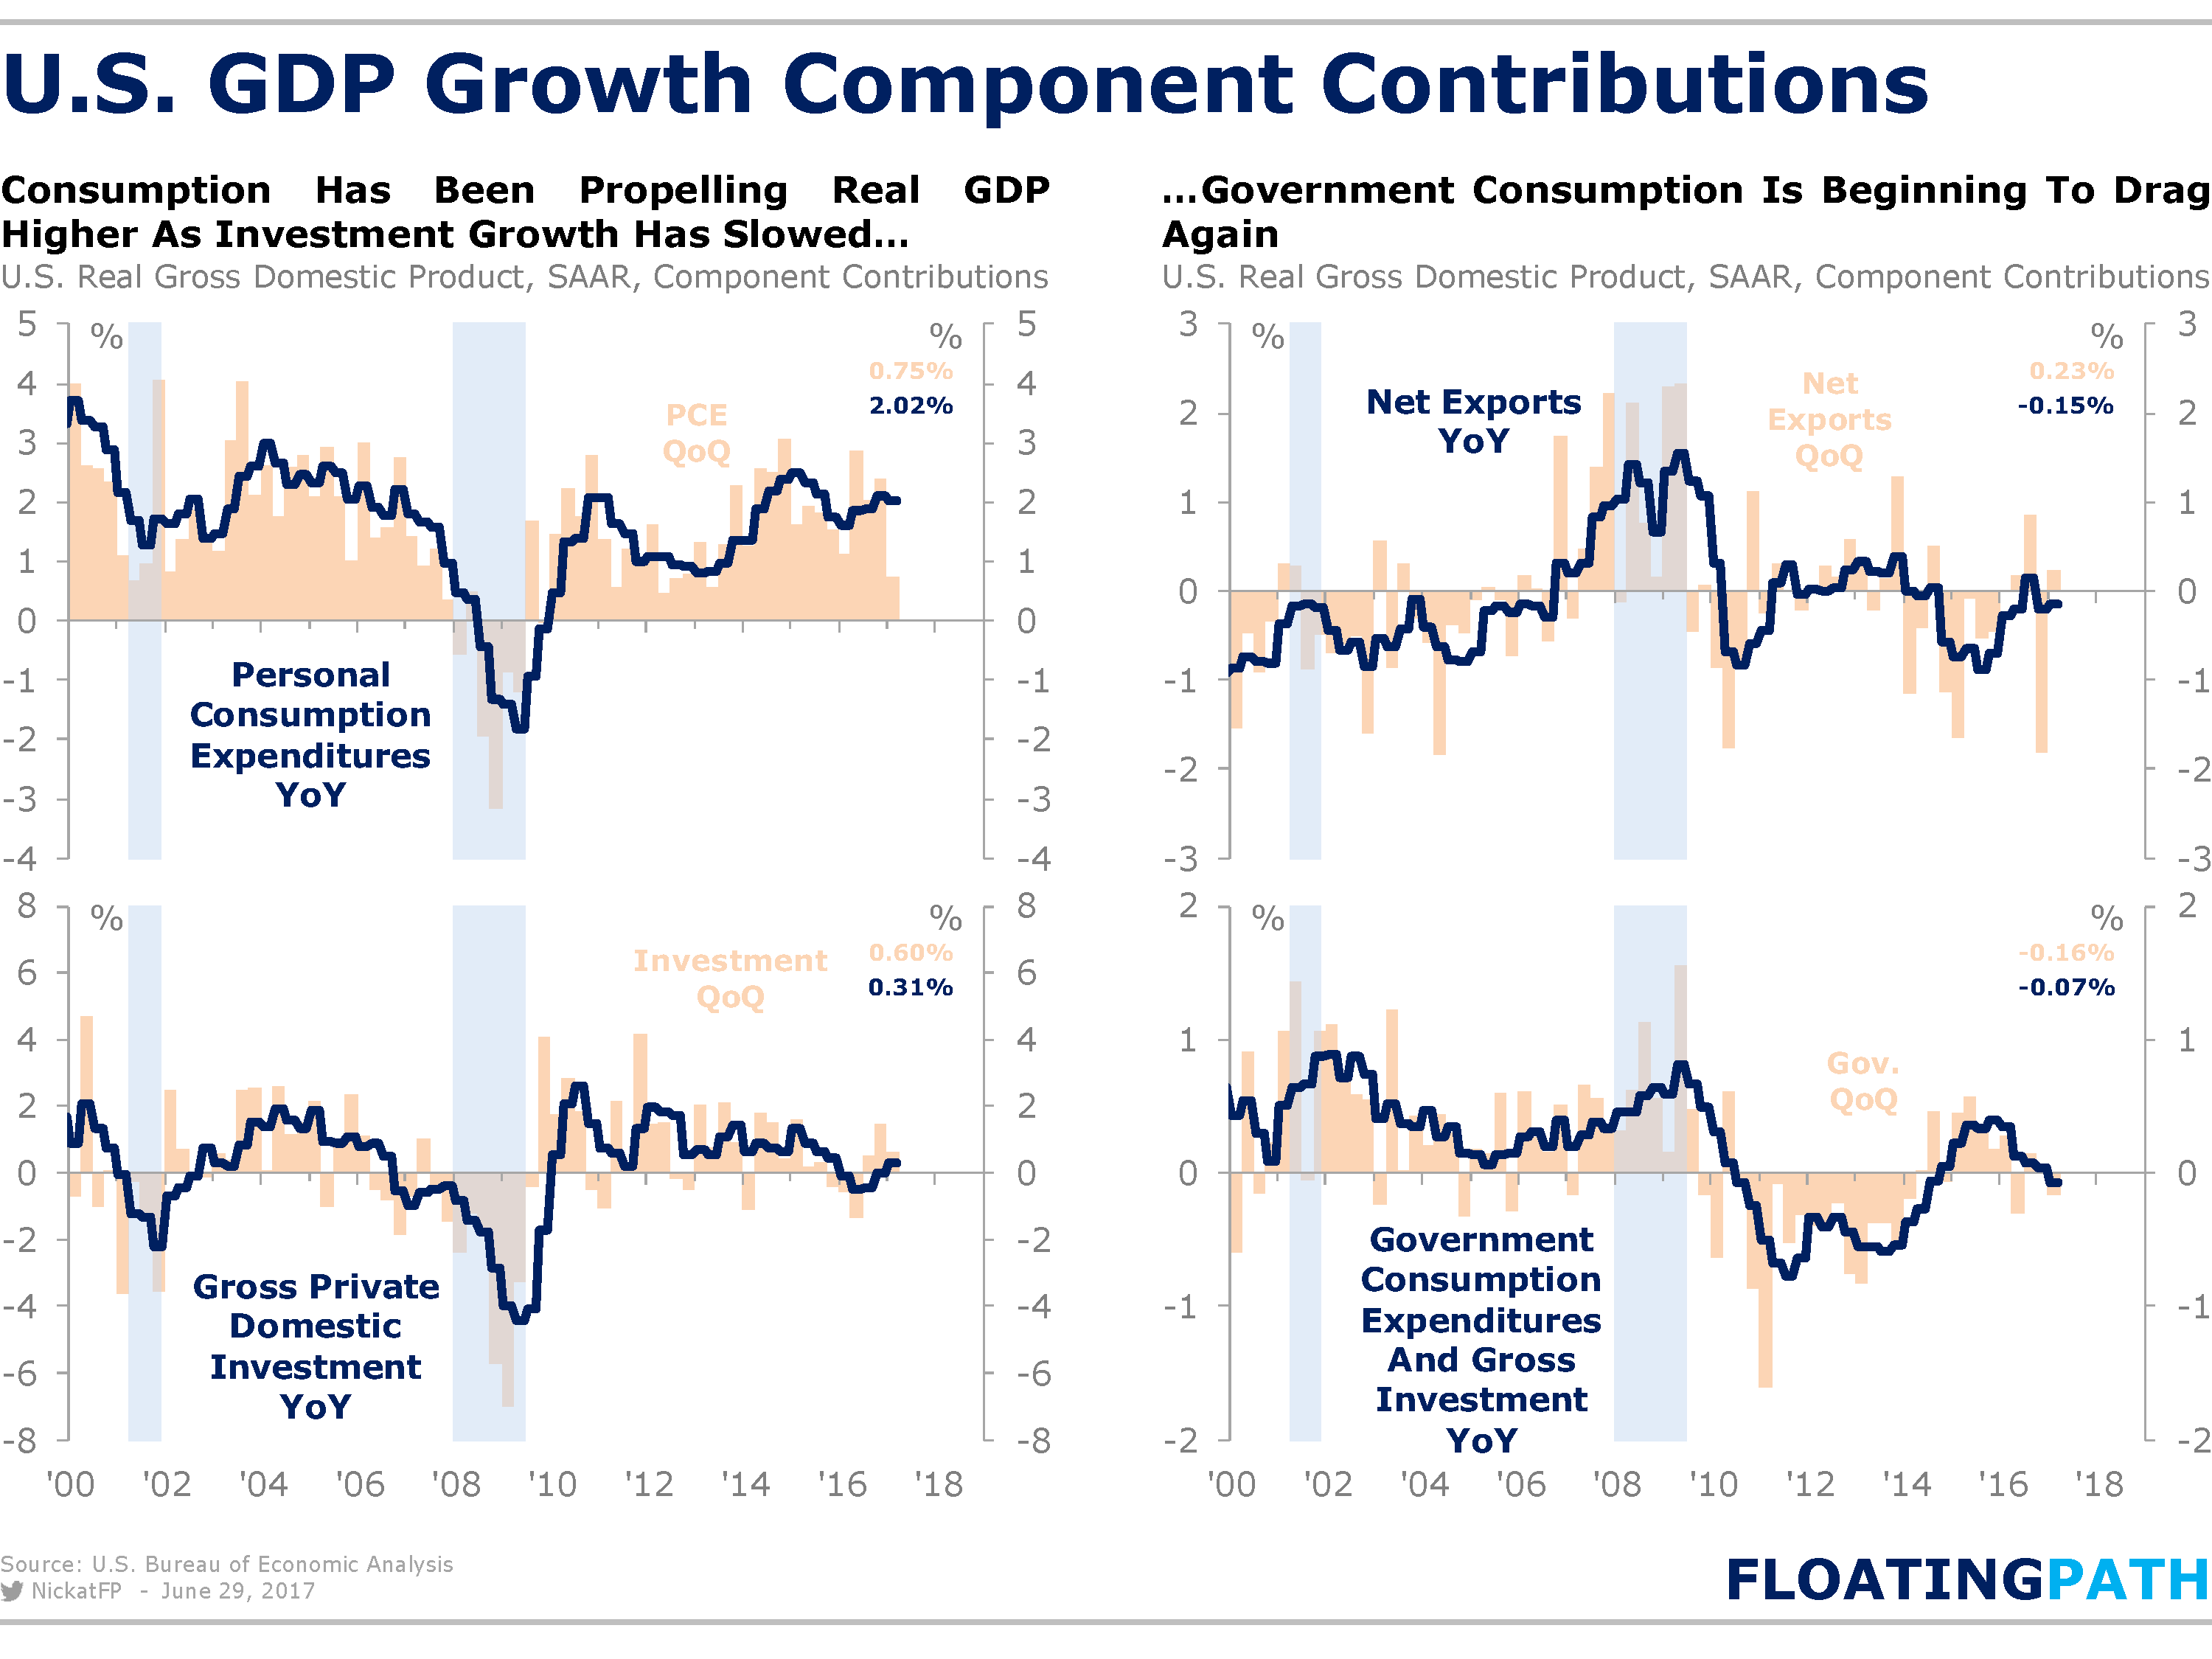
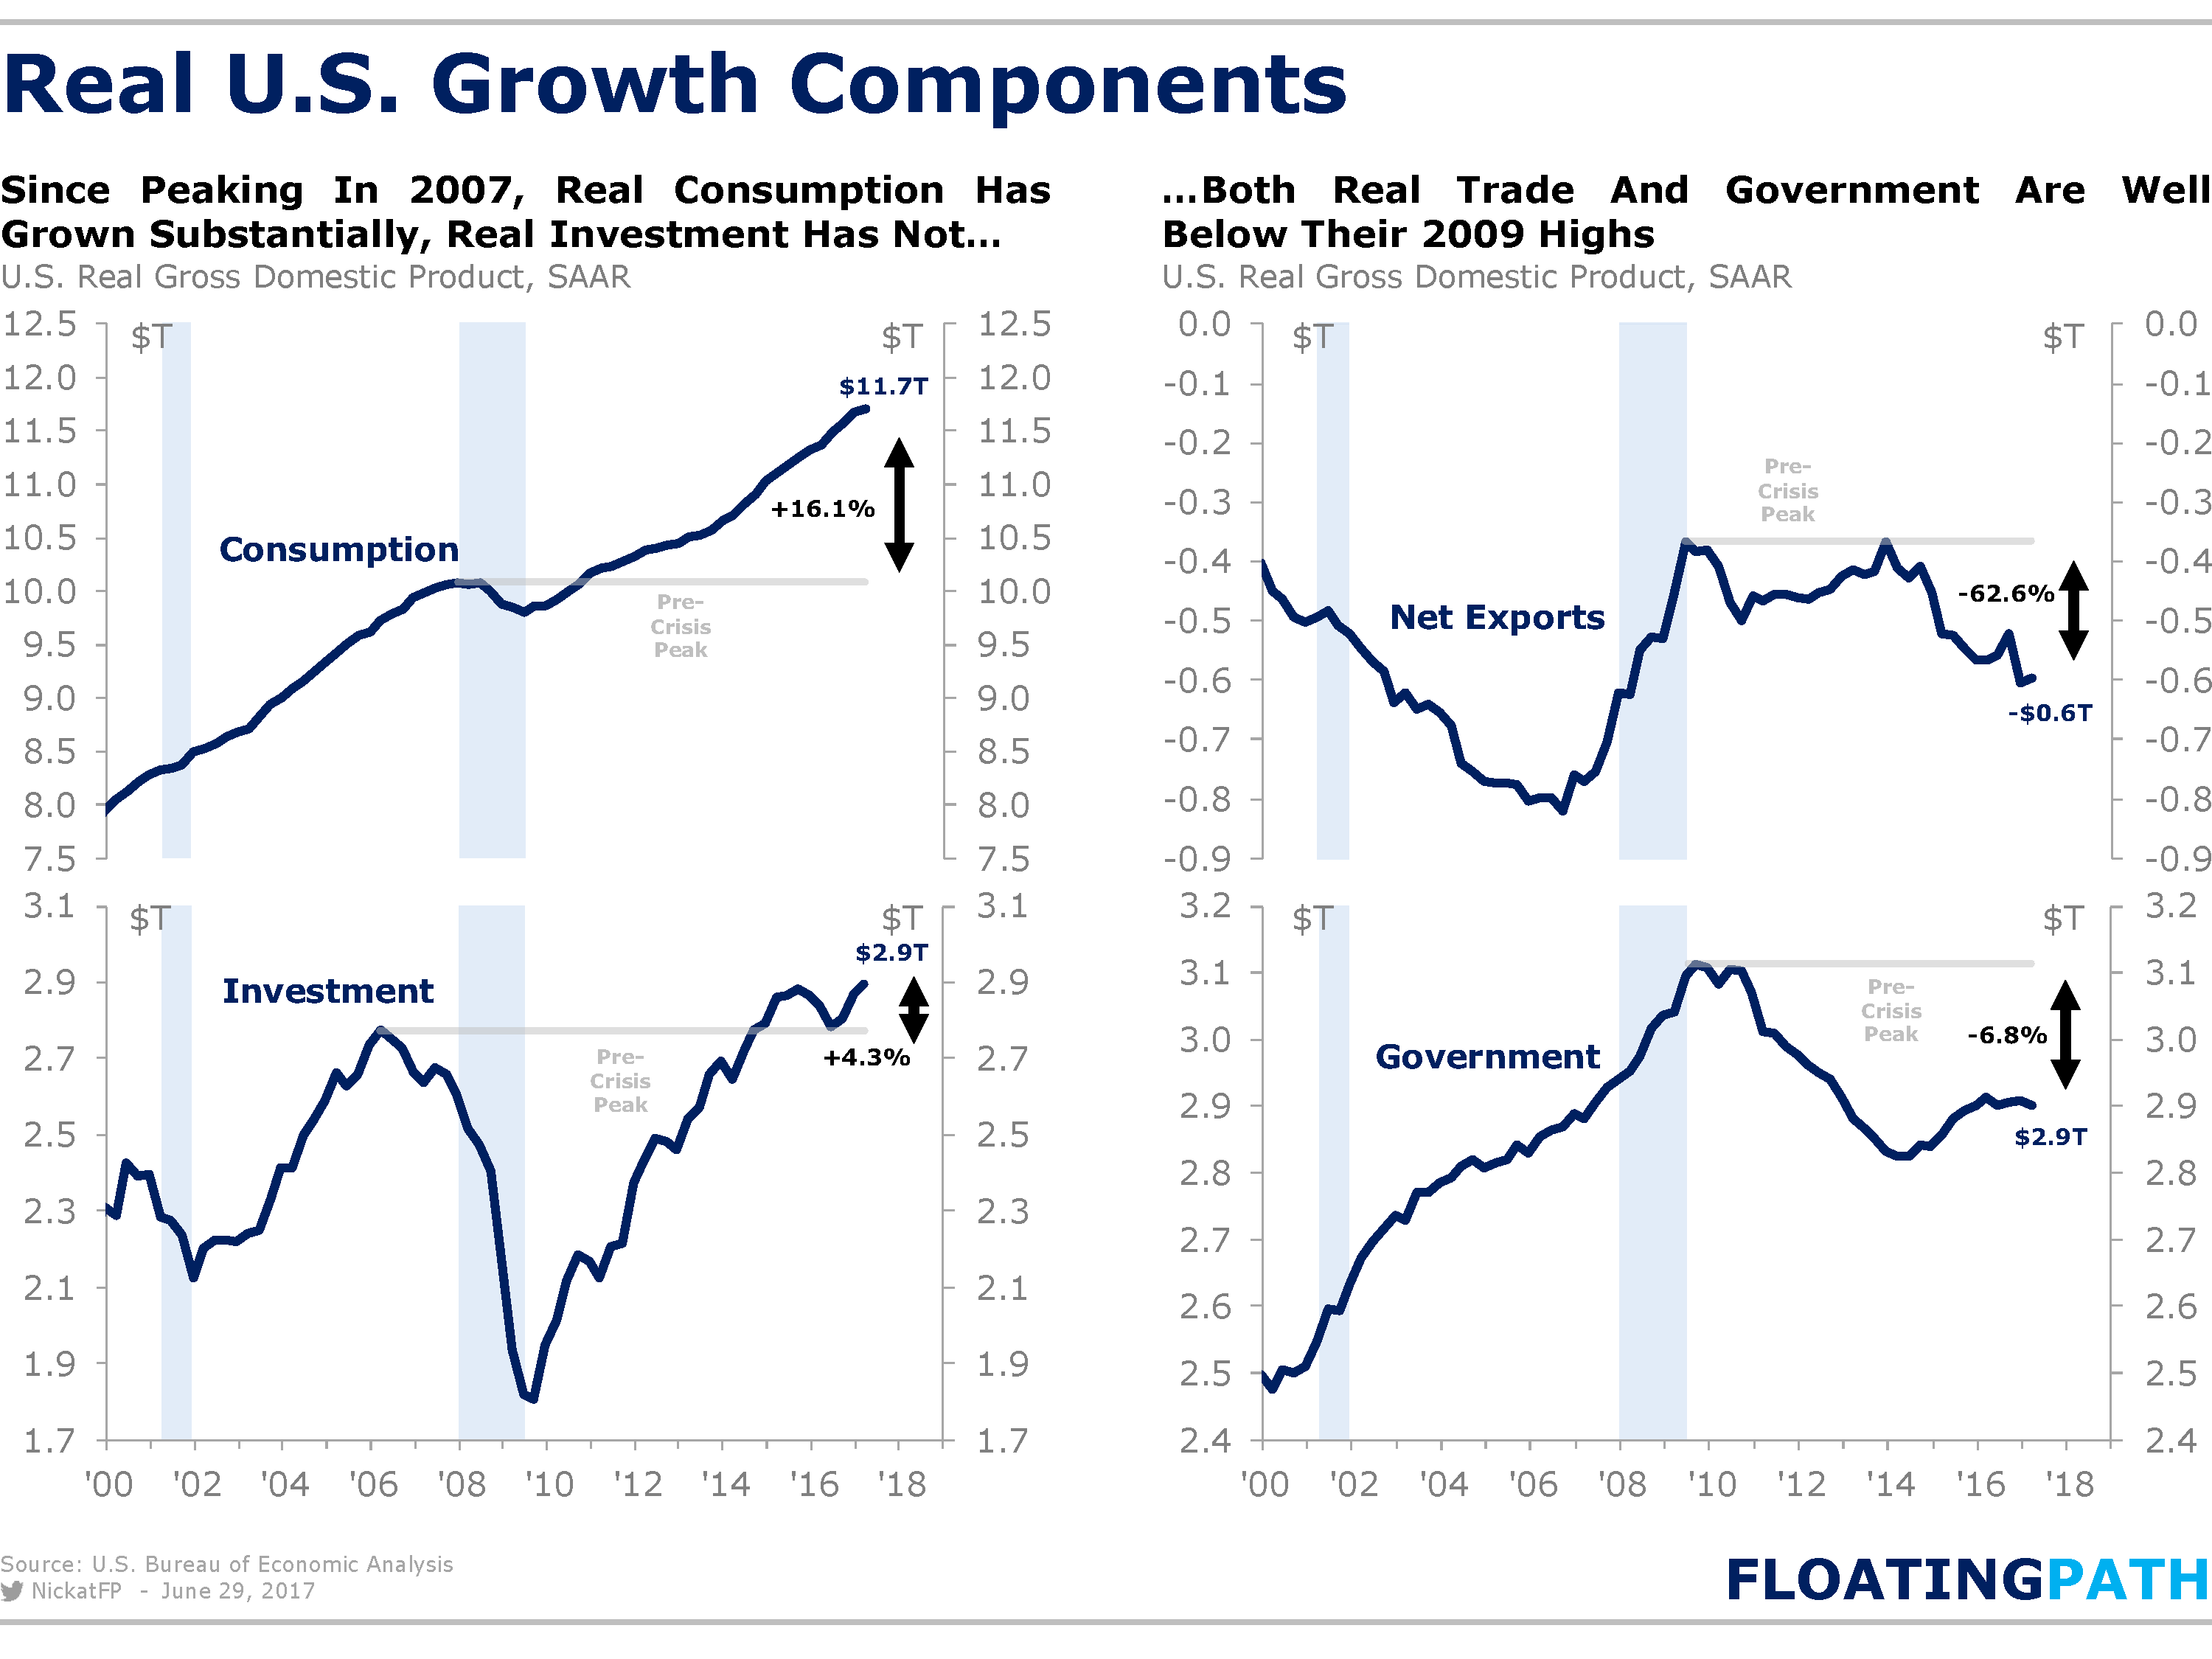
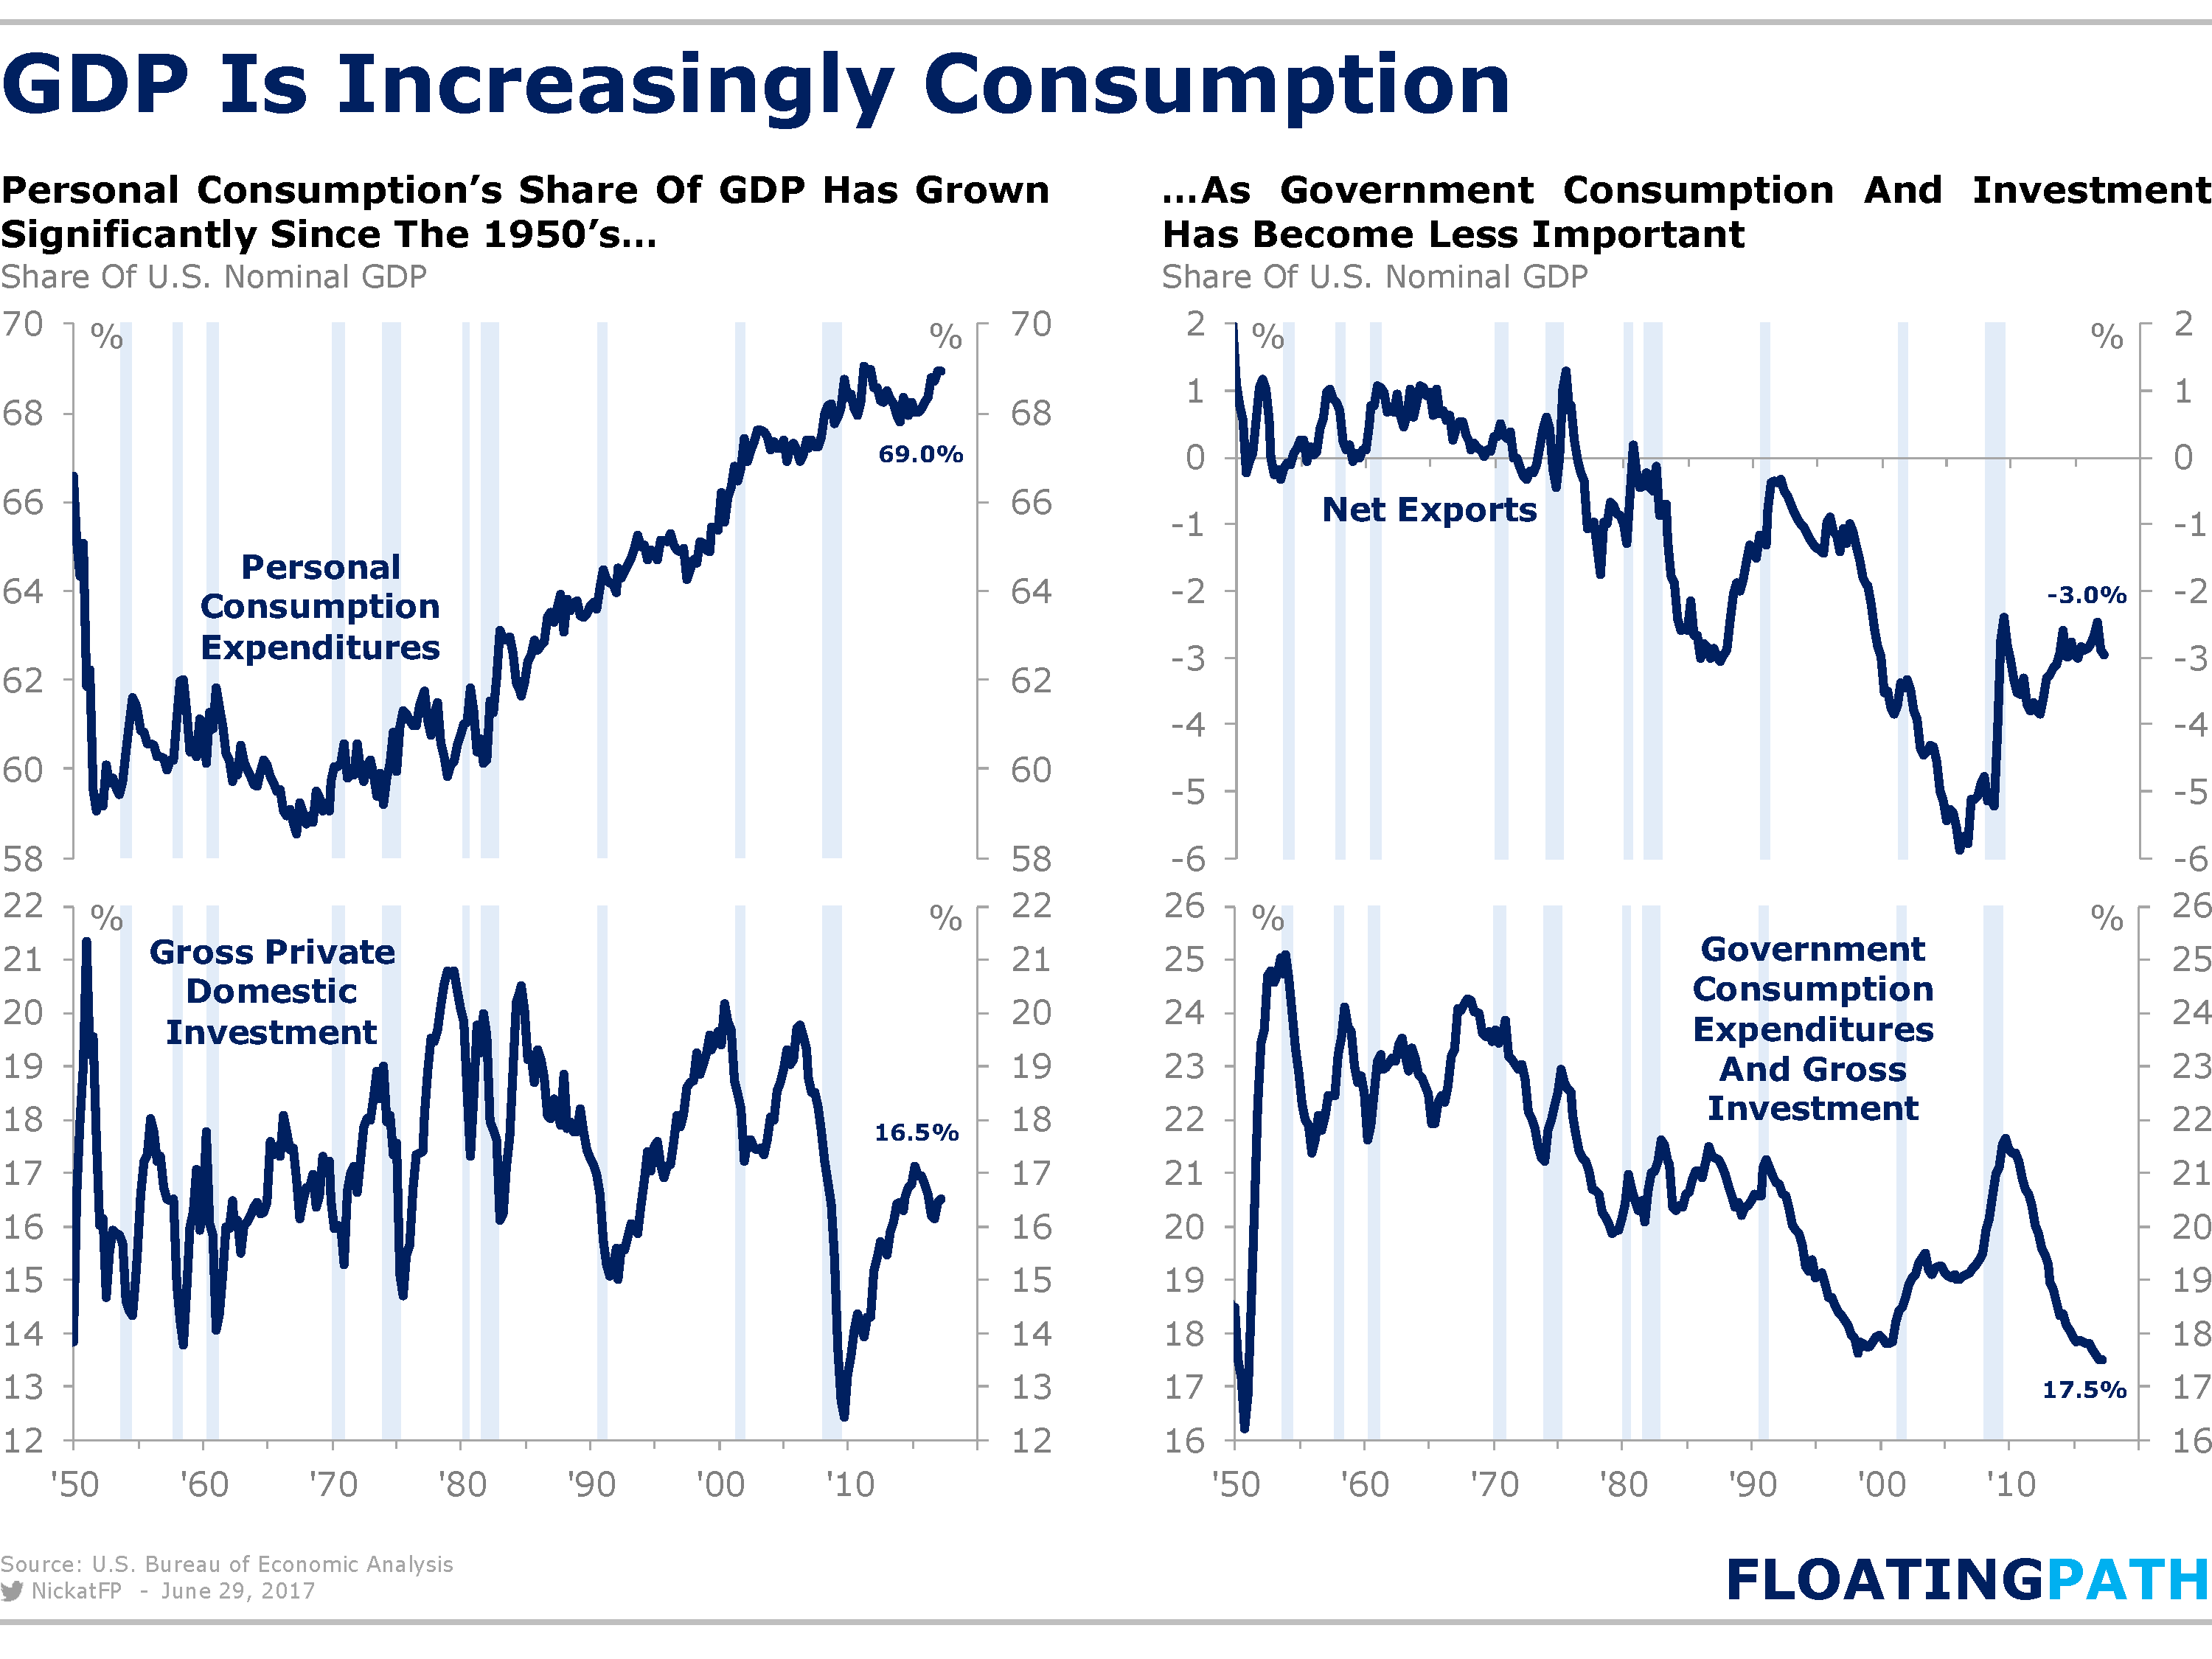
- Great charts from Floating Path:
-
Economy Is Losing a Big Booster Oil-price rebound gave capital spending a lift but weakening prices means it will likely be short-lived
In the first quarter, gross domestic product grew at just a 1.4% annual rate, while investment in capital equipment, new plants and the like increased 10.4%. Absent that gain, GDP would have grown by just 0.2%.
The jump in capital spending—the largest in five years—suggested companies were finally shaking off some off their caution. In truth, most of that spending was by energy companies ramping up drilling after oil prices recovered. With energy prices sliding, the rebound is looking short-lived.
Spending on energy-related equipment and structures (such as oil wells) counted for about 40% of the gain in capital spending in the first quarter. Since energy firms buy plenty of other items, such as transportation equipment, their share of overall capital spending was probably even larger.
There won’t be a repeat performance in the second quarter. Much of the gain in energy-sector spending in the first quarter likely came from purchases that were deferred in response to the crash in oil prices. (…)
A survey from the Federal Reserve Bank of Dallas released Wednesday showed that energy firms were less optimistic in the second quarter than the first quarter, and that fewer firms were increasing their capital spending. Comments from respondents to the survey exhibited plenty of worry. (…)
Economic Outlook from Freight’s Perspective – Gaining Strength
Not only have both the Shipments and Expenditures Indexes have now been positive for five months in a row, but they are showing accelerating strength. Throughout the U.S. economy, there is a growing number of data points suggesting that the economy continues to get slightly better. Some data points are simply less bad, but an increasing number of them are better, and even a few are becoming outright strong. The 7.1% YoY increase in the May Cass Shipments Index is yet another data point which confirms that the first positive indication in October was a change in trend.
What specifically is driving recent volumes? Parcel volumes associated with e-commerce continue to show outstanding rates of growth, with both FedEx and UPS reporting strong U.S. domestic volumes. According to the proprietary Broughton Capital index in the most recent month available (May), airfreight has also been showing improving strength, with the Asia Pacific lane jumping 12.3% and the Europe Atlantic lane growing 4.3% on a YoY basis. As we have described in previous reports, the strength in the Asia Pacific lane buoys our confidence in continued strength in the tech sector [there historically has been a high level of correlation between Asia Pacific airfreight and semiconductor billings], and continued improvement in the Europe Atlantic lane buoys our confidence in the continued growth, albeit modest, in the overall European Union economy.
Over the last two years, rail volumes have been a significant part of the weakness in freight flows, but lately they have become increasingly less bad, and in recent weeks have turned overall positive. Although it was against a very easy comparison, the Association of American Railroads (AAR) reported that the trailing 4 weeks YoY overall commodity carloads originated by U.S. Class 1 railroads grew by 8.4%, and even intermodal units have turned positive up 5.5%. (…)
We continue to assert that the trucking industry provides one of the more reliable reads on the pulse of the domestic economy, as it gives us clues about the health of both the manufacturing and retail sectors. We should note that as the first industrial-led recovery (2009-2014) since 1961 came to an end, and the shift from ‘brick and mortar’ retailing to e-commerce/omni-channel continues, we are becoming more focused on the number of loads moved by truck and less focused on the number of tons moved by truck.
• Tonnage itself appeared to be growing and gaining momentum (three-month moving average reached +2.58 on a not seasonally adjusted basis in January). Unfortunately, February, March and April tonnage was -2.71%, 1.13%, and -1.18%, pulling the three-month moving average down to -0.86%.
• Dry van truck loads have now contracted on a YoY basis six out of the last eight months and eight out of the last ten months. The most recent month (April) reported by the American Trucking Associations (ATA) was down 2.42% and pulling the three-month moving average even further negative to -1.87%. But fear not, recent data out of DAT Solutions suggests that this may be getting better in June.


Zumper National Rent Report: July 2017
This month, the Zumper National Rent Index reported that one bedroom median rent declined by 1.7% to $1,149, while two-bedroom rent decreased by 1.8% to $1,367. Overall, the Zumper National Rent Index values returned back to where they were a year ago. (…)

 A slide deck on America’s fiscal trajectory from Jason Furman.
Economic Conditions Snapshot, June 2017: McKinsey Global Survey results
(…) Respondents are as bullish on the global economy as they were three months ago: nearly half say global economic conditions have improved in the past six months. On the global economy’s prospects, too, respondents are more positive than negative. Nearly equal shares of executives say global conditions have improved (45 percent) and expect conditions will continue improving in the next six months (41 percent). (…)
Executives in India, who have long been the most upbeat, remain more positive than average about domestic conditions. But they are followed closely by their peers in Europe, 55 percent of whom say conditions at home have improved; those in the eurozone, where two-thirds cite improvements, are even more bullish. On the other end are executives in Latin America, the most likely respondents to say conditions have worsened: 39 percent say so, compared with the global average of 22 percent. Still, executives in the region are much more positive about current conditions than they were six months ago.
(…) respondents in North America are the least likely to say they expect improvements. Only 38 percent of executives now say so, compared with 48 percent in March and 53 percent in December. (…)
For the first time since March 2016, a larger share of emerging-market executives than developed-market executives predict their companies’ profits will increase in the next six months. At the regional level, those in India and in other developing markets are the most bullish on their companies’ prospects. (…)
Euro-Area Inflation Slows as Draghi Urges Prudence in Exit
Consumer prices rose an annual 1.3 percent in June — more than economists predicted — after increasing 1.4 percent the previous month, according to a flash reading by Eurostat on Friday. The core rate, which strips out volatile components such as energy and food, increased to 1.1 percent from 0.9 percent in May, also exceeding estimates. (…)
China Manufacturing Rose in June Amid Global Upturn
- The manufacturing purchasing managers index increased to 51.7 in June, beating all estimates compiled by a Bloomberg survey of economists, and the 51.2 reading in May
- The non-manufacturing PMI rose to 54.9 compared to 54.5 a month earlier
- New export orders rose to 52.0, the highest level since April 2012
- New orders climbed to 53.1 from 52.3 in May
- Business activity expectations rose to 58.7 from 56.8 in May
- Steel industry PMI for June eased to 54.1 from 54.8
- Conditions at large and medium-sized enterprises diverged; larger firms index rose to 52.7 from 51.2 while medium business index slipped to 50.5 from 51.3
- Services’ role in stabilizing the economy was reinforced; Delivery index rose to 72.2 aided by mid-term online sales promotions


Chinese Regulators Play Whac-A-Mole With Banks One of Chinese banks’ favorite tools for increasing leverage has staged a comeback just two months after a crackdown, highlighting the difficulties Beijing faces in its effort to cure the economy’s addiction to debt-fueled growth.
Chinese banks’ issuance of negotiable certificates of deposit in June nearly hit the high recorded in March, data from Wind Info showed. NCDs, a type of short-term loan, have become extremely popular in recent years with Chinese banks, especially smaller lenders due to their weaker ability to attract deposits.
During a clampdown on runaway debt in April, Chinese regulators warned banks against abusing the tool for speculative, leveraged bets in capital markets. But after a deep but brief drop, NCD issuance has risen again as regulatory attention appeared to ease in recent weeks, hitting 1.96 trillion yuan ($287.73 billion) this month, up sharply from 1.23 trillion yuan in May and just a touch below March’s record 2.02 trillion yuan. (…)
China introduced NCDs in 2013 as part of steps to liberalize interest rates, allowing banks to use the new fundraising tool to help set borrowing costs according to supply and demand.
The NCD market started taking off last year, as a rallying bond market encouraged banks, particularly the more aggressive and profit-driven smaller lenders, to use such short-term loans to further leverage their investments. (…)
There are signs that many banks are issuing NCDs to roll over maturing loans, giving themselves a lifeline to cover frequent short-term funding needs. (…)
Japan labour shortage hits 43-year high Latest data show increasing demand for workers but no sign of inflation
(…) The ratio of open jobs to applicants in Japan hit a 43-year high in May, as labour shortages in the world’s third-largest economy become ever more extreme. The closely watched indicator of Japan’s market rose 0.01 points to a reading of 1.49, the highest since February 1974, as companies struggle to fill positions from an ageing and shrinking workforce. The indicator covers all jobs, permanent and temporary.
New data suggest Japan’s economy is growing steadily and running at close to full capacity. But there is no sign of upward pressure on prices, meaning that the Bank of Japan will struggle to hit its 2 per cent inflation target. (…)
The rise in regular positions suggests companies are responding to labour shortages by improving conditions for workers rather than increasing pay. (…)
Headline consumer prices were up 0.4 per cent on a year ago, the same as in April, while the “core-core” consumer price index, excluding fresh food and energy, was unchanged compared with a year ago. (…)
Oil Prices Continue String of Gains After U.S. Production Drop Oil prices were up for the seventh straight session in their longest streak of gains since April, as investors continued to respond to a drop in U.S. production.
(…) Prices have rebounded after official data showed U.S. crude production dropped by 100,000 barrels a day last week. (…)
Meanwhile, demand growth globally is also clouding the outlook on crude prices. BMI Research data show that in the first quarter, U.S. fuel consumption was nearly flat compared with the same period last year, while South Korea showed smaller-than-expected growth and Japan’s demand contracted by 3% on year. (…)
-
Oil Price Outlook Darkens Long-sought recovery for crude grows more distant in latest poll
(…) Analysts expect low prices to last. A poll of 14 investment banks, surveyed by The Wall Street Journal in late June, predicted benchmark Brent crude would average $55 a barrel this year, down two dollars from the May survey. The banks expect West Texas Intermediate, the U.S. oil gauge, to average $52 a barrel this year, down two dollars from the previous survey.
Banks in the survey also downgraded their expectations for oil prices next year, predicting Brent crude would average $57 a barrel, down two dollars from the May poll. The banks expect WTI to average $55 a barrel in 2018, down three dollars. (…)
-
Canada oil output threatens to derail Opec plan Earlier investments set to keep pushing production higher for at least next 18 months
(…) A forecast released this month by the Canadian Association of Petroleum Producers sees the country’s output increasing by 270,000 barrels a day in 2017 and another 320,000 b/d next year. That combined two-year Canadian increase is equal to almost a third of Opec’s production cuts that it made with allies like Russia at the beginning of this year in an effort to raise prices. (…)
Rystad Energy, a consultancy, says production costs at mines have almost halved from $39 to $22 per barrel between 2014 and 2016, while in situ plants’ production costs have dropped from $18 to about $11 a barrel. (…)




 June 20th:
 Source: Credit Suisse (via The Daily Shot)