U.S. Pending Home Sales Decline
The National Association of Realtors (NAR) reported that pending home sales fell 1.3% during April (-3.3% y/y) to an index level of 109.8 following a 0.9% March slip.
Pending sales figure continued to exhibit mixed performance across regions. The index in the Midwest fell 4.7% following a 1.2% decline. For the South, the index fell 2.7%, the first monthly decline since November. The index in the Northeast declined 1.7% after a 3.1% March fall. To the upside was the index for the West. It rose 5.8% to the highest level since December.


Falling tax receipts pose a debt-ceiling dilemma
The federal government’s tax collections haven’t been growing much recently. That could be a warning about the health of the American consumer and, by extension, corporate earnings.
It also has some implications for the Treasury’s upcoming collision with the debt ceiling. (…)

Fed’s Beige Book Reports Slower Growth, Less Optimism in Some Regions Economic growth slowed across parts of the U.S. in recent weeks, and some firms have become a bit less optimistic about the future, according to a new report from the Federal Reserve.
(…) Broadly, the Fed said economic growth was modest in seven districts, moderate in four districts and “flattened out” in the New York Fed district. The prior beige book, released April 19, said activity expanded in all 12 regions with the pace equally split between moderate and modest. In Fed parlance, “moderate” is stronger than “modest.” (…)
The Philadelphia Fed reported manufacturers continued to expect growth over the next two quarters, but “the breadth of optimism has narrowed” and “expectations for future employment and capital expenditures also softened.” (…)
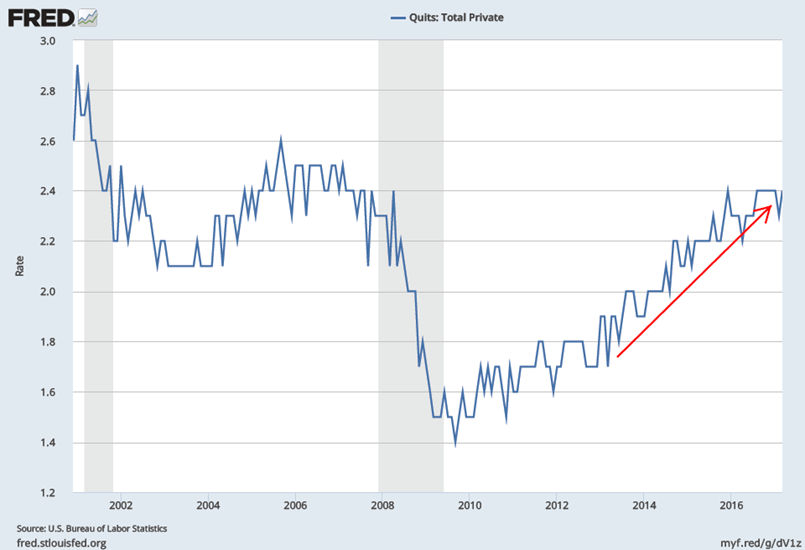
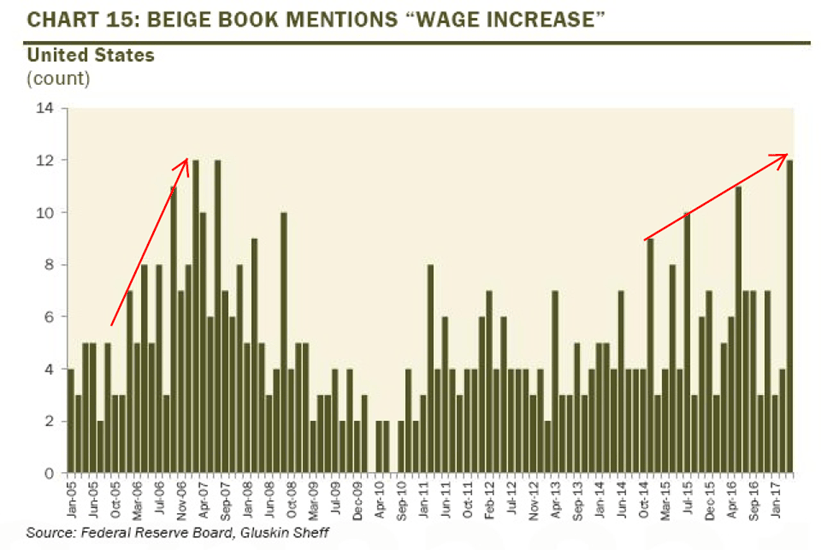
Labor markets across the U.S. “continued to tighten, with most districts citing shortages across a broadening range of occupations and regions,” the Fed said. (…)
The San Francisco Fed reported that “recent changes in immigration policy created substantial labor supply shortages for low-skilled workers in the agriculture sector; as a consequence, some growers discarded portions of their harvest.”
Even with more firms struggling to find workers, the report said there was “little change to the recent trend of modest to moderate wage growth,” though some firms raised pay to attract and keep employees. The Chicago Fed reported a “manufacturing firm that was expanding raised wages for unskilled workers 10% and noted a significant improvement in retention and the quality of applicants.”
Inflation remained tame, with most areas “reporting modest increases” in prices, the report said.
The above account is from the WSJ. Here’s more directly from the Beige Book (my emphasis):
Boston and Chicago signaled that growth in their Districts had slowed somewhat to a modest pace since the prior Beige Book period, while New York indicated that activity had flattened out. Consumer spending softened with many Districts noting little or no change in nonauto retail sales, while auto sales have edged down from last year’s record highs in several Districts (…). Meanwhile, the majority of Districts continued to report moderate growth in manufacturing activity and in most nonfinancial service sectors. Construction of new homes and nonresidential structures also continued to grow at modest to moderate rates, as did sales of existing homes.
(…) most Districts reported that employment continued to grow at a modest to moderate pace. Similarly, most firms across the Districts noted little change to the recent trend of modest to moderate wage growth, although many firms reported offering higher wages to attract workers where shortages were most severe.
But further down, there was more local color on labor:
- Boston:
Respondents in several sectors mentioned tight labor markets. (…) Several manufacturing contacts said it was hard to find qualified workers. A manufacturer of semiconductors and related goods said that they had to raise starting wages to fill vacant positions in New England. A manufacturer of furniture said that retaining new hires was a major challenge as some workers quit within days of being hired. Staffing firms continued to report strong labor demand and tight labor supply. (…) All contacted staffing firms indicated that bill and pay rates had increased. (…) Looking forward, staffing firms are not as optimistic as they were last quarter.
- New York:
The labor market has remained tight. Contacts at employment agencies characterized the job market as steady and fairly tight–especially for engineers and other tech workers, but also for skilled workers more generally. (…) Contacts across all service industries reported moderate wage growth and expect comparable increases to continue in the months ahead. Employment agency contacts in New York City noted a bit more upward pressure on wages and salaries–employers were said to be increasingly negotiable on pay, but mainly for highly sought-after, skilled, and specialized workers. An upstate New York agency indicated that wages have held steady.
-
Philadelphia:
On balance, wage pressures continue to be muted; reports of tight labor markets are scattered by region and occupation. Contacts tend to note significant price increases only in association with commodity price hikes that are more readily passed through to customers. Several contacts from banking and finance noted that wage pressures are real and rising but that firms in many sectors are using technology whenever possible to substitute for labor.
-
Cleveland:
Payrolls grew across a broad range of industries, with continuing wage pressures in some skilled occupations and at the lower end of the pay scale. (…) Because of difficulties in attracting and retaining employees, companies are placing a greater emphasis on expanding benefits and work-life-balance initiatives, while at the same time increasing wages and salaries. Banking contacts noted significant wage pressure for IT staff and compliance personnel. (…) In order to retain drivers, one firm increased driver pay by 3 cents per mile, equating to a 7.5 percent wage increase. Attracting qualified applicants for low-skilled manufacturing jobs is difficult, and many newly hired workers prove to be unreliable. That said, competition for low-skilled workers is strong and is driving up starting wages.
-
Richmond:
Labor demand strengthened moderately in recent weeks amidst continued reports of worker shortages. (…) Wages increased modestly for firms in most industries, and employment agencies said that clients had started to increase wages for positions that remained unfilled.
- Atlanta:
(…) many continued to describe a tightening labor market among information technology, skilled craft and technical, and increasingly in entry-level positions, particularly in hospitality and food services. (…)
- Chicago:
Contacts continued to report that the labor market was tight and that it was difficult to fill positions at any skill level. (…) Wage growth was modest overall, with increases more likely for high-skilled occupations. That said, a manufacturing firm that was expanding raised wages for unskilled workers 10% and noted a significant improvement in retention and the quality of applicants. A number of contacts reported a rise in benefits costs.
- St-Louis:
(…) Contacts continued to report difficulties finding skilled or motivated employees. (…) Contacts reported moderate wage growth since the previous report. On net, 61 percent of contacts reported wages and labor costs were higher or slightly higher than a year ago; however, a slightly smaller share expect increases in the third quarter. Contacts in construction, manufacturing, and banking reported increasing wages to retain and attract employees. (…)
- Minneapolis
Initial unemployment claims dropped by 16 percent over the most recent six-week period compared with a year earlier, and continuing claims dropped by 11 percent. (…) Job openings were growing in the oil-producing area of North Dakota, including for jobs outside energy production. (…) Wage pressure was moderate to strong since the last report. (…) Anecdotally, contacts said average wages were increasing up to 3 percent, with some technical and health care jobs receiving wage increases closer to 5 percent. In Michigan’s Upper Peninsula, construction workers were seeing 3 percent to 4 percent wage increases. A distribution center in southern Minnesota was hiring again and raised starting wages to $17.50 per hour, the third consecutive annual rise in starting wages, according to a local contact. In western Montana, wages were trending upward, but more modestly because “employers tend to tout benefits and working conditions more than wages.”
- Kansas City:
Contacts in most sectors reported moderate wage growth, and anticipated continued moderate wage growth in the coming months.
- Dallas:
Overall employment rose moderately, and upward wage pressures were similar to the last report. Manufacturers added to payrolls, with some noting that labor shortages were putting pressure on wages. (…) energy firms cited upward wage pressures, particularly for certain skills sets and experienced personnel. (…)
- San Francisco:
On balance, the labor market tightened further, and contacts reported continued moderate wage gains. In the technology, financial services, and health-care sectors, demand for skilled information technology (IT) labor remained strong, pushing up wages for those workers. Contacts in the hotel industry noted widespread strong upward wage pressure for all positions, with one contact reporting plans to raise workers’ wages. (…) Cost pressures in the steel industry resulted in employment reductions and slowed wage growth.
It is not easy to bring in a plane for a soft landing when your instrument panel is giving you conflicting signals and you are running out of fuel. This is the challenge facing not just the Federal Reserve, but also a growing number of systemically important central banks around the world. (…)
PROFIT WARNINGS
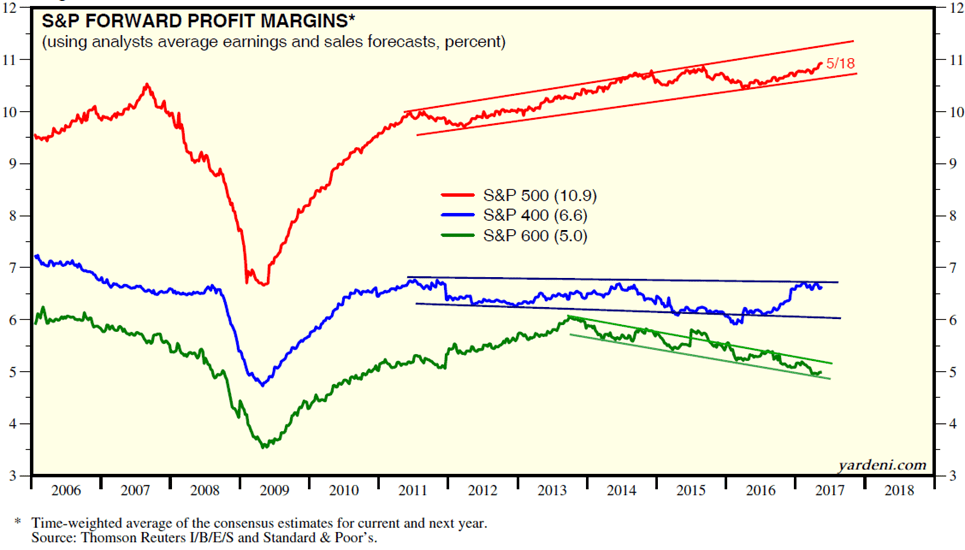
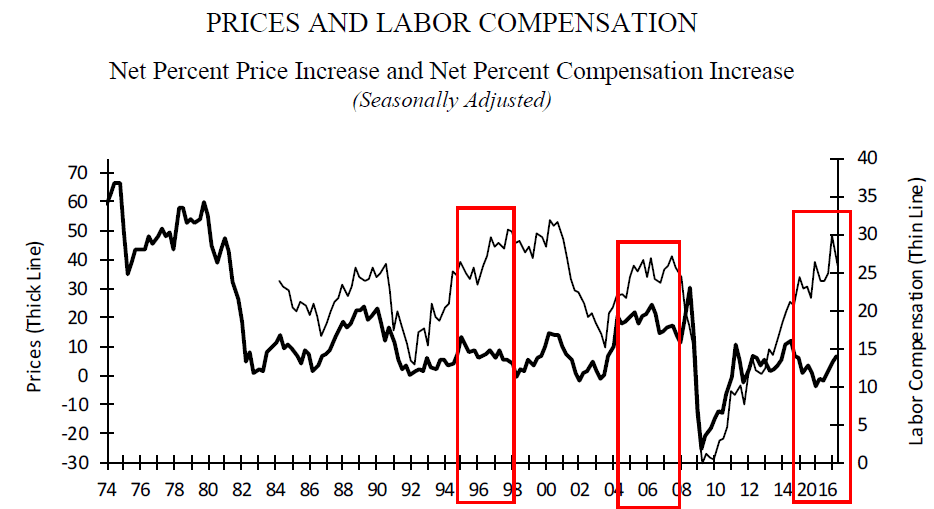
Yesterday I posted on the current negative trends in profit margins (PROFIT MARGINS: THE SQUEEZE IS UNDERWAY). There already is follow-up data.
-
Diners Are Finding $13 Burgers Hard to Swallow America’s favorite food, which once afforded a cheap and portable bite for time-pressed consumers, has gotten too fancy for its own good. The result? Fewer people are choosing burgers as a lunch option.
(…) Lunch traffic to quick-serve hamburger restaurants fell 5% last year—the biggest year-over-year decline that market-research firm NPD Group Inc. has recorded. (…)
The average lunch burger check—including fries and a beverage—has risen 22% since the financial crisis to $5.83, with a 4% increase last year alone, according to NPD. (…)
All restaurant tabs have climbed in recent years as labor costs have risen largely because of state and local minimum-wage increases. The cost of eating out—especially when cooking at home has become cheaper—is a key reason hamburger chains are seeing less foot traffic, NPD restaurant analyst Bonnie Riggs said. (…)
The restaurant industry is in recession: Jan-April 2017, sales are –1.5% YoY following –2.3% in Q4’16.

Here’s why sales are declining:

Here’s why profits are dropping:

-
Fewer Small Caps Are Participating in Earnings Upswing
With the first-quarter earnings season mostly in the books, the result is clear: bigger is better, at least when it comes to GAAP earnings. Excluding energy firms, whose profits can be heavily tied to commodity prices and hedging, 94 percent of S&P 500 companies turned in a profitable quarter, compared to three quarters of those in the Russell 3000. Over the past 20 quarters, the percentage of Russell 3000 firms returning a profit has steadily fallen, even as total U.S. corporate earnings have remained at or near all-time highs. (BloombergBriefs)

There are currently 152 Energy companies in the Russell 3000 Index which means that there are some 700 non-energy companies with negative EPS in that index, 130 (+23%) more than 9 months ago and 270 (+64%) more than in the 4th quarter of 2013 when the margins squeeze of U.S. domestic companies started. People investing in that very broad fund likely are not aware that 25% of their non-energy companies are losing money.
-
EBITDA growth of U.S. non-Energy leveraged loan issuers turned negative in Q1:

 (
(Eurozone manufacturing employment rises at 20-year survey-record pace
The final IHS Markit Eurozone Manufacturing PMI® rose to a 73-month high of 57.0 in May, up from 56.7 in April and unchanged from the earlier flash estimate. Improved business conditions were signalled in seven out of the eight nations covered by the survey. The growth acceleration was mainly driven by a stronger expansion in Germany, where the rate of increase was the fastest in over six years. (… )
Eurozone manufacturing production rose at the fastest pace since April 2011, underpinned by the strongest growth of new work in 74 months. This led to survey-record job creation, with employment rising in all of the nations covered for the first time since last November. (…)
Companies reported improved inflows of new business from both domestic and export markets, with the rate of expansion in new export orders hitting a 73-month record. Levels of new export business improved in almost all of the nations covered, the sole exception being Greece. The standout performer was Germany, where the rate of expansion rose to a seven-year high. (…)
Backlogs of work at manufacturers rose for the twenty-fifth successive month, with the rate of accumulation the highest since April 2011. Supplier capacity was also under strain, as highlighted by the steepest lengthening in vendor lead times for over six years.
These supply chain factors also contributed to a further increase in average input costs in May, continuing the trend towards a sellers’ market developing for many items. However, there were signs that price inflationary pressures were easing from recent highs, as highlighted by slower rates of increase in both input costs (six-month low) and output charges (four-month low).

China PMI signals renewed deterioration in operating conditions
The seasonally adjusted Purchasing Managers’ Index™ (PMI™) posted below the neutral 50.0 value at 49.6 in May. Although only indicative of a marginal deterioration in operating conditions, the index fell from 50.3 to signal the first decline in the health of the sector for 11 months. (…)
Softer growth in output reflected a relatively muted increase in total new orders during May. Furthermore, growth in new order books was also the slowest seen since the current upturn began in July 2016. Data indicated that customer demand was relatively subdued both at home and overseas, with new export sales rising at a similarly marginal pace. (…)
At the same time, employment continued on a downward trend, with the rate of job shedding picking up slightly for the third month running. Notably, it was the quickest decline in workforce numbers seen since last September. (…)
Although purchasing activity fell in May, average delivery times continued to lengthen. A number of panellists blamed longer lead times on stock shortages at vendors.
Manufacturing companies reported the first decline in average cost burdens for nearly a year in May. The rate of reduction was marginal overall, and widely linked by respondents to lower raw material prices. Firms generally passed on any savings to clients, by cutting their output charges for the first time since February 2016.

IMF warns of ‘significant’ risks from Canada’s housing market
Investors still have no place to go Same old conundrum: Take on too much risk, or settle for zero income
Hmmm…
Some of Bob Farrell’s wisdom while you decide:
1. Markets tend to return to the mean over time
2. Excesses in one direction will lead to an opposite excess in the other direction
3. There are no new eras — excesses are never permanent
5. The public buys the most at the top and the least at the bottom
6. Fear and greed are stronger than long-term resolve
7. Markets are strongest when they are broad and weakest when they narrow to a handful of blue-chip names
From other wise people:
- You don’t have to trade with Mr. Market when he wants to, but only when you want to. (Ben Graham)
- Rule No.1: Never lose money. Rule No.2: Never forget rule No.1.
- Cash combined with courage in a time of crisis is priceless.
- I will tell you how to become rich. Close the doors. Be fearful when others are greedy. Be greedy when others are fearful. (W. Buffett)
- You must weigh not only the alluring probabilities of being right, but the dire consequences of being wrong. (Peter Bernstein)
- The stock market is filled with individuals who know the price of everything, but the value of nothing. (Phillip Fisher)
 Better be safe than sorry.

-
US bank stocks head towards bear market territory Fading hopes for Trump agenda leave Goldman Sachs 16.5 per cent below March peak
(…) Bank analysts have been switching “blue-sky earnings scenarios” of late last year with “more cloudy” outlooks, said Fred Cannon, global director of research at Keefe, Bruyette & Woods in New York. He noted, for example, that some brokers were now removing assumptions that the corporate tax code would be rewritten this year from their models. (…)

Morgan Stanley Chief Executive Officer James Gorman indicated his firm is seeing similar trading declines as competitors JPMorgan Chase & Co. and Bank of America Corp., which said second-quarter trading revenue is on pace to drop at least 10 percent.
Markets revenue at JPMorgan was down about 15 percent in April and May from a year earlier, driven by a slump in fixed income, Chief Financial Officer Marianne Lake said Wednesday at an investor conference in New York. At Bank of America, revenue from the business will be 10 percent to 12 percent lower, though first-half results should be stronger, Chief Executive Officer Brian Moynihan said at a separate event. (…)
“There is enormous uncertainty which typically would breed tremendous volatility and it’s not,” Gorman said. “It’s this very passive perspective that investors have and I think the downside risk at this point is outweighing the upside risk.” (…)
-
RBC freezes US acquisition plans on Trump doubts Canada bank chief reluctant to make deals given the political climate
 The Whistleblower Behind Caterpillar’s Tax Headache Could Make $600 Million
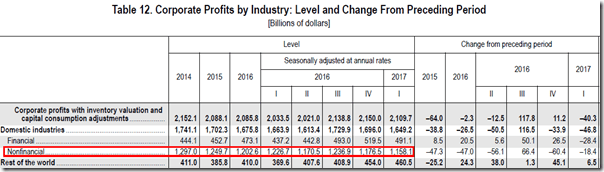
 The bad news is that domestic U.S. profit growth is slowing. Take away the rest-of-the-world profits, and the Commerce Department figures show domestic after-tax profits were down slightly from a year ago, and well off their 2014 peak. That’s a reflection of how rising costs for labor in combination with a slow-growing U.S. economy are grinding down profit margins.