U.S. business activity growth rebounds in May, led by service sector
- Flash U.S. Composite Output Index at 53.9 (53.2 in April). 3-month high.
- Flash U.S. Services Business Activity Index at 54.0 (53.1 in April). 4-month high.
- Flash U.S. Manufacturing PMI at 52.5 (52.8 in April). 8-month low.
- Flash U.S. Manufacturing Output Index at 53.3 (53.5 in April), 8-month low.

The seasonally adjusted IHS Markit Flash U.S. Composite PMI Output Index revealed a modest rebound in private sector business activity growth in May. (…) Faster business activity growth was driven by the service sector (‘flash’ index at 54.0 in May), which more than offset the weakest rise in manufacturing production since September 2016 (‘flash’ output index at 53.3).
Latest survey data indicated that new business growth accelerated to its strongest since the start of
2017, which contributed to a rise in backlogs of work for the first time in four months. Additional
pressure on operating capacity encouraged greater staff hiring in May, with the rate of job creation
edging up to a three-month peak.Measured overall, average cost burdens increased at a robust pace during May. This was driven by the steepest rise in service sector input prices since June 2015. However, manufacturers indicated that cost inflation eased markedly from April’s two-and-a-half year peak. (…)
Service providers noted that improving economic conditions and greater willingness-to-spend among clients had supported business activity growth in May. A more favourable demand backdrop resulted in a marked rebound in new business growth to its fastest since the start of 2017.
Payroll numbers increased at an accelerated pace in May, following the near-seven year low recorded during April. A number of survey respondents suggested that renewed pressures on operating capacity had helped to boost staff hiring in May.
However, service providers’ confidence regarding the 12-month outlook for business activity remained subdued in comparison to the recent peak seen at the start of 2017.
The latest survey also pointed to greater cost pressures across the service economy, which firms
linked to rising staff salaries and higher raw costs (particularly food).Sustained pressure on margins led to the most marked increase in average prices charged by
service sector companies since December 2016.
(…) Some manufacturers suggested that domestic clients had adopted a wait-and-see approach to
investment spending. Meanwhile, new export sales increased only marginally in May, which pointed to a sustained drag from subdued external demand. (…)Chris Williamson, Chief Business Economist at IHS Markit said:
Growth of US business activity gained a little momentum for a second successive month in May,
but the upturn still looks somewhat underwhelming.Historical comparisons of the PMI against GDP indicates that the PMI is running at a level broadly
consistent with the economy growing at a 0.4% quarterly rate (1.5% annualized). Actual second quarter GDP numbers are likely to be considerably stronger, in part reflecting seasonality in the official data and the weak first quarter. (…)Average prices charged for goods and services meanwhile showed one of the largest rises in the past two years. The strengthening of business activity growth and rise in prices will add to
expectations of the Fed hiking interest rates again in June.

DESYNCHRONIZATION
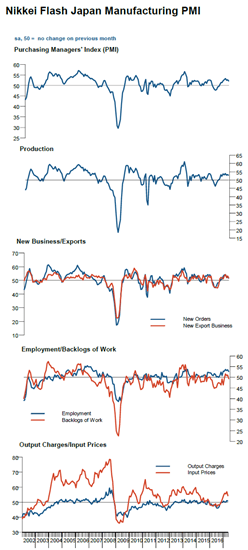
The latest round of flash manufacturing PMIs for May saw the Eurozone in the lead up +0.3 to 57.0 and USA trailing behind, down -0.3 to 52.5 and Japan off -0.7 to 52.0 and left the composite flash Developed Market manufacturing PMI down slightly. It highlights the slight loss of momentum seen in the global economic rebound that got underway last year, as we looked at last week with the OECD leading indicators. (…)
The rebound from the slowdown last year saw a synchronized acceleration in the manufacturing PMIs of the major developed market economies, but this has given way to more desynchronized growth. (Topdown Charts)

-
PRETTY BAD SURPRISE:
-
Taiwan’s industrial production disappointed, ending 8 months of increases. Part of the reason was a contraction in production of computers and optoelectronics – supposedly due to shortages of components. (The Daily Shot)

- China spill-overs should not be ruled-out in the next batch of PMI numbers. (Nordea)
PMI/ISM to be affected by Chinese weakness?

U.S. New-Home Sales Fell More Than Expected in April New-home sales fell sharply in April after reaching a nine-year high the prior month, a possible sign of weaker demand after a run-up in prices.
Purchases of new, single-family homes, which account for a narrow slice of all U.S. home sales, decreased to a seasonally adjusted annual rate of 569,000 in April, down 11.4% from March, the Commerce Department said Tuesday.
The data have a margin of error of 10.5%, and the overall trend remains one of continuing improvement in the market. Before last month, sales had risen for three-consecutive months. (…)
The median sale price for a new home fell in April from a year earlier to $309,200, indicating builders are shifting attention toward starter-home buyers. (…)
 (
(- The most striking feature of this Census Bureau report, however, was the uptick in “starter home” sales. At the same time, some categories of new high-end housing activity had declined. (The Daily Shot)

Moody’s Cuts China Rating on Worries of Economic Growth Moody’s Investors Service cut China’s sovereign credit rating, citing expectations that the country’s financial strength will deteriorate in coming years as debt keeps rising and the economy slows.
(…) In a Wednesday statement, Moody’s said it downgraded China’s rating to A1 from Aa3, while changing its outlook to stable from negative. In March of last year, it cut China’s outlook to negative from stable. (…)
In a statement posted to its website Wednesday, the ministry said the ratings agency’s decision “overestimated the difficulties in the Chinese economy, while underestimated the ability of the Chinese government to deepen supply-side reforms and reasonably expand total demand.” (…)
China’s total debt reached 253% of its gross domestic product last year, up from 213% in 2013 and 149% in 2008, according to J.P. Morgan. (…)
S&P Warns of Possible Brazil Credit Downgrade
Trump’s Path to a Balanced Budget Paved With Accounting Gimmicks
 Consumers Are Still Optimistic About Trumponomics
One of the most unprecedented shifts in economic data following President Donald Trump’s election victory in November has been the surge in optimism on government economic policy. Despite recent political controversies, this trend has continued — at least in the eyes of U.S. consumers. (…)

One lingering issue facing President Trump is that this optimism hasn’t yet translated into hard economic data. Whilejob growth has remained strong, hard economic data, including retail sales, has been disappointing analysts’ expectations. (…) (Bloomberg Briefs)
Hard Data Disappointing Expectations, Survey Data Soaring
Here’s a longer term chart from STA:

DEFLATING DEFLATION
We must always be vigilant when presented with street economic analysis and forecasts. Official data can also be dubious.
Canadian inflation data for April surprised on the downside even though the economy is pretty strong overall. Canadian core inflation slowed to +1.5% in April after reaching +2.2% in January. The Bank of Canada’s core measures averaged a low 1.4% in April.

Here’s the Bank of Canada’s three inflation measures:

The always excellent team of economists at National Bank Financial dug deeper to discover some really astonishing data:
Canadian CPI inflation continues to surprise on the downside despite robust GDP growth, low unemployment, surging home prices, and a depreciating currency. What’s helping keep inflation down? Shelter costs!
This heavyweight component of the CPI (27% of the index) is currently growing an anemic 2.2% annually compared to a more robust 2.7% for all other services (a two-year high by the way). As today’s Hot Charts show, the price of shelter in Canada is only up a cumulative 5.7% since 2014 compared to 8.2% for all other services (that’s a sizeable difference of 44%).
In order to understand the divergence, we dug a little deeper and found that the new home price index (NHPI) for Vancouver that is used in the CPI calculation is essentially unchanged since 2008 for both its house and land components. As a result, the Homeowner’s Replacement Cost component of the CPI (20% of shelter costs) is no higher in British Columbia than it was in… 2005! Note that the NHPI is also used for the calculation of the Mortgage Interest Cost component of the CPI (12% of Shelter costs) which, incidentally, remains stuck at a decade low.
We are also baffled by the reported cumulative increase of only 37% for the Toronto NHPI since 2008 (vs. 118% according to resale market data).
Also helping keep inflation in check, the Rent component of the CPI (22% of shelter costs) shows rent inflation averaging near a record low of 1% in Toronto, Montreal and Vancouver. Bottom-line: Shelter Cost inflation reported in the Canadian CPI report is eerily low.
In truth, it is eerily wrong as everybody living in Vancouver or Toronto would confirm.
ALT-VALUATIONS
Good table from Lance Roberts: