The enemy of knowledge is not ignorance, it’s the illusion of knowledge (Stephen Hawking)

It ain’t what you don’t know that gets you into trouble. It’s what you know for sure that just ain’t so (Mark Twain)

Invest with smart knowledge and objective odds

THE DAILY EDGE (20 September 2016): China’s Banking Crisis?

U.S. housing starts take a breather; single-family permits rise

Groundbreaking decreased 5.8 percent to a seasonally adjusted annual pace of 1.14 million units, the Commerce Department said on Tuesday.

Permits for future construction slipped 0.4 percent to a 1.14 million-unit rate last month as approvals for the volatile multi-family homes segment tumbled 7.2 percent to a 402,000 unit-rate. Permits for single-family homes, the largest segment of the market, surged 3.7 percent to a 737,000-unit pace. (…)

The drop left starts just below their second-quarter average. (…)

Groundbreaking on single-family homes dropped 6.0 percent to a 722,000-unit pace in August, the lowest level since last October. (…) Housing starts for the volatile multi-family segment

fell 5.4 percent to a 420,000-unit pace.

U.S. Home-Builder Gauge Matches Highest Level Since 2005 Confidence among U.S. home builders about the market for single-family homes rose this month to match its highest level in 11 years, suggesting rising demand for new residential construction that could boost the broader economy.

The National Association of Home Builders housing-market index increased six points from the prior month to a seasonally adjusted 65 in September, the trade group said Monday. The August reading was revised down to 59 from a previously reported 60. A number over 50 indicates more builders view conditions as good than poor. (…)

Monday’s report showed a measure of builders’ views about the present market jumped to 71 this month from 65 in August. An index of their outlook for the market over the next six months rose to 71 from 66. A third component, measuring traffic of prospective buyers, rose to 48 from 44.

Haver Analytics says that during the last ten years, there has been an 72% correlation between the y/y change in the home builders index and the y/y change in housing starts.

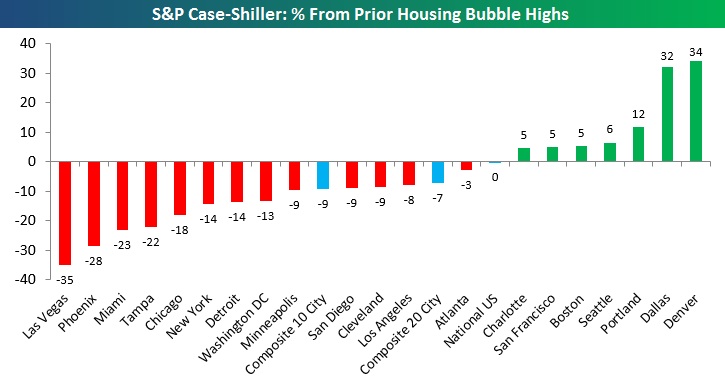
These Bespoke Investment charts suggest that it doesn’t get much better:


HOTEL DEMAND SLOWING

In CETERIS NON PARIBUS and HARD HAT ZONE, I argued that corporate demand for hotels would wane as corporate budgets need to adjust to lower profits. From the recent Hotel Data Conference in Nashville, Tennessee:

STR President and CEO Amanda Hite said the company has revised its 2016 full-year forecast to 3.2% growth in revenue per available room, down from 4.4%. STR also expects completely flat occupancy for the year with 3.2% average-daily-rate growth. Earlier in the year, the company had projected 0.4% occupancy growth with 4% ADR growth.

Hite said the relatively mild rate growth continues to confound.

“The deceleration of growth is not surprising, but it’s happening faster and earlier in the year than expected,” Hite said. “(The lack of rate growth) is always puzzling for us and has been for the past three years. The fundamentals say we should be able to achieve higher rate growth.”

But the puzzle is easy to understand in light of 6 consecutive quarters of declining corporate profits. These charts are from a Smith Travel Research presentation on September 15: (charts courtesy of STR via Hotel News Now:

  • Total demand growth has slowed below the last slowdown level:image
  • Transient demand has flattened:image

But corporate demand threatens to turn negative:image

FedEx Details Plans to Raise Rates Next Year FedEx Corp. said its will raise shipping rates starting next year, including an average increase of 3.9% at its air-shipping Express division and 4.9% for its ground and home-delivery services.

The shipping giant’s plan comes after rival United Parcel Service Inc. recently unveiled an average rate increase of 4.9% to help pay for system upgrades and expansion.

KESSLER: CONTRARIAN TREASURIES

A Wealthtrack interview with a contrarian who has been correct on interest rates and the value of U.S. Treasury bonds for years, Kessler Investment Advisors’ Robert Kessler.

China’s Loan Demand Weakens to Historic Low

The willingness of Chinese companies to borrow reached a 12-year low in the third quarter, according to a survey published by the country’s central bank on Sunday.

Amid an economic slowdown, the overall index of loan demand was at 55.7 in the third quarter, the lowest since the People’s Bank of China started to compile the data in 2004. The index of loan demand from medium-sized enterprises fell to 52 and for small business to 55.8, both historic lows. However, the figure for large corporations slightly rebounded at 51.4, up 0.1 points from a quarter earlier. (…)

Banks have imposed tougher rules on approving loans to SMEs amid rising non-performing loans. Tighter restrictions, in turn, have cooled companies’ enthusiasm to seek new funds from banks, the manager said. Twenty percent to 30 percent of his business customers haven’t repaid their debt, he said.

Twelve out of China’s 16 publicly listed banks saw a rising level of non-performing loans in the first half of 2016 compared with the same period a year before.

The demand by manufacturers for loans declined in the third quarter, falling to 46.8 from the second quarter’s 48.

The PBOC’s index of loan demand from the non-manufacturing sector remained unchanged at 55.1.

Pointing up More than half of the bankers from the 3,100 institutions surveyed by the central bank said the national economy in the third quarter was “cooling down,” while 44.6 percent of them thought the overall trend looked “normal.”

Of the 20,000 residents surveyed, 53.7 percent said the housing prices are “high and unacceptable,” 0.3 percentage points more than in the second quarter. Only 3.4 percent described prices as “satisfactory,” and the remaining 42.9 percent considered them “acceptable.”

Mr. Li does is more optimistic:

China’s economy has shown a steady upward trend and has huge room for maneuver while there’s no basis for a sustained depreciation of the nation’s currency, said Premier Li Keqiang.

Li, speaking as he met with President Barack Obama in New York, said the yuan will stay basically stable and at a reasonable and balanced level. Those comments echo the government’s recent commentary on the currency.

Maybe shadow banking is helping, for now:

The brokerage estimated the potential bad debt ratio for “bank-related shadow financing” at 16.4 percent, or 4.2 trillion yuan, in a report released to the media in Hong Kong on Tuesday. Assuming a 40 percent recovery rate left a potential loss of 2.5 trillion yuan. (…)

(…) China’s problem is internal credit. The risk is that a fresh spate of capital outflows will force the central bank to sell foreign exchange reserves to defend the yuan, automatically tightening monetary policy. In extremis, this could feed a vicious circle as credit woes set off further outflows.

The Chinese banking system is an arm of the Communist Party so any denouement will probably take the form of perpetual roll-overs, sapping the vitality of economy gradually.

The country was able to weather a banking crisis in the late 1990s but the circumstances were different. China was still in the boom phase of catch-up industrialisation and enjoying a demographic dividend. 

Today it is no longer hyper-competitive and its work-force is shrinking, and time the scale is vastly greater.

Oil Investors Flee as OPEC Freeze Hopes Face Supply Reality

THE DAILY EDGE (19 September 2016): CPI vs PCE Inflation

U.S. Consumer Prices Rose 0.2% in August Consumer prices moved higher in August, a sign that U.S. inflation may be continuing to firm after years of sluggish price growth.

Excluding the often-volatile categories of food and energy, so-called core prices rose 0.3%, the largest increase since February.

The strong gains reflected a sharp increase in medical-care prices—up 1%, the largest one-month jump in the category since February 1984. (…)

Compared with a year earlier, overall prices rose 1.1% in August and core prices were up 2.3%. On an annual basis, food prices were unchanged last month—the weakest reading on food inflation since February 2010—and energy prices were down 9.2% on the year. Shelter costs were up 3.4% compared with a year earlier.

  • MEDIAN CPI UP 0.2% IN AUGUST

According to the Federal Reserve Bank of Cleveland, the median Consumer Price Index rose 0.2% (2.8% annualized rate) in August. The 16% trimmed-mean Consumer Price Index also rose 0.2% (2.6% annualized rate) during the month. The median CPI and 16% trimmed-mean CPI are measures of core inflation calculated by the Federal Reserve Bank of Cleveland based on data released in the Bureau of Labor Statistics’ (BLS) monthly CPI report.

Over the last 12 months, the median CPI rose 2.6%, the trimmed-mean CPI rose 2.1%, the CPI rose 1.1%, and the CPI less food and energy rose 2.3%.

image

  • CPI VS PCE INFLATION

The Fed’s 2% inflation target is based on the Commerce Department’s personal-consumption-expenditures price index. That gauge rose 0.8% in July from a year earlier, and prices excluding food and energy were up 1.6% on the year for the fifth consecutive month.

Growth in core prices tracked by the Labor Department gauge has been higher than growth in core PCE prices, in part because fast-growing housing costs make up a larger share of the basket of goods and services tracked by the CPI.

Another divergence: prices in the health-care sector. The CPI’s gauge of medical-care costs has surged in recent months, building to annual growth of 4.9% in August from 4% in July, 3.6% in June and 3.2% in May. Annual growth in prices for health-care services as tracked by the PCE index has been lower and more stable, hovering around 1% so far this year through July; August data are due out at the end of the month. (…)

This chart plots core CPI and core PCE inflation since 1960. Between 1960 and 1985, they were pretty similar except for 3periods when CPI really overshot. Curiously, CPI inflation regularly exceeded PCE inflation since 1985.

image

This chart plots the gap between CPI and PCE inflation (core) since 1985.

image

Jo Craven McGinty in the WSJ in March 2015:

(…) The PCE includes a broader range of expenditures than CPI. It’s weighted according to data provided in business surveys, rather than the less reliable consumer surveys used to weight the CPI. And it uses a formula that adjusts for changes in consumer behavior that occur in the short term, something the standard CPI formula doesn’t do.

The result is a more comprehensive, if less familiar, gauge of inflation. That’s important for the Fed, which regards a small amount of inflation as a sign of a healthy, growing economy.

(…)  the CPI (…) captures only what urban consumers spend out-of-pocket for a common basket of goods and services. (…)

PCE, on the other hand, includes all goods and services consumed in the U.S. whether they are purchased by consumers or by employers or federal programs on behalf of consumers.

Medical expenses provide a good example of the differences in approach the gauges take. The CPI includes only the co-payments paid directly by consumers in its calculation, while the PCE captures co-payments as well as costs covered by employer-provided insurance and government programs.

(…) “CPI is just out-of-pocket cost. If it’s paid by Medicare, it doesn’t count. If it’s paid by private insurance, it doesn’t count.”

Because PCE and CPI use different data sources, the relative weights assigned to comparable items differ.

PCE, which is published by the U.S. Commerce Department’s Bureau of Economic Analysis, is derived from retail-sales data collected in business surveys, and in this data, medical care tends to carry the greatest weight. The CPI, on the other hand, is derived from consumer purchases reported in household surveys. Typically, consumers report spending more on shelter than anything else, giving that category more weight in the CPI. (…)

The CPI uses fixed weights generated from a basket of goods that is updated every two years, which doesn’t allow for the introduction of new products or price changes in the interim that might cause consumers to substitute one item for another. (…)

The PCE accounts for this by using chained weighting. For example, if apples suddenly become very expensive, consumers may not buy as many. As a result, the apples will have one weight in one reporting period, and a different weight in the next. The chain-weight index essentially takes the average of the two. (…)

In reality, the divergence in the two measures comes mainly from shelter and healthcare.

The CPI includes Americans’ actual out-of-pocket spending on healthcare. The PCE measure is impacted by congressionally administered costs for Medicare and Medicaid. Unsurprisingly, what ordinary people pay directly is a lot more expensive than what large organizations pay, particularly if they are governmental.

As a result, CPI-Medical Care has been rising much faster than PCE-Health Care:

image

Until the mid-nineties, both series behaved generally similarly, give or take.

image

Over the last 15 years, however, health-care related inflation has been measurably higher through the CPI. The gap between the two series has ranged between 0.5% and 1.5% YoY. The gap widened to +2.0% in 2015 and was +2.3% during the first 6 months of 2016, accounting for nearly half of the current +0.6% gap between core CPI and core PCE, even if PCE-Health Care weighs more than CPI-Medical Care.

image

But the gap widened even more in July (+3.0%) and August (the PCE August data are due out at the end of the month) as the CPI-Medical Care component exploded at a 7.8% annualized rate between May and August with both major components contributing (MoM June, July, August, (Aug. YoY)):

All Medical Care:                      +0.4%  +0.5%  +1.0%  (+4.9%)
   Medical care commodities   +1.1%  +0.4%  +1.1%  (+4.5%)
      Prescription drugs              +1.3%  +1.9%  +1.3%  (+6.3%)
   Medical care services:          +0.2%  +0.5%  +0.9%  (+5.1%)
      Physicians’ services           +0.3%  +0.7%  +0.7%  (+4.3%)
      Hospital services                 +0.1%  +0.4%  +1.7%  (+6.2%)
      Health insurance                  +0.4%  +0.7%  +1.1%  (+9.1%)

Meanwhile, PCE-Health Care inflation has been very low so far in 2016 rising only 1.0% YoY in Q2.

This ain’t just an academic exercise. The CPI measures out-of-pocket expenses, i.e. real cash outflow from consumers’ pockets. One, that helps explain why consumer spending remains muted and spotty. Medical costs (10.6% of core CPI, 18% of PCE) are not discretionary. Two, it raises the question as to whether the PCE is currently such a better gauge of inflation if a large part of the gap is because “institutional” prices are rising much less than “consumer” prices.

With an average age of 62, the 10 FOMC members must understand medical expenses although the gap between their remuneration and that of the average American can blur their appreciation of what medical inflation is in real life.

And given all the M&A activity in that sector and the aftermath of the Affordable Care Act, health care inflation does not seem about to abate.  From Casey Research:

  • Earlier this year, Pennsylvania-based insurer Highmark announced a 41% price increase for 2017 health insurance plans. It’s one of the state’s largest health insurance companies. The company said other insurers across more than 20 states asked for increases of 25% or more.
  • Blue Cross Blue Shield of Montana announced a 62% price increase for 2017 rates. In 2016, it implemented a 22% increase. Anthem Inc. will raise rates on Connecticut customers by 27% next year. The list goes on…
  • 33% of U.S. counties will only have one health insurance option next year. Another 33% will only have two. Without competition, there’s no limit on how high premium costs can go in these areas.

Anyhow, the point is that the Fed’s focus on PCE is getting more and more questionable given trends in health care and most everything shelter related. FYI, shelter weighs for 15% of PCE, less than half shelter’s 33% CPI weight. Which one is more representative of most Americans’ P&L statement? (Chart from The Daily Shot)

If you had a say at the FOMC meeting this week, would you be in the noflation camp, as “data dependent” as you might be?

image

After a loooong 18 months of negative surprises, the ESI jumped positive on better jobs growth in the summer, only to return negative recently. The Atlanta Fed GDPNow estimate for Q3 is +3.0% (Sep. 15, next update Sep. 20), down from +3.5% early in September while the NYFed Nowcast was at +2.8% On Sep. 9. (next update Sep. 23). The NYF currently sees +1.7% in Q4…(two charts below from Ed Yardeni)

image

Meanwhile, FOMC members (also named Federal Open Mouth Committee) keep tripping over themselves to publicly speak their mind, only to confuse everybody and embarrass the chair. This supposedly data dependent Fed, most particularly its chair, seems locked in its we-need-to-raise-rates rhetoric. The risk of policy errors is not low, both on economic and inflation trends. Ben Hunt explains why he expects a rate hike this week in an interesting piece on the decision making process.

All this when the expensive S&P 500 Index is bouncing repeatedly on its 100-day m.a. (2123), still 3.5% above its flattening 200-day m.a.(2060), with the Transports’ continued refusal to acknowledge a new uptrend. In mild corrections, the S&P 500 tends to drop around its 200-day m.a.. In more serious ones, it often dives 5-10% below like in 2010, 2011 and 2015-16.

image

Should the S&P 500 correct to 7% below its 200 day m.a. to 1915, the Rule of 20 P/E would be back to 19.0, its floor since October 2013 if we exclude the more severe early 2016 correction which brought the Rule of 20 P/E to 18.3 (1850 on current parameters).

image

Markets Have Become More Dependent on Central Banks, Says BIS Recent developments in financial markets underscore how dependent they have become on central banks, the chief economist of the Bank for International Settlements said.

(…) “It is becoming increasingly evident that central banks have been overburdened for far too long,” said Claudio Borio, chief economist at BIS, a Switzerland-based consortium of central banks. (…)

“There has been a distinctly mixed feel to the recent rally—more stick than carrot, more push than pull, more frustration than joy,” said Mr. Borio. “This explains the nagging question of whether market prices fully reflect the risks ahead. Doubts about valuations seem to have taken hold in recent days. Only time will tell.” (…)

Trump’s trade policies would send US into recession, study says Clinton’s approach would be harmful’, Trump’s ‘horribly destructive’
Slump in US imports threatens to derail emerging market growth Demand at post-crisis low with China hard hit

(…) Data from the US Federal Reserve show that US merchandise imports from China, the vast majority of which are manufactured goods, have been contracting in value terms since March and in volume terms since April.

Elissa Braunstein, an economist at the UN Conference on Trade and Development (Unctad), said the drop in imports was puzzling due to reports of a recovery in US demand and the strong dollar, which should make imports cheaper and boost demand. (…)

“This is a real worry,” said Simon Evenett, head of the independent Global Trade Alert, which monitors international trade policy. “Most people’s explanation for slowing global trade is that it’s due to China sucking in less imports. But [the US data] point to flat or falling imports in the industrialised countries. The US is in more trouble than people realise.”

He said recent data showing a weaker than expected factory sector in the US added to concerns that the woes of US manufacturing may be spreading to emerging markets through the channel of trade. (…)

China financial stress indicator hits record high as debt surges BIS data shows credit-to-GDP ratio far above historical trend

(…) The BIS is primarily concerned with the accelerating pace at which the debt is being accumulated in China. Its “credit gap” benchmark measures the difference between current debt-to-GDP ratio and that ratio’s long-term historical trend. The BIS rates a reading above 10 per cent as cause for concern; China’s gap hit 30.1 per cent in March.

According to the BIS, this benchmark “has been found to be a useful early warning indicator of financial crises”. (…)

Overall, China’s debt is not high in absolute terms when compared to other large economies. Including government debt, BIS estimates China’s total credit outstanding at $27.2tn, or 255 per cent of GDP, by the end of March. That’s lower than the Euro area at 271 per cent, the United Kingdom at 266 per cent, and Japan at 394 per cent. The aggregate ratio for all advanced economies of 279 per cent. 

Yet the speed at which China’s debt has accumulated — up from 147 per cent of GDP at the end of 2008 — raises special concerns, economists say. It is difficult for any country to invest such a large amount of capital efficiently within a brief period. The IMF estimated in June that $1.3tn in credit was outstanding to companies without enough cash flow to make interest payments. Excessive borrowing also explains why it now takes more than three units of new credit to generate one additional unit of GDP, up from less than 1.5 in 2008, according to the IMF. (…)

Many analysts believe that China’s low level of foreign currency debt and its government-controlled banking system make crisis less likely. (…)

OPEC Chief Says Members Won’t Make Output Decision in Algiers

Mohammed Barkindo, the secretary-general of the Organization of the Petroleum Exporting Countries said late Saturday that no decision would be made at informal talks among the cartel’s members in Algeria next week.

“It is an informal meeting, it is not a decision-making meeting,” Mr. Barkindo told Algerian state media organization APS on Saturday night. (…)

The biggest problem facing OPEC advocates of a freeze are three countries—Libya, Iran and Nigeria—which combined want to increase their own output by about 1.5 million barrels a day this year.

Libya provided the most recent setback when top oil officials said they planned to quickly increase oil exports after control of several key ports changed hands in recent fighting. If the security situation remains under control, Libyan officials said the oil industry could produce up to one million barrels of oil a day, up from 280,000 a day in August.

“Definitely we will not agree to a freeze without reaching our quota from before,” Libya’s OPEC envoy Mohamed Oun told The Wall Street Journal, referring to 1.6 million barrels a day, the amount OPEC expected Libya to produce before the death and ouster of dictator Moammar Gadhafi sent the country into political chaos. (…)

Heavy-Equipment Glut Weighs on Machine Makers Used machinery is flooding the secondhand market, piling more pain on equipment makers battling slack demand amid a global commodities slump.

(…) The strong U.S. dollar also is damping demand from developing African and Asian markets that once snapped up used machines. (…) “It’s as bad as it’s been in my 30 years,” Mr. Yurkovic said. “A lot of renting. Not a lot of buying.” (…)

With so much equipment up for grabs, used-machinery prices are down 10% from a year ago, Caterpillar says. Its dealers also are under pressure to keep up with price discounts on competitors’ new equipment. Lower prices for new machines provide further downward pressure on used values. (…) Rental businesses account for half of new equipment sales in the U.S., and some analysts see that climbing to 60% within five years. (…)

According to Barclays Research, almost 40% of construction-equipment sales financed by Deere’s credit unit are for leases, up from about 30% two years ago and double a decade ago. Half of Volvo’s financed construction-equipment sales are for leases, up from a quarter 10 years ago, according to Barclays. (…)

Merkel’s Party Suffers Worst Berlin Loss of Postwar Era

Chancellor Angela Merkel’s party was dealt another blow in a regional election, posting its worst result in Berlin since the end of World War II as the anti-immigration Alternative for Germany extended its challenge to the political establishment by siphoning off voters. (…)