The enemy of knowledge is not ignorance, it’s the illusion of knowledge (Stephen Hawking)

It ain’t what you don’t know that gets you into trouble. It’s what you know for sure that just ain’t so (Mark Twain)

Invest with smart knowledge and objective odds

NEW$ & VIEW$ (8 MARCH 2016): Recession Watch

RECESSION WATCH
U.S. Labor Market Conditions Index Falls to New Low

The Labor Market Conditions Index from the Federal Reserve Board includes 19 indicators of labor market activity, covering the broad categories of unemployment and underemployment. These include jobs, workweeks, wages, vacancies, hiring, layoffs, quits and surveys of consumers and businesses. Because the trends in the index are slow-moving, Haver presents only the changes in the index. All are measured monthly and have been seasonally adjusted.

During February, the index deteriorated to the greatest degree since June 2009, the last month of the recession. Last month’s weakening runs counter to the improvement in payroll employment reported Friday, because it also reflects other weaker indicators in the report, including the stable unemployment rate, the decline in hours worked, the drop in average hourly earnings and the rise in the average duration of unemployment. During all of last year, the index rose moderately following a stronger performance in 2014. During the last ten years, there has been an 85% correlation between the change in the index and m/m growth in nonfarm payrolls.

large image

Doug Short gives us more about this new indicator:

The indicator, designed to illustrate expansion and contraction of labor market conditions, was initially announced in May 2014, but the data series was constructed back to August 1976. Here is a linear view of the complete LMCI. We’ve highlighted recessions with callouts for its value the month recessions begin and for the latest index value.

Labor Market Conditions Index

As we readily see, with the exception of the second half of the double-dip recession in the early 1980, sustained contractions in this indicator is a rather long leading indicator for recessions. It is more useful as a general gauge of employment health. Note that in the most recent FOMC minutes for January 26-27, the phrase “labor market conditions” was used nine times. Maximum employment, after all, is one of the Fed’s twin mandates.

Interestingly enough, the FEDS Notes article announcing the indicator doesn’t chart the complete series with monthly granularity. Instead, the authors use a column chart to show blocks of six-month averages for the two halves of each calendar year since 1977. This approach further supports the use of the indicator as a general gauge of health. Here is our larger version of the same graphic model.

Labor Market Conditions Index 6-Month Blocks

We couldn’t resist the urge to create a chart of the more conventional six-month moving average of the indicator. Note that we’ve adjusted the vertical axis to capture the depth of the contraction during the last recession.

Labor Market Conditions Index 6-month Moving Averages

Looks like the FOMC won’t get too giddy after last week’s employment report. Doug’s charts are good stuff for recession callers. At a minimum, the LMCI supports Lael Brainard’s call for “risk-management” (see below). But what about inflation, the other Fed mandate? Drew sent me a link to Kessler’s blog which argues that the recent inflation  flare is only normal in the context of a business cycle.

The typical business-cycle sequence is that the manufacturing sector weakens first, then employment and consumer spending, and lastly, inflation. In fact, it is often not until the recession is over that inflation begins to come down. Inflation is the longest lagging indicator.

In fact, most past recessions were actually caused by the Fed precisely to kill inflation so there is no surprise that inflation would peak after recessions began. Kessler’s point is really to reinforce its view that “we have entered or will soon enter a full blown US recession”.

As we have pointed out here and here, manufacturing has clearly turned down in a way (3 independent indicators) that has not failed in calling an upcoming recession.

It is tempting to say that Kessler, “Specialists in US Treasuries”, are talking their book. Yet, they do serious research:

We know that the U.S. manufacturing industry is in recession. We also know that it now represents a much smaller percentage of the economy which might tempt us to dismiss its contraction. Yet, we should also understand that an important part of the service economy is dependant on manufacturers’ activity. Ask retailers, bankers, accountants etc. in Houston, Oklahoma or North Dakota.

While a lot of economists and investors have been comforted by the bedtime story of a puny and unimportant manufacturing sector, that story has been nothing but a misleading fractured fairy tale. Manufacturing is an important sector and while its employment share is low, goods drive a lot of activity and the sector is much more important than just its employment share. There is a new piece of research (here) from the MAPI Foundation that uses input-output analysis to show the fully integrated impact of the manufacturing sector in the context of the U.S. economy. The report (…) goes on to look at the full output and employment effects of bringing a manufacturing dollar’s-worth of product to market. It finds a surprising substantial impact

Viewed in this way, the U.S. manufacturing footprint and multiplier rise sharply. It is still not fair to call these effects either `manufacturing’ jobs or spending (they might be in some cases), but it is fair to call it a broader manufacturing sector impact. And this report helps to explain why the tiny-seeming manufacturing David is felling the service sector Goliath. (Robert Brusca)

This may explain the recent surprise drop in the U.S. Services PMIs with Markit’s falling into contraction territory and the ISM Services employment index declining sharply to 49.7 in February.

image

Markit digs further:

Markit’s manufacturing and services PMIs collectively showed the economy grinding to a halt in February, as signalled by a composite Output Index reading of 50.0. This was its lowest level since the financial crisis with the sole exception of October 2013, when the government shutdown disrupted business.

The more detailed sector data revealed how three out of the seven monitored sectors – healthcare, technology and industrials – slipped into decline in February, the most since the series began in October 2009. In January, only one sector – consumer services – had been in decline, and that in part reflected adverse weather.

While the remaining sectors noted growth of activity, the respective rates of expansion were modest at best.

A survey-record decline in output meant that healthcare was bottom-ranked in February. Underlying data showed that the downturn was driven by a first reduction in new orders since the series began almost six-and-a-half years ago.

The next two worst-performing sectors were technology and industrials, where output fell for the first time in 28 and 41 months respectively.

Growth of new business was relatively subdued in both cases. Despite slower growth of output, companies based in healthcare, technology and industrials continued to raise employment, pointing to lower productivity.

Meanwhile, consumer goods and financials had been the two best-performing groups in January, but marked slowdowns in output growth saw them slip to third and fourth place respectively. In particular, financial services activity rose at the weakest pace in over three years amid a near-stagnation in new work.

Data were slightly brighter for consumer services and basic materials. The modest rise in consumer services activity was enough for the sector to climb to the top of the rankings, though this was in part likely to have reflected a temporary rebound after severe weather disrupted the leisure sector in many states in late January.

Hmmm…can’t wait to see the March employment report. Meanwhile, the cheerleaders keep hopping (or hoping…):

(…) In a call for a “reality check”, Olivier Blanchard, former chief economist of the International Monetary Fund, and his colleagues at the Peterson Institute of International Economics say that global economic pessimism in 2016 has been in contravention of basic economic facts. (…)

While there were challenges across the world, notably from slow productivity growth, “most of the major economies, starting with China and the US, are growing more sustainably now than a decade ago, at their slower rates”, he said. “All the more reason then not to allow ourselves to be distracted by a financial market tail wagging the macroeconomic dog.”

The report notes that despite low oil prices hitting investment in energy projects in the US, jobs growth in the country is strong, as are real income growth and household spending.

Though Chinese growth was slowing, consumption was also rising strongly and the overhang of unsold property was getting smaller, raising hopes that the Chinese authorities could use the time to restructure over-indebted state-owned enterprises often in the heavy industrial sector. (…)

U.S. Consumer Borrowing Slows Amid Market Turmoil Borrowing by U.S. consumers slowed at the start of the new year, a possible sign of caution among households at a time of volatility in global financial markets.

Outstanding consumer credit, a measure of non-real estate debt, rose by a seasonally adjusted $10.54 billion in January from the prior month, the Federal Reserve said Monday. The 3.58% seasonally adjusted annual growth rate was the slowest growth pace since March 2013; in dollar terms, it was the smallest increase since November 2013. (…)

Consumer credit rose at a 7.28% pace in December, revised up slightly from an earlier estimate.

Revolving credit outstanding, mostly credit cards, decreased at a 1.35% annual pace in January compared with growth at a 7.05% pace in December. It was the first monthly decline for revolving credit since February 2015.

Nonrevolving credit outstanding, including student and auto loans, increased at a 5.36% annual pace in January compared with December’s 7.36% growth rate. (…)

Haver Analytics has another viewpoint: U.S. Consumer Credit Usage Increases

Consumer credit outstanding increased $10.5 billion during January (6.5% y/y) following a $6.4 billion December rise, revised from $21.3 billion. Action Economics Forecast Survey participants looked for a $17.0 billion January increase. During the last ten years, there has been a 46% correlation between the y/y growth in consumer credit and y/y growth in personal consumption expenditures.

Nonrevolving credit borrowing grew $11.6 billion (6.9% y/y) after a $0.9 billion increase, changed from $15.4 billion reported last month. Revolving consumer credit in January fell $1.1 billion (+5.3% y/y) following a little-revised $5.5 billion gain.

large image

Now Coming to the Commercial Property Market: Defaults

(…) New signs of weakness are surfacing in the commercial property market, ending a half-decade run of improvement with steadily climbing values. Amid global shifts like the sluggish Chinese economy and a new era of low oil prices, defaults on loans are popping up in areas that were considered overheated, occurring in small numbers for now, but stoking fears that more could be on the way. (…)

“We’re at the top of the market,” said Kenneth Riggs, president of Situs RERC, a real-estate research firm that advises investors on property values and market direction. “There’s going to be a market correction.” (…)

Meanwhile, loans are becoming harder to secure even for safe investments such as well-leased buildings. That is because broader market volatility has caused lenders who sell off their loans via bonds known as commercial mortgage-backed securities to grow wary. While the segment made about $100 billion in loans last year, it has grown to a virtual halt today, lending executives said. If that continues, it will become more difficult for landlords who took out 10-year loans in 2006 to refinance today. (…)

Fed’s Fischer sees ‘first stirrings’ of rising inflation

(…) In a speech to a group of business economists in Washington on Monday, Stanley Fischer, the Fed’s vice-chairman, dismissed critics within the profession who have pointed to wage stagnation in the US as evidence that the traditional link between strong employment and inflation “must have been broken”. 

“I don’t believe that. Rather the link has never been very strong, but it exists, and we may well at present be seeing the first stirrings of an increase in the inflation rate — something that we would like to happen,” he told the National Association of Business Economists. (…)

Speaking across town to a group of bankers on Monday, Lael Brainard, a member of the Fed’s board of governors who has emerged in recent weeks as one of its most vocal doves, said the Fed still needed to be mindful of “weak and decelerating foreign demand”. It meant policymakers should not take “the strength in the US labour market and consumption for granted”, she said. 

“Tighter financial conditions and softer inflation expectations may pose risks to the downside for inflation and domestic activity,” she said. “From a risk-management perspective, this argues for patience as the outlook becomes clearer.” 

She also warned that the FOMC “should put a high premium on clear evidence that inflation is moving toward our 2 per cent target” and that “inflation has persistently underperformed relative to our target”. (…)

China’s Exports Tumble Amid Broad Slowdown

China’s customs administration reported Tuesday that exports fell 25.4% in dollar terms year-over-year last month, compared with a drop of 11.2% in January. Though last month’s long Lunar New Year holiday contributed to the decline, the figure was much worse than a median forecast for a 15% slide by 17​ economists surveyed by The Wall Street Journal.

Imports also declined, falling 13.8% last month, the agency reported, compared with an 18.8% drop in January, in a further cooling of demand in China that is affecting its Asian neighbors. China’s trade surplus narrowed in February to $32.59​ billion from $63.29​billion in January, falling short of the median forecast of a $51.25 billion surplus. ​​(…)

The poor export showing dovetails with trade results from other major exporters in the region. Last month, Taiwan’s exports fell for the 13th straight month—the island’s longest export slump since the global financial crisis—while South Korean exports declined for the 14th consecutive month. China’s February results were the weakest since May 2009, when exports fell 26.4%. (…)

Many blame the calendar quirks but this is a lower low (chart from Bloomberg)

German Industrial Production Surges by Most Since 2009

Production, adjusted for seasonal swings, climbed 3.3 percent from the prior month after retreating a revised 0.3 percent in December, data from the Economy Ministry in Berlin showed on Tuesday. That’s the biggest increase since September 2009 and the first gain in three months. It was stronger than all projections in a Bloomberg survey of economists, which had a median forecast for 0.5 percent growth. (…)

Construction jumped 7 percent from December and investment goods output rose 5.3 percent, the report showed. Consumer goods production increased 3.7 percent and manufacturing increased 3.2 percent. Industrial output rose 2.2 percent from a year earlier, again beating the highest economist estimate. (…)

High five German Orders Erode in January on Domestic Weakness

German orders fell in January for the second straight month. However, each month the declines were relatively small, and together, they fail to offset the 1.5% order gain in November so that the three-month change is still positive. Over three months orders are up at a 4.8% pace, up from 2.4% over six months which also was up from 1% over 12 months. Orders are expanding and accelerating sequentially despite the two-month drop.

German orders are fighting two opposite trends. Foreign orders are accelerating sharply sequentially while domestic orders are weakening sequentially. So far, foreign order strength is dominating the trend based on stronger shorter term rates of growth. However, year-over-year, the growth in foreign and domestic orders is nearly identical at about 1% (i.e., 1.2% foreign; 0.8% domestic). The year-over-year growth rate in foreign orders has just turned positive. (…)

large image

Capital goods trends are decelerating, showing sales dropping over three months and over six months. Other sectors show both growth and acceleration. Normally the preponderance of strength would simply make that the end of the story. But for Germany, capital goods tend to be at the core of its strength so the progressive weakness and deceleration there gives me pause. (…)

Oil edges lower after Kuwait dents hopes for output freeze

(…) Kuwait’s oil minister said on Tuesday that his country’s participation in an output freeze would require all major oil producers, including Iran, to be on board.

“I’ll go full power if there’s no agreement. Every barrel I produce I’ll sell,” Anas al-Saleh told reporters in Kuwait City.

OPEC member Kuwait is currently producing 3 million barrels of oil per day, he added.

On Monday the Ecuadorean government said that Latin American oil producers would meet on Friday to coordinate a strategy to halt the crude price rout.

Tuesday’s report by Goldman Sachs said that a recent surge in commodity prices was premature and unsustainable. (…)

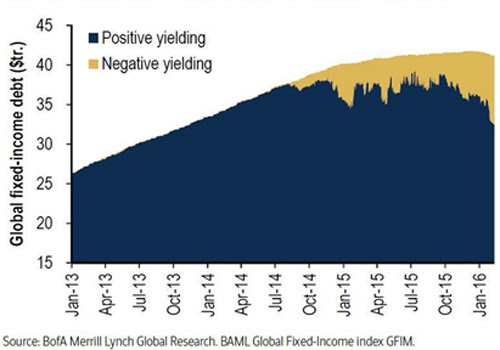
Long-term Japanese bonds set record lows 30-year bond yield falls 22.2bp in single trading session

(…) The benchmark 10-year JGB yield fell below zero in mid-February and was quoted at -0.11 basis points on Tuesday. Last week, Japan sold a new 10-year bond at a negative yield for the first time, meaning that buyers are effectively paying the country for lending it money over a decade.

Bonds needing to be repaid in seven years now carry a yield of minus -0.23 per cent.

This is truly amazing: (via Tony Sagami)
Crying face Michael Bloomberg Says He Won’t Run for President

NEW$ & VIEW$ (7 MARCH 2016): Don’t Get Too Giddy

U.S. Employers Look Past Global Tumult U.S. employers picked up the pace of hiring in February, a sign of steady economic growth despite financial-market turmoil and weakness abroad.

The nation’s job growth rebounded in February as nonfarm payrolls rose by 242,000 and the prior two months were revised up by 30,000, the Labor Department said Friday. The unemployment rate held steady at 4.9% as more Americans jumped into the job market, pushing labor-force participation to its highest rate in a year. (…)

The service sector, bolstered by steady consumer spending, has been particularly robust. Health care, retail, restaurants and education posted some of the healthiest job gains last month. (…)

While some sectors are reporting steadily rising wages, that didn’t translate into February’s nationwide data. From December to January, average hourly earnings of private-sector workers fell 3 cents to $25.35. Wages were up 2.2% from a year earlier, a slower pace than prior months, though some economists suggested the latest data may have been depressed by calendar quirks. (…)

The steady job gains are finally drawing workers off the sidelines. The share of Americans participating in the labor force rose to 62.9% in February, the highest level in a year. (…)

Broad measures of unemployment also improved. The share of Americans stuck in part-time jobs or too discouraged to look for work dropped to 9.7% from 9.9% in January. That was the lowest level since May 2008. (…)

Employment in mining, a sector that includes the oil and gas industry, fell again last month. Since hitting a peak in September 2014, the mining industry has lost 171,000 jobs amid tumbling prices for crude oil.

Manufacturers also shed jobs in February, continuing a squeeze from a strong dollar that makes U.S. firms’ goods more expensive abroad.

Other good quotes on that:

  • “Don’t be taken in by the dip in hourly earnings; it just continues a very consistent pattern of undershooting in months when the 15th – payday for people paid semi-monthly – falls after the employment survey week. Same thing in March, but then there’ll be a huge rebound, putting wage growth year over year at new highs. (Ian Shepherdson, Pantheon Macroeconomics)
  • However, the workweek fell from 34.6 hours to 34.4 hours (in employment terms, this is the equivalent of shedding about 500,000 jobs) (Michelle Girard, RBS)
  • Hours worked fell by 0.2 hours, the equivalent of a drop of about 600,000 in private sector jobs. Partially offsetting this implicit weakness is the expansion of the labor force.”—Drew Matus, UBS
  • Like the January estimate, February can be full of noise and seasonal quirks so we urge investors to not get too giddy about the top line gain of 242,000. Rather we would take the 2 month average of 207,000 as closer to the true underlying trend in hiring, which is in line with the 211,000 six month average and the 223,000 average for all 2015.” –Joe Brusuelas, RSM US LLP
DON’T GET TOO GIDDY

Indeed. February’s job number was good and effectively dispelled the idea that the U.S. could be in recession, now. But employment is not a leading indicator. It sure is positive to know that labor income is not collapsing which should help sustain critically needed consumer spending. However, there are some unnerving facts we should consider. As long-time readers know, I place good weight on the various PMI reports: they are timely, independent, unrevised and generally pretty dependable coming directly from industry participants. Let’s look at some of the recent surveys to see the evidence they provide:

  • Markit’s U.S. PMI fell below 50 last month.

Survey data have signalled a marked slowing in the pace of economic expansion so far this year, with PMI data showing the weakest monthly expansion since the financial crisis with the exception of the government shutdown of October 2013. Such a marked slowing is normally a precursor to a weakening in the rate of job creation.

The forward-looking indicators from the PMI surveys even point to a risk of the economy stalling or contracting. The surveys not only show order book growth slowing, pointing to waning demand conditions, but also that business confidence has slipped to one of the weakest since the financial crisis.

  • February’s Services PMIs were particularly weak. Markit’s dropped from 53.2 in January to 49.7 in February, a level below that of 2012. The ISM Services PMI has also been soft lately with the employment index

down sharply to 49.7, indicating a decline in jobs for the first time since February 2014. During the last ten years, there has been a 96% correlation between the employment index and the m/m change in service plus construction payrolls.

  • Both surveys revealed weakening new order trends in non-manufacturing industries.

Growth of incoming new work has now eased for three consecutive months, with the latest upturn the weakest since the start of 2015. (…) February data meanwhile indicated a further drop in unfinished work, with the rate of backlog depletion the fastest for almost two years. (Markit)

Briefly stated, the latest PMI surveys, direct from the horses’ mouth, suggest that the U.S. Services economy has weakened and that new orders are also coming in slowly which augur poorly for coming months. Services employment has held up reasonably well so far but declining backlogs are not supportive of sustained employment levels.

Between December and February, Services accounted for 92.3% of all new jobs, up from 74.3% in the previous 3 months. Note that almost 90% of February’s new jobs were part-time…

Robert A. Brusca, Chief Economist of Fact and Opinion Economics, a NYC consulting firm, points out that the weakness in Services is global:

(…) In our table of somewhat overlapping countries and regions (we have both the EMU and Germany and France separately as well as global services module), we have 18 mostly separate observations of which only four showed any service sector improvement month-to-month in February. In January, only seven had improved month-to-month. In December, only two had improved month-to-month. So this is a feature that has been in train. The weakening has been broad-based.

We now see contracting impulses in play for both goods and services sectors. Housing/construction is not likely to be much of an offset if any.

The Typical U.S. Worker May Get Bigger Raises Than in the Jobs Report

According to payroll processing firm Automatic Data Processing Inc., that’s likely well less than the annual increase received by the typical U.S. worker: a full-time employee at the same company for more than a year.

Those employees—more than 60% of all workers—saw their average hourly earnings increase 4.1% in the fourth quarter of 2015 compared with a year earlier, ADP said. (…)

ADP has tracked wages by employment type for less than two years, but the year-over-year gain for full-time workers at the same employer increased from 3.5% in the third quarter of 2014.

The acceleration has been most pronounced in information jobs, where job holders’ wages were up 6% from a year earlier in the fourth quarter of 2015, and in manufacturing, growing 4.5% year-over-year.

Trade Gap in U.S. Widens More Than Forecast

(…) The gap grew 2.2 percent to $45.7 billion, exceeding all forecasts in a Bloomberg survey of economists and the largest in five months, from a revised $44.7 billion in December that was bigger than previously estimated, the Commerce Department reported Friday in Washington. (…)

Exports dropped 2.1 percent to $176.5 billion in January, the lowest since June 2011. The decrease was broad-based, stretching from soybeans to fuel oil and drilling equipment.

Imports also slumped 1.3 percent to $222.1 billion, the weakest since April 2011. The drop was led by a $1.85 billion plunge in purchases of crude oil. The total value of petroleum imports was the lowest since November 2003.

Haver Analytics details the weakness in exports:

Among exports of goods, all end-use categories fell in January except for a marginal 0.2% rise in autos and parts. Consumer goods, which had had the largest increase in December, had a large decrease in January, 5.0%. “Other” goods exports fell 9.1%, and foods, feeds & beverages were off 4.8%. Industrial materials & supplies were down 2.9% and capital goods, 2.8%. Imports of goods fell with the drop in oil prices as industrial materials and supplies, which include petroleum, declined 5.7% in January. But other end-use groups were also off: capital goods by 2.4%, “other” goods by 1.9% and consumer goods 0.2%. Autos and parts imports, with the firmness in that market in the U.S., rose 1.7% and foods, feeds & beverages were up 1.5%.

large image

Are we there yet?

image
 
CHINA

(…) “This is the crucial period in which China currently finds itself and during which we must build up powerful new drivers in order to accelerate the development of the new economy.” (…)

The growth rate, Premier Li said, is meant to ensure that China becomes a “moderately prosperous society” and that enough jobs are created “for relatively full employment.” (…)

For the first time in two decades, Beijing adopted a range for its growth target rather than a specific number, giving itself more flexibility in a system where hitting stated goals remains politically important. Mr. Li said growth over the next five years should average at least 6.5%. (…)

Mr. Li said: “We will address the issue of ‘zombie enterprises’ proactively yet prudently by using measures such as mergers, reorganizations, debt restructuring and bankruptcy liquidations.” Zombie enterprises, a term that Chinese officials have embraced recently, are unproductive businesses kept alive by debt and subsidies. (…)

To leave room for more spending, the targeted budget deficit will be 3% of gross domestic product this year, up from 2.3% in 2015, according to Mr. Li’s report. (…)

Private-sector delegates at the meeting were heartened by Mr. Li’s pledge to reduce corporate taxes and fees this year. (…)

China’s leaders have said that part of the difficulty in letting zombie factories fail is resistance from local governments.

After a three-year campaign against corruption, Mr. Xi has recently stepped up efforts to get officials to fall in line with party directives. Mr. Li also appeared to take a stab at bureaucratic foot dragging, saying Beijing will punish “all types of behavior that constitute flagrant violations of discipline.” (…)

In shifting the economy toward services and consumption and away from investment in smokestack industries, the government envisions a future powered by innovation and the Internet. Priorities for this year include tax deductions for research, more autonomy for universities and setting up demonstration centers for startups. “Crowdfunding” and the “sharing economy” both get mentions, as do e-commerce and express delivery.

  • China lays out its vision to become a tech power China aims to become a world leader in advanced industries such as semiconductors and in the next generation of chip materials, robotics, aviation equipment and satellites, the government said in its blueprint for development between 2016 and 2020.

(…) China aims to boost its R&D spending to 2.5 percent of gross domestic product for the five-year period, compared with 2.1 percent of GDP in 2011-to-2015.

Innovation is the primary driving force for the country’s development, Premier Li Keqiang said in a speech at the start of the annual full session of parliament.

China is hoping to marry its tech sector’s nimbleness and ability to gather and process mountains of data to make other, traditional areas of the economy more advanced and efficient, with an eye to shoring up its slowing economy and helping transition to a growth model that is driven more by services and consumption than by exports and investment.

This policy, known as “Internet Plus”, also applies to government, health care and education. (…)

China aims to increase Internet control capabilities, set up a network security review system, strengthen cyberspace control and promote a multilateral, democratic and transparent international Internet governance system, according to the plan. (…)

Central bank data released on Monday showed reserves fell $29bn last month to $3.2tn, sharply lower than the $99bn fall in January and a record $108bn drop in December. (…)

ENERGY

Major OPEC producers are privately starting to talk about a new oil price equilibrium of $50 a barrel, adding to signs that the market’s long, deep rout is officially over, says one of the industry’s leading prognosticators.

Gary Ross, the founder, executive chairman and chief oil soothsayer at New York-based consultancy PIRA, told clients 2-1/2 weeks ago that he reckoned the “lows are in” for crude, which was then about $30 a barrel. U.S. futures CLc1 have rallied since then to close at nearly $36 on Friday, with a handful of analysts also cautiously calling a bottom.

In an interview with Reuters, Ross said oil should recover to $50 a barrel by the end of the year, potentially aided by eventual supply cuts from leading producers among the Organization of the Petroleum Exporting Countries (OPEC).

“They want $50 oil, this is going to become the new anchor for global oil prices,” said Ross, one of the industry’s most respected forecasters for his bold price predictions and decades-long history of consulting with OPEC members.

“While it may not be an official target price, you’ll hear them saying it. They’re trying to give the market an anchor.” (…)

In his note to clients, Ross also pointed to the recent agreement between major OPEC members and leading non-OPEC producer Russia to “freeze” production at January levels as a factor boosting market sentiment after a brutal period when the only safe trade seemed to be sell.

The pact will do little to curb immediate oversupply, especially with Iran exports still swelling after the end of sanctions. Still, working together on “verbal intervention” was a positive start that “could lead to eventual cuts” after a period in which Saudi Arabia and Russia made little effort toward any kind of cooperation, he said.

“Russian production is going down anyway, why not agree to a freeze and then cuts?” Ross told Reuters. (…)

Here’s one clear response to U.S. natural gas prices plunging to a 17-year low: For the first time in at least three decades, fewer than 100 rigs are drilling for the fuel.

Drilling rigs targeting gas slid by five to 97 in the week ended March 4, the least in data going back to 1987, Baker Hughes Inc. said Friday. There were about 900 working in gas fields five years ago. (…)

EARNINGS WATCH

Factset:

In terms of estimate revisions for companies in the S&P 500, analysts have made higher cuts than average to earnings estimates for Q1 2016 to date. On a per-share basis, estimated earnings for the first quarter fell by 8.4% over the first two months of the quarter. This percentage decline is larger than the trailing 5-year average (-2.8%) and trailing 10-year average (-3.6%) for approximately this same point in time in the quarter.

All ten sectors have recorded a decline in expected earnings growth since the beginning of the quarter due to downward revisions to earnings estimates, led by the Energy, Materials, Information Technology, and Financials sectors. The Energy sector has recorded the largest decrease in expectations for year-over-year earnings since the start of the quarter (to -94.9% from -44.1%).

If the Energy sector is excluded, the estimated earnings decline for the S&P 500 would improve to -3.3% from -8.0%.

As a result of the downward revisions to earnings estimates, the estimated year-over-year earnings decline for Q1 2016 is -8.0% today, which is below the expected earnings growth of 0.3% at the start of the quarter (December 31).

As a result of downward revisions to sales estimates, the estimated sales decline for Q1 2016 is -0.6%, which is below the estimated year-over-year sales growth rate of 2.6% at the start of the quarter.

If the Energy sector is excluded, the estimated revenue growth rate for the S&P 500 would jump to 2.0% from -0.6%.

image

Thomson Reuters’ numbers for Q1’16 are not quite as bad as Factset’s although the deterioration from Jan. 1st is similar:

image

In addition, a higher percentage of S&P 500 companies have lowered the bar for earnings for Q1 2016 relative to recent averages. Of the 115 companies that have issued EPS guidance for the first quarter, 91 have issued negative EPS guidance and 24 have issued positive EPS guidance. The percentage of companies issuing negative EPS guidance is 79% (91 out of 115), which is above the 5-year average of 72%.

image

Factset-calculated negative guidance is slightly worse than during the first week of January for Q4’15 (75%). Thomson Reuters’ tally is not out of line with last year’s at this time but is worse than Q4’15 data.

image

Until proven wrong, investors will maintain a wary view of the earnings outlook. This lack of earnings tailwind should keep equity markets edgy and volatile.

In the meantime, TR’s estimate for Q4’15 EPS has crept up to $117.79, up 0.6% from January’s data. That number should drop to the $116.00-116.25 range if Q1 and Q2 estimates are correct.

The S&P 500 Index recovered 10.7% from its recent January and February low of 1810 and is now at 19.1 on the Rule of 20 scale, back within the 19-20 range generally observed during the last 2 years.

image

If we apply the normalization factor due to Energy (see UPGRADING EQUITIES TO 3 STARS), the Rule of 20 P/E stands at 17.1, up from 16.0 when I upgraded equities to 3 stars on February 16. This volatility is not for the faint-hearted.

The Index is now right on its 100-d moving average which has just recently turned up. It is but 1% below its still declining 200-d. m.a., likely to prove a difficult hurdle in coming weeks.

I have often discussed the problems with aggregate earnings: each aggregator has its own method to treat “unusual” or “non-operating” earnings. Normally, the differences between the various datasets are not meaningful enough to care. They are this time as I recently explained in PICK YOUR FACTS. Ed Yardeni wrote last week on the current problem. See Earnings & Margins: Different Strokes and, for more data and charts, S&P vs. Thomson Reuters Earnings.

Speaking of no back wind:

Lord Rothschild Letter to Investors (via RIT Capital) (and via Zerohedge, with ZH emphasis)

In my half-yearly statement I sounded a note of caution, ending up by writing that “the climate is one where the wind may well not be behind us”; indeed we became increasingly concerned about global equity markets during the last quarter of 2015, reducing our exposure to equities as the economic outlook darkened and many companies reported disappointing earnings. Meanwhile central banks’ policy makers became more pessimistic in their economic forecasts for, despite unprecedented monetary stimulus, growth remained anaemic.

Not surprisingly, market conditions have deteriorated further. So much so that the wind is certainly not behind us;indeed we may well be in the eye of a storm.

The litany of problems which confronts investors is daunting:

  • The QE tap is in the course of being turned off and in any event its impact in stimulating asset prices is coming to an end.
  • There’s the slowing down to an unknown extent in China.
  • The situation in the Middle East is likely to be unresolvable at least for some time ahead.
  • Progress of the US and European economies is disappointing.
  • The Greek situation remains fraught with the country now having to cope with the challenge of unprecedented immigration.
  • Over the last few years we have witnessed an explosion in debt, much of it repayable in revalued dollars by emerging market countries at the time of a collapse in commodity prices. Countries like Brazil, Russia, Nigeria, Ukraine and Kazakhstan are, as a result, deeply troubled.
  • In the UK we have an unsettled political situation as we attempt to deal with the possibility of Brexit in the coming months.

The risks that confront investors are clearly considerable at a time when stock market valuations remain relatively high.

There are, however, some influential and thoughtful investment managers who remain sanguine about markets in 2016 on the grounds that the US economy is in decent shape – outside of manufacturing – while they feel that economic conditions may be improving. To them, the decline in these markets may have more to do with sentiment than substance. Others are less optimistic but feel that the odds remain against these potential difficulties materialising in a form which would undermine global equity markets. However our view is that 2016 is likely to turn out to be more difficult than the second half of 2015. Our policy will be towards a greater emphasis on seeking absolute returns. We will remain highly selective when considering public and private investment opportunities. Reflecting this policy, our quoted equity exposure has been reduced to 43% of net asset value.

There’s an old saying that in difficult times the return of capital takes precedence over the return on capital. Our principle will therefore be to exercise caution in all things in the current year, while remaining agile where opportunities present themselves. Problems have a habit of creating opportunities and I remain confident of our ability to identify and profit from them during 2016.

SENTIMENT WATCH

(…) Remember when it was, like, Feb. 11 and the markets were collapsing? Mr. Market sure turned that frown upside down. The Dow rose 2.2% this week, climbing back over 17000, and is now down just 2.4% on the year. The S&P 500 rose 2.7%, and is now down just 2.2%. At Friday’s closing level of 1999.99, it is just a tick off the 2000 level.

Little has changed the past two weeks. Corporate profits are still contracting, overseas growth is virtually nonexistent, the Fed is still looking to tighten policy, and U.S. growth is still below any kind of rate that could be considered sustainable. That’s to say nothing of the volatile political climate in the U.S. and Europe. In the markets, at least, none of that matters right now.

Investors pile into US junk bond funds High yield debt demand hits weekly record of $5bn

(…) US funds invested in high yield debt counted $5bn of inflows in the week to March 2, the greatest seven-day haul since record keeping began in 1992, according to fund flows tracked by Lipper.

The moves highlight an easing of investor anxiety after a string of better than expected economic reports in the US, a stabilisation in crude prices and the view that central banks in Europe, Japan and China are prepared to provide further economic stimulus if needed. (…)

US equity funds continued to suffer withdrawals, although exchange traded funds buying large and small capitalisation stocks counted inflows at the start of March. European equity funds also counted redemptions, while emerging market equity funds recorded their first inflows since last November. (…)

US high yield: back in the game

In one-sided sporting contests, clever TV producers will put the camera on the exodus of fans streaming for the exits. On occasion, those pictures turn humorous when the game score tightens and embarrassed masses try to slip back into the stadium to see the breathless finale.

Such a spectacle may now be occurring among US high-yield bonds. In late 2015, a handful of high-yield mutual funds faced liquidity problems as investors, fretting about defaults from commodity companies, wanted their money back.

Funds, however, struggled to find the cash as their holdings were thinly traded and not easily sold off. Most notably, Third Avenue Management suspended redemptions during a December swoon in such a fund and eventually wound down its operations. (…)

But as it turns out, the US economy still keeps chugging along, oil prices are inching up and both short and long-term interest rates will not likely soar anytime soon.

Combine those factors with perhaps an excessive upward surge in risk premia in the early part of the year, the resultant crash in junk bond prices now has money jumping back through the turnstiles attempting to exploit bargains. (…)

Still, even as yields have fallen from mid-February highs (the BofA Merrill Lynch high-yield index yield jumped more than 10 per cent in February), the current yield of just under 9 per cent is still nearly 3 percentage points greater than a year ago.

A bifurcation is also evident between the better-positioned speculative companies rated in the B range against those in the CCC category stacked with teetering energy companies. The average yield of CCC bonds is still a whopping 19 per cent and energy defaults continue to pile up (though last week a retailer, The Sports Authority, filed for bankruptcy).

The diverging fortunes, then, of the riskiest companies is creating an opportunity for careful credit analysts. But the outcome of the game still is in doubt.

INFLATION WATCH
Lawrence Summers: A world stumped by stubbornly low inflation

(…) In the 1970s it took years for policymakers to recognise how far behind the curve they were on inflation and to make strong policy adjustments.

Policymakers continued to worry about a supposed lack of demand long after it was an important problem. The first attempts to contain inflation were too timid to be effective and success was achieved only with highly determined policy. A crucial step was the abandonment of the idea that the problem was structural in nature rather than driven by macroeconomic policy.

Today’s risks of embedded low inflation tilting towards deflation and of secular stagnation in output growth are at least as serious as the inflation problem of the 1970s. They too will require shifts in policy paradigms if they are to be resolved.

In all likelihood the important elements will be a combination of fiscal expansion drawing on the opportunity created by super low rates and, in extremis, further experimentation with unconventional monetary policies.

Gavyn Davies Is US inflation (finally) rising?

(…) The answer is that there are some tentative signs of a slow rise in underlying inflation in the US, where price increases have been higher than expected in recent months. In contrast, inflation rates in the Eurozone and Japan have surprised on the low side. There, fears of “secular stagnation”, leading to deflation, still seem all too real. (…)

In January, the core PCE consumer price inflation rose to 1.7 per cent, not far below the official 2 per cent target for overall PCE. Since July of last year, both core CPI and core PCE inflation have accelerated by 0.4 percentage points, to 2.2% and 1.7%, respectively.

That represents only scant evidence of a turning point in the inflation process, but the underlying price data calculated by several of the regional banks in the Federal Reserve system show recent inflation rates running close to or above 2 per cent. The graph at right shows that several of these indicators dipped in late 2014, but since then they have rebounded towards the 2 per cent target. (…)

However, Fulcrum’s inflation forecasting models (BVAR models that include price inflation, the exchange rate and oil prices) do suggest that the inflation process may have firmed up lately. The graphs below show that headline inflation will start to rise soon, and that core inflation will be hovering around 2 per cent by year end. These forecasts are a bit above the FOMC’s predictions that were published in December, so it is possible that the Fed’s inflation path could be slightly firmer when it appears with the March 15/16 FOMC meeting. (…)

So the “great divergence trade” between the Fed and the ECB could be coming back to life after a period in which deflation fears have been dominant everywhere. But should investors be worried that rising US inflation trends are going to cause major headaches for markets?

The break even (expected) inflation rates priced into the bond market (TIPS) are now much lower than would be justified by mainstream CPI projections for the next couple of years. If break even inflation rises, that would make the Fed much more likely to tighten policy, so it is definitely a worry. But the chances of a more savage rise in US inflation, with the Fed getting seriously “behind the curve”, still seem fairly remote.

In order to predict inflation over the medium term, we need to add a measure of economic slack or unemployment to the Fulcrum models shown above. The resulting models show that the effect of unemployment on inflation, measured by the Phillips Curve, has dropped sharply in all the major advanced economies in the past two decades.

In the “Economic Report of the President” for 2016, Jason Furman’s Council of Economic Advisers at the White House presents evidence that clearly demonstrates the flattening in the US Phillips Curve since 1990. In the 2000s, whenever unemployment fell by 1 percentage point below its natural rate (estimated to be around 5 per cent) inflation subsequently increased by only about 0.25 per cent per annum, about half of the effect observed in earlier decades.

Similar work by the always-excellent Sven Jari Stehn and Jan Hatzius at Goldman Sachs published last week shows that Phillips Curve models to predict inflation in the major economies are still working well, once this drop in the responsiveness of inflation to unemployment is recognised. These models predict a rise in core US inflation to above 2 per cent by 2017, while inflation in the eurozone and Japan should remain well below target.

What does this mean for the Fed and the markets? The good news is that inflation is most unlikely to run completely out of control, almost whatever happens to the economy. [!] Any rise in inflation will happen very slowly. But the Fed may be reinforced in its belief that the Phillips Curve is still operating, in which case it will not allow unemployment to drop rapidly below 5 per cent. On Friday, the latest US jobs report showed that the unemployment rate is already at 4.9 per cent.

Markets should be worried about this. Recently, with productivity growth close to zero, unemployment has been falling rapidly while real GDP growth has been hovering at only about 1 per cent. If the Fed believes that it needs to enforce a speed limit anywhere near that low on the American economy, equities would certainly be in serious trouble.