Two headlines, same article:
-
U.S. Durable-Goods Orders Jump Amid Strength in Business Spending Orders for long-lasting manufactured goods posted their largest monthly gain since last spring—jumping 4.9%—in a sign the battered manufacturing industry could be stabilizing after one of its worst years since the recession ended.
-
Signs of Manufacturing Recovery Emerge Gains in durable-goods orders, business investment point to a mending in the factory sector
(…) The 4.9% monthly gain in durable-goods orders touched nearly every major category. But most major categories were still below their January 2015 levels, and economists were quick to caution that one month of improved data does not necessarily signal a manufacturing resurgence. (…)
New orders for nondefense capital goods excluding aircraft, considered a proxy for business spending on equipment, rose 3.9%, the largest monthly increase since June 2014. But it remains 4.4% lower than January a year ago. (…)
And orders for motor vehicles and parts posted their third straight monthly rise, climbing 3.0%. (…)
The WSJ is commendable to try to boost investors spirit with upbeat headlines but the reality is that January’s strength has not even offset recent losses. Non-def cap goods ex-air:
- last 12 months: –2.8% with 7 down months totalling –12.7% and 5 up months totalling +6.1%;
- last 6 months: –1.0%;
- last 3 months: –0.7%
The only positive way to look at business spending is to see perhaps a flattening trend during the last year…

![image[7]](https://i0.wp.com/www.edgeandodds.com/wp-content/uploads/2016/02/image76.png "image[7]")
Moody’s uses trailing 12-m trends to illustrate the poor trend:

A reminder: Markit’s flash manufacturing PMI dropped from 52.4 in January to 51.0 in February:
Manufacturers overwhelmingly linked the slowdown to softer underlying demand patterns in February, while only a small minority cited temporary weather-related disruptions. There were reports that weaker business sentiment, alongside uncertainty about the general economic outlook, had encouraged clients to delay spending decisions during the latest survey period.
Meanwhile, the strong dollar and less favourable global economic conditions continued to act as a drag on export sales in February. Reflecting this, new work from abroad decreased at the most marked pace since April 2015.
Softer demand patterns contributed to a renewed decline in pressures on operating capacity across the manufacturing sector during February. This was highlighted by the sharpest reduction in backlogs of work since September 2009.
U.K. Business investment dips sharply
(…) The figures from the Office for National Statistics showing investment falling 2.1 per cent came as a particular disappointment after two consecutive quarters of growth. (…)

World trade in worst slump since crisis
(…) The value of goods that crossed international borders last year fell 13.8 per cent in dollar terms — the first contraction since 2009 — according to the Netherlands Bureau of Economic Policy Analysis’s World Trade Monitor. Much of the slump was due to a slowdown in China and other emerging economies. (…)
China, which in 2014 overtook the US as the world’s biggest trading nation, this month reported double-digit falls in both exports and imports in January. In Brazil, which is now experiencing its worst recession in more than a century, imports from China have collapsed.
Exports from China to Brazil of everything from cars to textiles shipped in containers fell 60 per cent in January from a year earlier while the total volume of imports via containers into Latin America’s biggest economy halved, according to Maersk Line, the world’s largest shipping company.
“What we are seeing right now from China is not only a phenomenon for Brazil; we are seeing the same all over Latin America, declining [Chinese export] volumes into all the markets,” said Antonio Dominguez, managing director for Maersk Line in Brazil, Paraguay, Uruguay and Argentina. “It has been going on for several quarters but is getting more evident as we move into the year [2016].” (…)
Measured in volume terms the picture was not as grim, with global trade growing 2.5 per cent. But that fell below global economic growth of 3.1 per cent, extending a depressing trend in the global economy. (…)
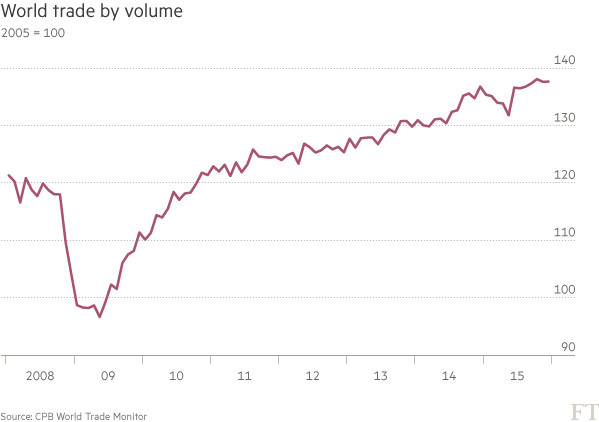
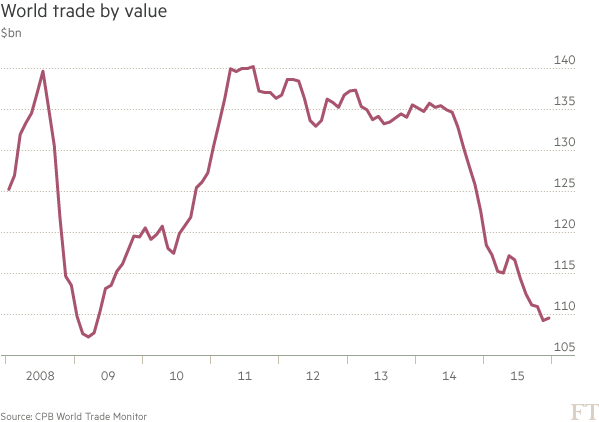
However, there are some signs a trade rebalancing is under way in places such as Brazil. The collapse in Brazilian imports from China has been accompanied by a rise in exports from Brazil to Asia, driven in part by a 40 per cent depreciation of the real against the dollar over the past 12 months.
OECD Sounds Alarm Over Slowdown In Economic Overhauls Governments’ slower implementation of policy changes that are needed to boost long-term growth prospects is “deeply concerning,” an OECD report said as G-20 finance officials meet in Shanghai.
(…) The OECD noted that productivity growth has been slowing since 2000 in “a vast majority of countries.” It cited a decline in the pace of business creation as one “unsettling” factor behind that trend, and said it reflected an increase in “barriers to entry” and a consequent weakening of competition between firms. (…)
The OECD said reforms to boost competition among service providers are particularly necessary, since productivity in that sector lags behind manufacturing. It identified Germany, Japan and South Korea as the economies in which action is most urgently needed, since productivity gaps between the two sectors are widest. But it urged similar action in China as it attempts to increase the share of economic activity accounted for by services.
Southern European countries have done more to reform their economies than northern European countries over recent years, Ms. Mann said, adding that “more vigorous reform efforts” in Germany would help sustain the eurozone’s economic recovery. (…)
G-20 Finance Officials to Urge Spending Ramp-up, Economic Overhauls
(…) Worried about a dimming outlook, the International Monetary Fund on Wednesdaycalled on the G-20 to engineer “coordinated demand support, using available fiscal space to boost public investment and complement structural reform.” (…)
The IMF warned Wednesday that it may be forced to cut its forecast for the global economy again, just a month after downgrading its estimate. China’s slowdown and tumult in global markets “point to higher risks of a derailed recovery at a moment when the global economy is highly vulnerable to adverse shocks,” the IMF said. (…)
The Institute of International Finance, which represents more than 500 of the world’s largest banks, insurers and other financial institutions, warns the world economy is close to sliding into a downturn.
“Global financial markets have started 2016 with a major sell-off that threatens to slow down an already stumbling global economy or even trigger a global recession,” the IIF said in a research note.
Gabriel Sterne at Oxford Economics says the current state of the global economy is akin to 2011-2012 when Europe’s debt crisis risked plunging the world into a recession. But ECB President Mario Draghi reassured markets he would do “whatever it takes” to save the euro and the U.S. Fed launched its third round of extraordinary monetary easing.
“Where is the equivalent policy response this time?” Mr. Sterne asks.
Central banks, especially in advanced economies, are getting far less bang for their buck. The ECB and Bank of Japan have moved rates into negative territory, but those efforts risk creating problems for banks and the impact is questionable. After the BoJ’s last move, the yen strengthened, a move that undercut its efforts.
“The more countries go negative, the less bang there is for the buck,” said Mr. Sterne.
Even the IMF, which has long advocated central banks pushing the easy-money pedal to the floor, is worried the potential collateral damage from such stimulus risks outweighing the gains. (…)
There is little indication the G-20 will put additional policies on the table. Instead, some are slimming down their targets.
Mexico, for example, is trimming $1.7 billion from its budget for highways and other infrastructure spending as low oil prices eat into revenues. Brazil’s two-year contraction and political crisis are nixing vows for structural overhauls needed to brighten their growth prospects.
Worried about turbulence in emerging markets, the IMF has joined emerging markets in pushing the G-20 to develop new short-term credit lines like the ones the Fed used during the crisis to help countries cope with major capital outflows.
But that effort, too, faces tough odds given opposition from its largest member, the U.S.
-
BOE’s Carney: Governments Must Do More for Growth
-
Morneau to push G20 leaders to deliver on pledge of global growth
-
G-20 Tensions Are Dashing Hopes of Action to Revive the World Economy
Calls for increased government spending to lift demand, which have emanated from the U.S. and China, ran into opposition from German Finance Minister Wolfgang Schaeuble, who said using debt to fund growth just leads to “zombifying” economies. Bank of England Governor Mark Carney voiced skepticism over negative interest rates, which have now been adopted in continental Europe and Japan, and the head of the International Monetary Fund also warned about diminishing effectiveness of monetary policies.
While Japan’s finance minister said the G-20 will reaffirm a pledge to avoid competitive devaluations, the lack of agreement on fiscal or monetary initiatives from the group risks disappointing investors who have urged some coordinated action to address stock declines and weak prospects for growth. Offering some solace was clear signals from China that the host nation will implement fiscal and monetary easing. (…)
China admits to renminbi image problem PBoC head says country must erase depreciation expectations
China needs to eliminate market expectations of continued currency depreciation, the head of its central bank admitted on Friday as he argued the country had ample foreign exchange reserves despite recent depletions. (…)
“Thus it is particularly important to stabilise the market expectation on the [renminbi’s] exchange rate,” he said, adding that “as long as our economic fundamentals are sound . . . market expectation[s] will become more rational”. (…)
India economic growth likely to flatten off
The pace of expansion of India’s economy is likely to flatten off in the next 12 months, according to government summaries of the latest annual economic survey released on Friday.
The document, prepared by chief economic adviser Arvind Subramanian, says gross domestic product is expected to grow by between 7 and 7.75 per cent in the coming year, compared with official forecasts of 7.6 per cent in the year ending March 31 2016, and 7.2 per cent the previous year. (…)
RECESSION WATCH
National Restaurant Association’s RPI Index Screams Recession
The National Restaurant Association released its Restaurant Performance Index for the month of December and it showed a sudden plunge in business.
The Restaurant Performance Index (RPI) is a composite of the Current Situation Index and the Expectations Index, both of which track restaurant operators’ responses on same-store sales, traffic, labor, and capital expenditures.
A reading above 100 indicates expansion, while a reading below 100 indicates contraction.
Guess what? The RPI for December fell to 99.7 from 101.3 in November and from 102.1 in October. That is the worst two-month plunge since 2008.

Digging into the numbers shows even more serious problems:
Back in July, 73% of restaurants reported higher same-store sales, but that dropped to 42% in December.
Back in April, 13% of restaurants reported lower same-store sales, but that jumped to 43% in December.
Customer traffic is down too; 51% of restaurants reported a drop in customer traffic.
And restaurant managers aren’t very optimistic about the future; 12% expect business to improve, while 25% expect business to get worse.
(…)
SENTIMENT WATCH
Goldman Struggling to Sell $2 Billion in Bonds Backing Solera Buyout Goldman Sachs is struggling to sell some $2 billion in bonds to fund a buyout of software firm Solera Holdings, according to people familiar with the matter, the latest sign of trouble in the market for debt used in takeovers.
SocGen Swings From Biggest Bull on Europe Stocks to Most Bearish
Societe Generale SA, among the few firms that hadn’t cut 2016 estimates in response to global-growth concerns, now has the most bearish forecast. The bank sees the Euro Stoxx 50 Index ending 2016 at 3,000, up just 4.3 percent from Thursday’s close.
It’s a far cry from only two weeks ago. Europe’s equities were at a 2 1/2-year low, yet the bank’s call for an year-end level of 4,000 translated to an almost 50 percent advance.
“We trim
our equity market forecasts in light of the downgraded U.S. economic outlook,” strategists led by Roland Kaloyan wrote in a report.


