The enemy of knowledge is not ignorance, it’s the illusion of knowledge (Stephen Hawking)

It ain’t what you don’t know that gets you into trouble. It’s what you know for sure that just ain’t so (Mark Twain)

Invest with smart knowledge and objective odds

NEW$ & VIEW$ (8 OCTOBER 2014)

From Cebu Island, Philippines.

Job Openings Hit 13-Year High in August The number of job openings across the U.S. economy continued to climb in August, a sign this year’s strong job growth could stretch into the fall.

Employers had 4.84 million job openings in August, up from 4.61 million in July and the most since early 2001, the Labor Department said Tuesday.

At the same time, sturdy job creation has depleted the number of job seekers, a sign the labor market is tightening and raising the prospect of stronger wage growth. In August, there were just under two unemployed workers per job opening, the lowest level since the recession. In 2009, that figure almost hit seven.

A tighter labor market could eventually lead to higher wages for American workers. Wages have been growing at a tepid pace in recent years. In September, average hourly earnings for private-sector workers grew 2% from a year earlier, barely faster than consumer-price inflation, Friday’s employment report showed. But as companies seek to fill more job openings and the pool of job seekers shrinks, they may have to offer higher wages to fill them.

(…) The last time the proportion of job openings to overall employment was at August’s level, wages were growing at a 4% rate (…).

Still, other figures suggest the labor market is growing below its potential. Despite the pickup in job openings in August, the number of hires actually fell to 4.6 million from 4.9 million in July. That could be a sign that while employers are ready to expand, they’re having trouble finding the right workers or they may lack urgency to hire right away.

And the number of workers quitting their jobs has remained flat in recent months. That shows that despite stronger job growth, many workers are still not confident enough to quit their jobs for better opportunities.

Beth, a reader, writes

What about employment being the king of lagging economic indicators? I understand why politicians celebrate it, but  has something changed such that it is not identified as a lagging indicator in Bearnobull, or other newsletters I read?  What gives?

thanks, love Bearnobull

Partly right Beth. The king of lagging indicators is actually wages which Mrs. Yellen has made her principal stat to watch and dictate the Fed’s moves (!). I focus on employment because of the importance of consumer spending to sustain the U.S. and the world economy.

Consumer Credit Grows At Slowest Pace Since Late 2013

Total outstanding consumer credit, excluding loans secured by real estate, rose in August at a 5% seasonally adjusted annual rate to $3.247 trillion, the Federal Reserve said Tuesday. That was its slowest rate of increase since last November.

Credit-card use, an important indicator of consumer confidence and financial health, declined for the first time since February. Total outstanding revolving credit, mostly credit-card debt, fell at a 0.3% rate in August from the prior month to $880.32 billion. Still, the August level of revolving credit was 3.2% higher than a year ago. (…)

August growth of nonrevolving credit—primarily auto loans and student loans—slowed to its lowest rate since February. It rose 7% to $2.367 trillion.

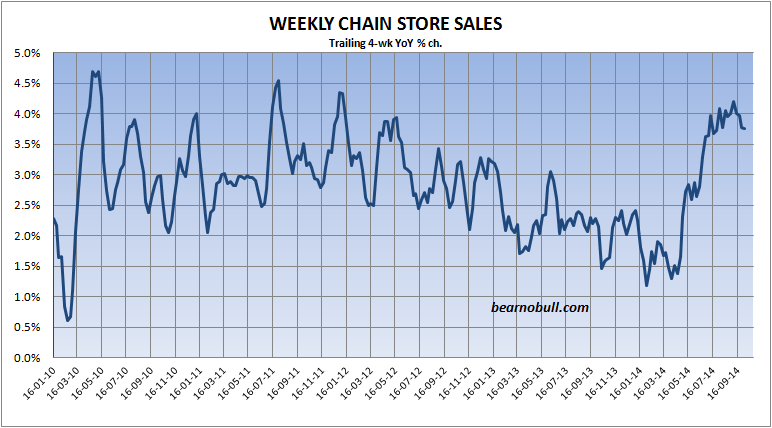
Meanwhile, retail sales are sputtering, showing no upward trend in recent weeks. Chain store sales are up 3.8% YoY but mainly because last year’s sales were weak through the fall.
image

German Factory Output Drops

German factory output fell 4% on the month—the sharpest decline since 2009, data from the country’s economy ministry showed Tuesday. (…) Tuesday’s figures were weak across the board, with manufacturing output down 4.8% and construction output off by 2.0%. Energy output eked out a gain of 0.3%.

The figures came a day after a surprise decline of 5.7% in manufacturing orders for August, also the sharpest since January 2009, when the world was mired in financial crisis.

German Economy Takes an Awkward Holiday August’s 4% drop in German industrial production is awful, but not a signal of economic collapse.

August’s number is the worst German performance since early 2009, when the world economy was still reeling after the collapse of Lehman Brothers. But it is largely down to a massive 25.4% drop in auto output caused by an unusual holiday pattern that led to simultaneous shutdowns at German car plants. That alone contributed 2.9 percentage points to the overall decline in production, UniCredit notes. Data for September from the German auto manufacturers’ association already shows a big rebound, almost to July’s level, J.P. Morgan Chase notes. That means any concerns that Germany’s economy has gone rapidly into reverse are overdone.

But worries about more pervasive weakness in the German economy persist. (…) Surveys of economic sentiment have been declining: Markit’s manufacturing purchasing managers index for September entered contraction territory, at 49.9. Weaker global demand and concerns about the tensions between Russia and Ukraine are to blame. If this unpleasant mix persists, then growth seems unlikely to pick up.

The saving grace for Germany may be consumer spending, somewhat ironically given its historic lack of dynamism. The labor market is strong, inflation is low and wages are rising. But German consumers aren’t the force that their spending-happy peers in the U.K. and U.S. are; consumer sentiment has been softening too. (…)

But Markit suggests not to hold our breadth on the German consumer:

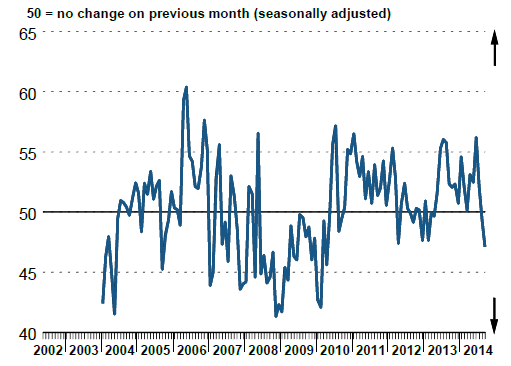
The seasonally adjusted Germany Retail PMI fell from 49.4 in August to a 53-month low of 47.1 in September, signalling an accelerated contraction in German retail sales. Retail sales also fell at a faster pace on an annual basis in September. The decline was the strongest since February 2013, with exactly 39% of the
survey panel reporting a drop in year-on-year sales
image

Just in case you’re wondering:

  • Bundesbank Knocks ECB Plan German Bundesbank President Jens Weidmann criticized the European Central Bank’s decision to buy private-sector bonds and signaled his opposition to purchasing government bonds.
  • Berlin holds firm on fiscal rigour Government determined to cut deficit to zero next year

“Doubts about our fiscal policy would harm us much more than any short-term growth stimulus programme,” Wolfgang Schäuble, finance minister, said on Monday.

So, while the IMF and the ECB are pushing for fiscal stimulation, Germany is saying “Nein”. Equity markets never like it when monetary policies are not well aligned when they need to be. Uncertainty is rarely positive. Policy fights are always terrifying.

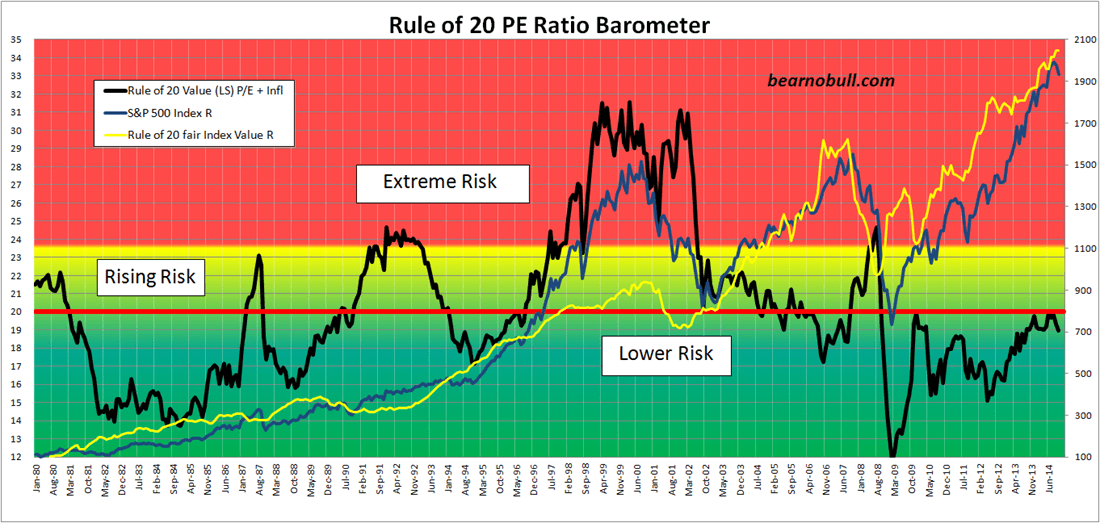
Ghost Remember Oct. 1987? Most of you probably don’t, but I do. James Baker, then U.S. Treasury Secretary, also certainly remembers telling the Germans on Saturday, Oct. 17 to “either inflate your mark, or we’ll devalue the dollar.” On Sunday, the Germans flatly told him to take a walk. The equity rout started Sunday in Asia and the rest is history.

Note that back then equities were very overvalued at 23.1x on the Rule of 20 P/E. They are now at 19x. Also, and importantly, inflation was sharply accelerating from 1.0% in December 1986 to 4.5% in October 1987. The crash brought equities to a Rule of 20 P/E of 17.4x, a level which applied to today’s much lower and stable 1.7% inflation environment would mean a P/E on trailing EPS of 15.7x (17.4 minus 1.7). On current trailing EPS of $111.94, that would bring the S&P 500 Index to 1757, down nearly 10% from current levels. If Q3 estimates are met, trailing EPS will rise to $115.09 over the next 5 weeks, or 1806 on the S&P 500 Index at 15.7x EPS, 6.6% below current levels.
image

Technically, the 200 day m.a. is at 1900 and still rising nicely.

Eurozone Faces a 1-in-3 Chance of Reentering Recession Soon, IMF Says The eurozone’s chances of re-entering a recession have roughly doubled to nearly 38% since April, the International Monetary Fund said in its latest global economic outlook on Tuesday, as the threat of deflation smothers growth prospects in the region.

(…) Regional powerhouse Germany is only expected to grow at 1.5% next year, down 0.2 percentage point from the fund’s July outlook. And Italy is expected to enter its third consecutive year of recession as the government fails restructure the Italian economy to boost competitiveness. (…)

Cheap natural gas lifts US manufacturing Lower prices favour energy intensive industries

US gas sells for $4 per million British thermal units, compared with $10 in Europe and close to $18 in Asia.

The price gap has led to a 6 per cent average increase in US manufactured product exports, the IMF wrote in its twice-yearly World Economic Outlook. (…)

Lower prices for natural gas favour energy- and gas-intensive industries, such as steelmaking, oil refining, and nitrogen fertiliser production. The International Energy Agency has previously warned that Europe will lose a third of its share of global energy-intensive exports over the next two decades because its energy prices will remain stubbornly higher than those in the US.

According to the IMF, a 10 per cent fall in the relative price of US gas leads to an improvement in US industrial production relative to Europe of roughly 0.7 per cent after 1½ years.

NEW$ & VIEW$ (6 OCTOBER 2014)

Still on vacation. This is from Panglao Island in the Philippines.

Job Growth Rebounds, but Wages Lag The U.S. unemployment rate slipped below 6% for the first time since the recession as hiring returned to a strong pace, lifting hopes for an economy that continues to show sluggish wage growth and persistent underemployment.

Employers added 248,000 jobs in September, rebounding from a weak August, the Labor Department said Friday. Payrolls have expanded an average 227,000 a month this year, putting 2014 on track to be the strongest year of job growth since the late 1990s.

The jobless rate fell two-tenths of a percentage point to 5.9%, the lowest level since July 2008, continuing a slide that partly reflects a shrunken labor force. Unemployment, nearly five years after surging to 10% in the wake of the recession, is moving closer to the 5.2%-5.5% range the Federal Reserve expects to see in the long run. (…)

The labor-force participation rate—reflecting the share of working-age Americans who have a job or are looking for one—fell last month to a three-decade low of 62.7%. Before the recession it stood at 66%. (…)

Among private-sector workers, average hourly earnings actually fell a penny last month, to $24.53. They have risen 2% over the past year. (…)

Last month’s job growth was broad-based, with professional and businesses services such as accounting and engineering leading the way, followed by construction, retail and health care. Manufacturing was largely flat for the second straight month. (…)

  • U.S. Jobless Claims Fall by 8,000 The number of new applications for unemployment benefits fell again last week, the latest sign layoffs are declining amid a generally improving economy.

Lately, financial media, including the WSJ, have become pretty lazy and superficial in their coverage of the financial news. The WSJ’s piece above on September’s employment report failed to mention that August and July numbers were substantially revised upward, +31k to 243k for July and +38k to 180k for August original dismal 142k number. This is 69k more jobs in two months.

The WSJ also considered inconsequential the fact that the Household survey showed a 671k jump in full-time jobs for a 12-m total of +2.4M vs a 62k drop in part-time jobs over the same 12-m period.

Also significant and not mentioned is that the 25-34 years old Americans are now over the 2007-08 hump and growing nicely in 2014. The U.S. economy needs them working so they can form households, buy new homes, new furniture, new cars, etc. According to the Household survey, this age group saw its employment grow 2.5% Y/Y vs 1.6% for total household employment. In fact, this age group got 33% of all new jobs in the past year! Maybe not the highest salaries, but salaries nonetheless.

image

Finally on the little noticed but important stuff, the average workweek finally crossed the 34.5 hours last month. Mrs. Yellen certainly took notice.

image

Island with a palm tree This was a very solid, wide ranging employment report. Heck, I’m on vacation, on a beach in the Philippines with slow internet and I’m able to write about these things with content depth and charts. Why can’t other well staffed media do the same?

Challenger Job Cut Announcements Move Lower; Hiring Surges

The outplacement firm of Challenger, Gray & Christmas reported that job cut announcements declined to 30,477 (-24.4% y/y) during September, the lowest level since June 2007. (…) During the last ten years there has been a 62% correlation between the level of job cut announcements and the m/m change in payroll employment.

image

Challenger also samples firms’ hiring plans. They surged to 567,705 (27.7% y/y) due to seasonal jumps in the transportation and retail industries, as well as gains in the government, media, automotive, computer and electronics sectors. These were offset by declines in industrial goods, insurance, consumer products, entertainment/leisure, financial, food and health care industries.

Punch David Rosenberg did mention the hiring surge in his daily note Friday, but failed to qualify it with the obvious and very meaningful seasonality…

U.S. Light Vehicle Sales Give Back the August Surge

September sales of light vehicles fell back to 16.43 million units (SAAR) from 17.53 million in August. The decline retraced most of the August jump to the 2006 high, and left unit sales up 5.8% since December.

Auto sales in September declined 8.2% (-0.3% y/y) to 7.74 million units, the lowest level since April. Sales of domestically-produced autos fell 9.2% (+3.8% y/y) to 5.63 million while sales of imports dropped 5.6% (-9.8% y/y) to 2.12 million.

Light truck sales fell 4.5% (+13.6% y/y) to 8.69 million units. Nevertheless, they remained just off September’s expansion high. Sales of domestically-produced light trucks were off 4.5% (+15.0% y/y) to 7.54 million and imported light truck sales fell 4.6% (+4.9% y/y) to 1.15 million.

I continue to suggest that we may well have seen the cyclical peak in car sales (chart from CalculatedRisk)

Manufacturers are turning cautious. Scheduled Q4 U.S. vehicle production is off 6.3% QoQ Annualized after surging 17.2% and 16.5% in Q2 and Q3 respectively.

Factory Expansion Takes a Breather The U.S. factory sector’s expansion slowed a bit in September from its breakneck pace in August, with manufacturers focused on boosting output with only modest hiring.

The Institute for Supply Management said Wednesday its manufacturing index, based on a survey of purchasing managers, slipped to 56.6 last month from an August reading of 59, which had been the highest since March 2011. (…)

The ISM survey said some respondents noted the shortage of labor as a detriment to business. One manager in the machinery industry said in the ISM survey, “Our search continues for good machinists and electrical engineers.”

Rental Rates Tick Up; Vacancy Flat Rental rates at malls and strip shopping centers ticked up slightly in the third quarter, but vacancy rates remained flat.

Asking rents at regional malls rose 0.5% in the quarter to $40.51 a square foot, up 1.8% from a year earlier, according to data released Thursday by real-estate research company Reis Inc. Mall vacancies remained at 7.9% for the fourth quarter in a row.

Strip centers saw rents rise 0.4% in the quarter to $17.06 a square foot, up 1.8% from a year earlier. Third-quarter vacancy remained unchanged from the previous quarter at 10.3%, slightly lower than the average vacancy rate of 10.74% over the past five years.

The numbers are a sign of continued pain in the retail real estate market. Prices have risen quickly for the highest-quality assets, including the largest, most productive malls and boutique spaces on main thoroughfares in big cities, but they remain sluggish for more run-of-the-mill properties in less attractive locations.

The pace of construction of new shopping centers is also close to a record low, Reis said. Retail landlords have added 3.99 million square feet of new shopping centers so far this year, including 1.3 million in the third quarter.

The previous low was set in 2010, when builders added 4.5 million square feet over the whole year.

“We used to build about 2,000 shopping centers a year in this country. Now it’s just a few hundred,” said David Henry, the chief executive of Kimco Realty Corp., a shopping-center owner based in New Hyde Park, N.Y.

Here’s the chart from CalculatedRisk:

U.S. Trade Gap Narrowed in August The U.S. trade gap narrowed in August as exports increased, a sign of stronger foreign demand for American-made goods that could help boost economic growth in the just-ended third quarter.

Exports increased 0.2% from July to $198.46 billion, and imports rose 0.1% to $238.57 billion. Exports rose 4.1% in August from a year earlier, and imports rose 3.7% on the year.

EMU Retail Sales Perk Up

Euro area retail sales in August snapped back sharply, rising by 1.2% after falling by 0.4% in July. The three-month performances boosted the growth rate to 4.9%, up from 0.6% over six months and 0.6% over 12 months. The growth of nonfood items stepped back up in August; its trends, the sequential growth rates, show some acceleration as well. Motor vehicle registrations are quite volatile and fell by 1.1% in August after a 4.6% increase in July and a 4.4% decline in June. The balance of these effects leaves a negative three-month growth rate -2.6%, down from 10.3% over six months and 4.9% year-over-year. Still, because of volatility, it’s hard to conclude that motor vehicle registrations are slipping with any degree of certainty.

Retail sales volume figures across some selected European Union and European Monetary Union members, shows us gains for all those countries listed in the table in August. Germany and Portugal show double-digit gains and reveal that sales acceleration is in place in both countries. Sweden’s growth, at 5.2% over three months, is also part of an ongoing acceleration. Austria’s 1.2% three-month growth rate is also better than its six month and 12-month growth rates, but the pattern is not as reliable as for other countries showing acceleration. In the U.K., three-month growth is at 2.3%, part of a gradual slowdown from 4% over 12 months to 3.2% over six months to 2.3% over three months. In Denmark, the negative growth of 0.4% over three months is also part of an ongoing slowdown from 12 months to six months to three months. However, Denmark also has sales gains back-to-back in July and August that for the moment are being swamped by a 0.7% drop in June; so its deteriorating pattern may not be set in stone.

large image

Here’s the data. Note that the non-food part remains pretty sluggish.

High five This was for August. Here’s a preview for September from Markit:

Lightning Downturn in eurozone retail sector continues as sales drop for third straight month

September saw a solid and accelerated decrease in eurozone retail sales, the latest PMI® figures from Markit showed. The rate of decline was the sharpest since April 2013, reflecting deepening downturns in trade in both Germany and France. Sales also continued to fall in Italy, though the rate of decline was the slowest in five months.

At 44.8, down from 45.8 in August, the headline Markit Eurozone Retail PMI – which tracks month-on-month changes in like-for-like retail sales – pointed to a third straight monthly decrease in retail sales in the euro area. The rate of was the fastest since April 2013 when measured on both month-on-month and annual bases.

image

Like actual sales, retailers’ buying levels decreased for the third straight month in September, and at a faster rate than in August. Inventories continued to build, however, as firms missed their targets. September’s shortfall in sales relative to plans was in fact the most marked in 18 months.

This augurs pretty badly for the all-important Christmas season…

This won’t help either. Europe is not out of the woods.

image

Global recovery is stalling, says index IMF expected to cut estimate of 2014 growth to little over 3%

(…) The IMF is expected to cut its estimate of global growth in 2014 from 3.4 per cent to a little over 3 per cent this week as poor second quarter figures from Germany, Japan and other countries weigh on the outlook. As recently as April, the IMF was expecting 3.6 per cent growth this year, faster than the long-term average. (…)

Some other indicators of economic activity are more upbeat. A composite measure of the purchasing managers’ indices for the global economy, compiled by JPMorgan, showed a reasonably high level of growth momentum in September. Rob Dobson, of JPMorgan said if the figures translated into real output, the implied third quarter rise in global gross domestic product was “the best growth outcome since the second quarter of 2010”.

 image

Fingers crossed Will OPEC save the day for everybody with a big global tax cut right on time for year-end shopping?

OPEC Rifts Set Off Price War Discord at OPEC is turning into a price war, loosening the cartel’s grip on oil markets and exacerbating a recent steep selloff.

(…) “No one is telling anyone what they are up to,” one Gulf oil official said.

Saudi Arabia this week unilaterally lowered the price it charges for crude scheduled for delivery next month—without the typical consultation with other members of the Organization of the Petroleum Exporting Countries, according to OPEC officials. The decision surprised many market watchers, who were expecting the Saudis to cut output to help boost prices, and sent prices hurtling lower. (…)

The Saudi decision followed a similar move by the kingdom and Kuwait to lower prices for delivery this month, without informing other OPEC members, according to OPEC officials, effectively undercutting fellow members. (…)

Recent turmoil across the Middle East has scrambled long-held political alliances among some of the group’s most important members. (…)  Many inside and outside the organization doubt whether the group can do much amid its current disarray.

The drop in prices is particularly worrying for OPEC producers in Latin America and Africa that depend on oil revenue to support high spending, as well as Iran, where trade is crimped by international sanctions.

(…) OPEC members are sitting on unused pumping capacity of some 3.8 million barrels a day, equivalent to 4% of global oil supplies, according to the International Energy Agency—spare capacity that could generally be called upon quickly in a pinch. (…)

Last month, Saudi Arabia and Kuwait both cut their October prices for Asian buyers, according to Gulf oil officials and traders, effectively undercutting the U.A.E., a Persian Gulf neighbor and fellow OPEC member. In the past, such cuts would have been taken collectively among Arab Gulf OPEC members. (…)

OPEC’s recent woes have their roots in an unusually public row in 2011. Faced with tight supplies and rising prices amid the political turmoil of the Arab Spring, Saudi Arabia’s longtime oil minister Ali al-Naimi pushed at one meeting to boost production. Delegates failed to agree, and Mr. Naimi stormed out, telling reporters it was “one of the worst meetings we ever had.”

Riyadh boosted production on its own. Since then, the Arab Spring has deepened fault lines between some member governments and created new fissures.

Arab Gulf OPEC members—Saudi Arabia, Kuwait, Qatar and the U.A.E. have long been aligned politically, largely in opposition to neighbor and OPEC colleague Iran. That rivalry has intensified as proxy wars have raged in Iraq and Syria.

At the same time, the Gulf Arab alliance has frayed. Saudi Arabia, Qatar and the U.A.E., for instance, have all backed different factions in the various uprisings that have raged across the Middle East. (…)

image

EARNINGS WATCH
Higher EPS Estimate Cuts in Q3 Relative to Recent Averages, But Below Long-Term Average

Over the course of the third quarter, analysts have lowered earnings estimates for companies in the S&P 500 for the quarter. The Q3 bottom-up EPS estimate  dropped 4.2% (to $29.06 from $30.33) from June 30 through September 30.

During the past year (4 quarters), the average decline in the EPS estimate during the quarter has beenv3.2%. During the past five years (20 quarters), the average decline in the EPS estimate during thevquarter has been 2.7%. During the past ten years, (40 quarters), the average decline in the EPS estimate during the quarter has been 4.5%. Thus, the decline in the EPS estimate recorded during the course of the Q3 2014 quarter was larger than both the trailing 1-year and 5-year averages. However, the decrease was slightly below the 10-year average.

In aggregate, earnings for the third quarter for the S&P 500 are expected to increase by 4.6% on a year-over-year basis. The estimated growth rate today is nearly half the expectation at the start of the quarter (9.0%). The decline in the growth rate can be attributed in part to Bank of America, as analysts included the impact of the company’s settlement with the DOJ in their Q3 estimates.The Energy sector has witnessed the second largest dip in expected earnings growth (to 4.0% from
11.9%) since the start of the quarter.  In addition, 82 companies in the index have guided EPS estimates lower for the quarter.

Looking at forward estimates, analysts are projecting much higher earnings growth in Q4 2014 and the first half of 2015 compared to Q3 2014. However, they are not predicting a substantial improvement in revenue growth, which implies that net margins are expected to increase in future quarters as well. (Factset)

I would expect that Energy companies will see further cuts in their estimates as oil prices have collapsed. In fact, EPS will likely decline in Q4 given that prices could be 15% lower in Q4 YoY.image

Automobile companies and most related industries should also see their estimates decline in coming weeks given the reduced production levels.

  • Earnings: The Almighty Dollar The greenback’s strength won’t dent U.S. companies’ earnings for the latest quarter but could dampen their outlooks going forward.

(…) In just the past three months, the greenback has gained 8.4% against the euro and 7.5% against the yen, big moves in the foreign-exchange market.

And some key emerging economies, for different reasons, have seen sharper slides. The Brazilian real and Russian ruble are 11.6% and 16.5% weaker, respectively, over the same period.

The good news: Currency carnage shouldn’t put a big dent in third-quarter earnings, which start trickling in this week. Management guidance may be cautious about future periods, though. (…)

This is the S&P 500 Index after Friday’s rally which brought it back over “the line”.

spy

Will the MSCI follow? (Chart from the Short Side of Long)

Equity Fund Flows
Gross sparks rate position exodus Turmoil follows exit of former Pimco man

Investors have liquidated hundreds of billions of dollars of positions in interest rate derivatives contracts, an asset class favoured by Bill Gross, in moves that traders suggested showed Pimco cashing in holdings to meet redemption demands.

The massive shift in positions marks the most visible sign yet of the market turmoil that has followed the exit of Mr Gross from Pimco and its resulting efforts to meet redemptions while other investors seek to profit from the dislocation. (…)

After Mr Gross left, Pimco said investors pulled $23.5bn from the Total Return Fund during September, a monthly record. Commodity Futures Trading Commission statistics revealed on Friday that asset managers reduced their long eurodollar futures positions by 868,853 contracts in the week to September 30 – the largest one-week change on record. Each contract has a notional value of $1m. (…)