One Good Sign the Economy Is Staying Strong: Your Payroll Tax Withholdings The U.S. economy grew at a 4.6% annual rate in the second quarter, according to the latest report from the Commerce Department. But leaves are turning brown now and this morning’s report describes what happened from April to June. How has the overall economy performed since then? Here’s some evidence the strength has continued.
One gauge of economic activity goes all the way through this week: payroll tax withholdings. Every day the U.S. Treasury reports the amount of revenue received from withholdings. This creates a handy, real-time gauge of the economy because the tax payment is typically collected from each paycheck. When people get raises, payroll-tax revenue rises the moment an increase goes into effect (and, of course, vice versa).
“If you can figure out a way to correctly interpret the data, it’s never going to get revised and it’s real because nobody pays this tax on income that wasn’t earned,” said Joseph LaVorgna, chief U.S. economist at Deutsche Bank. Mr. LaVorgna takes the 60-day moving average of payroll tax receipts, averaging roughly a quarter’s worth of revenue, and compares it to the same period from a year earlier.
That method shows payroll taxes are bringing in about 5% more revenue than a year ago. Over time this data has often done a decent job of tracking nominal GDP, especially when not distorted by changes in the tax code. In the recession, withholdings fell faster than GDP, but they subsequently bounced upward more quickly.
The data tracks overall wages and salaries in the economy even more closely (though again, the fit is not perfect). There are three factors, of course, that could be behind an increase in aggregate wages and salaries: an increasing number of jobs, increasing real wages, or increasing inflation. With inflation currently on the low side, the withholdings figures suggest a healthy mix of wage and job growth. (…)


Consumers Get Their Groove Back American consumers aren’t back to feeling like their once-invincible selves. But they are strong enough that the odd stumble won’t throw them off their stride.
(…) consumers have plenty of reasons to feel confident. Not only does the labor market look healthy notwithstanding a mildly disappointing July figure for nonfarm payrolls, but factors that have helped consumers live beyond their means in the past are also making themselves felt, though not excessively.
One of those is the willingness of American consumers to allow the stock or housing markets to do their saving for them. Another is spending their future income through borrowing—something that requires not only self-confidence but confident lenders too. (…)
After a long hiatus, consumer borrowing seems to be growing in every category but housing. And credit is rising in more economically sensitive sectors, too. For the first four years of the recovery, from 2009 through 2013, the fastest area of credit growth by far was federal student loans. Auto loans grew less than half as quickly and revolving credit actually shrank. Now credit-card balances are growing again and car loans are at an all-time high.
The personal saving rate this year has averaged 5.2% which, while well below the long-run pace and barely above the 1997-2000 bull-market average, could fall further. The reason is that years of low rates plus shrinking mortgage balances have left total household debt service at an all-time low. (…)
Shale, Saudi Arabia and Islamic State Leave Oil Bulls Sweating Shale oil is blunting the effect of geopolitical strife on oil prices, and Saudi Arabia may not step in to help soon.
(…) Fuel-efficiency gains are just as important. Since 2007, U.S. oil output has risen by about 3.2 million barrels a day. But consumption of oil per dollar of real gross domestic product has dropped by 16%, implying savings of 3.3 million barrels a day.
The U.S. factor leaves oil bulls relying on two other big levers to tighten the market: Chinese demand and supply cuts, with hopes of the latter centering on Saudi Arabia. Neither can be counted on for now.
China has disappointed this year, and the International Energy Agency sees oil demand there rising by just 2.4%, or 242,000 barrels a day. That would be the slowest growth since the crisis year of 2009.
Against this, China has in recent years been building its strategic petroleum reserve, helping support oil prices. However, this is an opaque and lumpy factor on which to base a bull argument. And if Beijing is aware that its own purchases are propping up oil prices, it has an incentive to wait and let them drop further.
With Saudi Arabia, the question is whether it will keep its prices high, thereby limiting demand for its oil, or try to maintain market share. As energy economist Phil Verleger points out, Russia has overtaken Saudi Arabia as the world’s largest oil exporter. If the latter maintains high prices, a de facto supply cut, it risks a classic free-rider problem of rival producers taking market share. And Saudi Arabia is already seeing this happen in its increasingly important Asian markets as Russia signs oil agreements with China; West African producers, squeezed out of North America by shale barrels, are also looking east.
Saudi Arabia enjoys a relatively low break-even oil price to balance its budget: just $89 a barrel this year, Citi estimates, compared with $105 for Russia. Brent has averaged $107 so far, so Riyadh can afford to wait.
It has other incentives to do so. One involves preserving goodwill with the U.S., whose air force is doing the heavy lifting against the existential threat of Islamic State.
Another is to let prices drift lower a bit to squeeze the competition—what John D. Rockefeller used to call a “good sweating” when Standard Oil ruled the market. Just last week, Norway’s Statoil STL.OS +0.69% became the latest oil major to shelve a high-cost Canadian oil sands project.
For Saudi Arabia, trying to preserve the long-term value of its vast oil reserves, prioritizing market share right now makes sense. Such pragmatism won’t help oil bulls seeking a rebound this year.
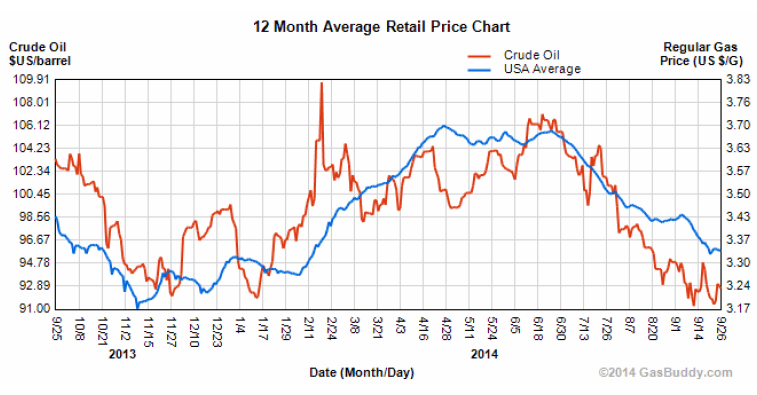
Could it also be that the Saudis are contributing indirectly but efficiently to the Western sanctions against Russia? For U.S. consumers, gasoline prices are essentially in line with last year’s level at this time WTI is 10% lower. Gas prices drifted another 7% to Thanksgiving last year providing a welcomed yearend boost to discretionary spending.
Global Crude Oil Demand Growth Slowing
(…) The latest global crude oil demand and supply data from Oil Market Intelligence (OMI) provides additional evidence of the slowdown of global growth this year. While world oil demand rose during August to a record high of 92.7mbd (using the 12-month average to smooth out the volatile monthly data), it was up just 0.8% y/y. That’s down from a recent peak of 1.7% last September, and the lowest growth since May 2012.
Demand growth among the advanced economies of the OECD remained slightly negative for the fifth consecutive month. It has been mostly negative since September 2011. Among the other economies, growth was 1.9% during August, the lowest since September 2009.
By the way, I also track the ratio of global crude oil demand to supply using the OMI data. It starts in 1994. Our ratio tends to track the y/y percent change in the price of a barrel of Brent crude oil. It has been edging lower in recent months, coinciding with the weakness in Brent.

Expect More Volatility With Stocks Priced Near Perfection One reason stocks were so troubled last week is that they are getting closer to what Wall Street, in its inimitable slang, calls being “priced for perfection.”
Priced for perfection, unfortunately, doesn’t mean attractive. It means that stock prices are so high that gains depend on a very favorable investing environment, with strong corporate profits, low interest rates, low inflation and continued global growth.
If the environment starts looking less favorable, stocks can weaken, as they did last week. (…)
When cracks widen in the investing backdrop and stocks are pricey, traders are quicker to sell. And cracks are widening. Among them: Next year’s expected Federal Reserve interest-rate increases, which are appearing now on investors’ radar screens, growing tensions with Russia and renewed concerns about China’s uncertain economic growth. (…)
Small Caps Miss Out on Rally Shares of small companies have struggled even as blue chips skipped higher. But while small caps look cheaper and the economy is showing strength, investors aren’t ready to pile back in.
(…) Given that periods of market turmoil tend to buffet small stocks more than their larger counterparts, many investors in small companies are fearful as the Federal Reserve moves toward raising interest rates. Even investors hopeful for small stocks are proceeding with caution.
While the S&P 500 holds a respectable 7.3% gain for the year, the Russell 2000—the widely followed index for small-capitalization stocks—is far behind. The Russell 2000 is down 3.8% for the year and off 7.4% from its most recent high in July, leading some fund managers to fear a correction, or a fall of 10% from the peak.
(…) At the end of 2013, the Russell notched a price/earnings ratio of nearly 20 times the next 12 months’ expected earnings, compared with an average of 16.9 since 1994, according to Russell Indexes. (…)
During previous stock-market pullbacks triggered by rate increases, small stocks fell an average 13%, while large caps took a 9% hit, according to a recent Credit Suisse report looking at data going back to 1986. (…)
The threat of a rate increase is a main reason investors have been heading for the exit, pulling $15 billion from U.S. small-stock mutual funds and exchange-traded funds this year, according to fund-tracker Lipper, after sending $22.6 billion into the space in 2013.
(…) The Russell 2000, now at around 17 times expected earnings, is trading nearer to its historical average. (…)
Some investors say the worst could be over for small caps thanks to improvement in the U.S. economy. The U.S. has looked like a standout amid recent weakness in other global economies such as Europe and China.
Small publicly traded U.S. companies get 79% share of their sales domestically, according to S&P Capital IQ, a higher proportion than large companies, which get roughly 54% of their sales from home. (…)
Another reason small stocks have been hit this year is they have been relatively lacking in deal activity, a driver of this year’s stock-market advance, noted BlackRock’s Mr. Jamieson. (…)
Analysts expect small firms’ third-quarter earnings to grow 9.1% from last year, and fourth-quarter profits to grow 18% from the year before, according to Bank of America Merrill Lynch. (…)


 Brian Johnston, chief operating officer of Mattamy Homes Ltd., a closely held Canadian builder that operates in five U.S. states, described the new-home market as choppy in recent weeks. Mattamy’s August sales in the U.S. “picked up smartly” from year-earlier figures, but that momentum fizzled in the past two weeks, he said.

