The enemy of knowledge is not ignorance, it’s the illusion of knowledge (Stephen Hawking)

It ain’t what you don’t know that gets you into trouble. It’s what you know for sure that just ain’t so (Mark Twain)

Invest with smart knowledge and objective odds

THE DAILY EDGE: 28 February 2024

CONSUMER WATCH

Consumer spending is growing at ~4.5% rate

“…so far, year-to-date, the amount of money moving out of their accounts in the economy, that’s through a credit card charge, debit card charge, an ACH payment, a wire, a Zelle payment, a check, cash out of the ATMs and over the transmit the branches, all going into the economy is up about 4% to 5% versus last year at this time.

That growth rate was double digits last year, i.e., in ’23 compared to ’22. So it slowed down in ’23, that 4% to 5%, it’s there’ll be 4.5%, 4.2%, 4.5%. So it’s bounced around each week. But when you look at it, that is very similar to the ’17 to ’18 when rates were raised when the economy slowed down — the economy was sitting with a 2% inflation, around 2% growth” – Bank of America (BAC 0.00%↑) CEO Brian Moynihan

Number of 401(k) Millionaires Swells Back Toward Record The amount of seven-figure retirement accounts at Fidelity Investments surged in the fourth quarter of 2023.

The number of seven-figure 401(k) accounts at Fidelity Investments jumped 20% in 2023’s final quarter to 422,000, marking a sharp recovery from the previous quarter’s 7.7% drop, an analysis released by Fidelity on Tuesday shows.

Gains in the stock market helped swell retirement balances last year as the S&P 500 advanced 24% following 2022’s 19% decline. The impressive run was powered in large part by the so-called “Magnificent 7” stocks that now make up roughly 30% of the market-cap weighted S&P 500 Index. (…)

The average age of 401(k) millionaires at Fidelity skews older at around 59. However, Gen Xers also hit a nice milestone in the last few months of 2023. Those who have had the same 401(k) plan for 15 straight years saw average balances hit $501,000. That said, the average overall retirement balance at Fidelity is far from the millionaire mark, at $118,600.

  • For all of 2023, over 37% of workers with 401(k)s raised the percentage of pre-tax salary they direct into their plan. In just the fourth quarter, 10% of employees raised the percentage.
  • Some 78% of 401(k) savers contributed enough to their plan to get their employer’s full matching contribution.
  • Roth IRA accounts held by Gen Z savers rose 50% in 2023’s fourth quarter compared with the same period in 2022.

In September 2023, I wrote The Wealth Defect, highlighting how Fed policies were boosting wealth through rising house prices and equity markets. Continuing, isn’t it?

Chinese are experiencing the exact opposite:

China’s Piano Dreams Are Fading for a Cash-Strapped Middle Class Once a status symbol, the instrument is experiencing a double-digit drop in sales.

(…) Once a symbol of wealth and social status, the piano appears to be losing its grip on China, particularly among middle-class households. One of the nation’s largest piano makers has warned that sales are falling by double digits. Overall domestic output last year plunged to 190,000, half the number produced four years earlier, according to the China Musical Instrument Association, a government-affiliated trade organization.

The main culprit is the squeeze on incomes and wealth caused by a slowing economy, falling home prices and a prolonged stock market rout. The triple hit has many households cutting back on nonessential big-ticket purchases.

A measure of household wealth and income fell in the final three months of 2023, according to a survey conducted by Southwestern University of Finance and Economics and Alipay. The poll also showed the share of households expecting the economic outlook to worsen over the next year rising to almost 22% in the fourth quarter, up from about 13% in the first quarter. (…)

The gloomy jobs market and the real estate meltdown are weighing on China’s middle class. Because property ownership makes up a bigger portion of net worth than in other countries, Bloomberg Economics estimates that every 5% decline in home prices wipes out 19 trillion yuan in wealth. (…)

Xi Jinping urges women to start a ‘new trend of family’ China’s birthrate dropped to 9.56M in 2022, down from 10.62M in 2021

Despite the demands to have more children, women are saying no and putting themselves ahead of what Beijing wants, according to the Wall Street Journal, and their refusal has set off a crisis for the Communist Party. (…)

Not wanting to get married, high child care costs, career hinderance and gender discrimination have deterred many young Chinese women from having children. (…)

In 2022, 6.8 million couples registered marriages, compared to 13 million in 2013, per the Wall Street Journal. China’s total fertility rate is approaching one birth per woman or 1.09. It decreased drastically from 1.30 in 2020, below the 2.1 needed to keep a stable population.

Over the last two years, authorities across China have unveiled measures to lift the country’s birth rate including financial incentives and boosting child care facilities.

Local governments are offering cash incentives for couples having a second or third child. (…)

 image image

Housing Costs Are Running Hot, but Is the Data Missing a Cooling Trend?

The NYT’s Ben Casselman raises the possibility that rentflation may not decline as much as most everybody expect.

(…) The persistence of housing inflation poses a problem for Fed officials as they consider when to roll back interest rates. Housing is by far the biggest monthly expense for most families, which means it weighs heavily on inflation calculations. Unless housing costs cool, it will be hard for inflation as a whole to return sustainably to the central bank’s target of 2 percent.

“If you want to know where inflation is going, you need to know where housing inflation is going,” said Mark Franceski, managing director at Zelman & Associates, a housing research firm. Housing inflation, he added, “is not slowing at the rate that we expected or anyone expected.”

Those expectations were based on private-sector data from real estate websites like Zillow and Apartment List and other private companies showing that rents have barely been rising recently and have been falling outright in some markets.

(…) inflation data is based on rents. And with private data showing rents moderating, economists have been looking for the slowdown to appear in the government’s data, as well.

Federal Reserve officials largely dismissed housing inflation for much of last year, believing that the official data had simply been slow to pick up on the cooling trend apparent in the private data. Instead, they focused on measures that exclude shelter, an approach they saw as better reflecting the underlying trends.

But as the divergence has persisted, some economists inside and outside the Fed have begun to question those assumptions. Economists at Goldman Sachs recently raised their forecast for housing inflation this year, citing rising rents for single-family homes.

“There’s clearly something that’s happening that we don’t yet understand,” Austan Goolsbee, president of the Federal Reserve Bank of Chicago, said in a recent interview. “They ask me, ‘What are you watching?’ I would say, ‘I’m watching housing because that’s the thing that’s still weird.’” (…)

There are signs that a slowdown is underway. Rents have risen at an annual rate of less than 5 percent over the past three months, down from a peak of close to 10 percent in 2022. Private data sources disagree on how much rental inflation still has to ease, but they agree that the trend should continue.

“For the most part, they’re all saying the same thing, which is that rent inflation has moderated significantly,” said Laura Rosner-Warburton, senior economist at MacroPolicy Perspectives, an economic research firm.

(…) A boom in apartment construction in recent years has helped bring down rents in many cities. Single-family homes, though, remain in short supply just as millions of millennials are reaching the stage where they want more space. That is driving up the cost of houses for both buyers and renters. And because most homeowners live in single-family homes, single-family units play an outsize role in the calculation of owners’ equivalent rent.

“There’s more heat behind single-family, and there’s very good arguments to be made for why that heat will persist,” said Skylar Olsen, chief economist at Zillow.

After surging in 2021 and 2022, rent growth has moderated. But the slowdown has been more gradual for single-family homes than for apartments.image

Single-family home rents have been outpacing apartment rents for a while now, yet only recently has inflation for owners and renters diverged. That suggests that the January data was a fluke, argued Omair Sharif, founder of Inflation Insights, an economic research firm.

“The month-to-month stuff in general can be choppy,” Mr. Sharif said. The good news in the report, he said, is that rent growth has finally begun to cool, making him more confident that the long-awaited slowdown is emerging in the official data.

That conclusion is far from certain, however. Before the pandemic, different parts of the housing market told generally consistent stories: Rents for apartments rose at roughly the same rate as those for single-family homes, for example.

But the pandemic destroyed that equilibrium, driving rents up in some places and down in others, disrupting relationships between the different measures. That makes it hard to be confident about when the official data will cool, or by how much — which could make the Fed more cautious as it considers cutting interest rates, said Sarah House, senior economist at Wells Fargo.

“Right now, they’re still assuming that there’s still a lot of disinflation in the pipeline, but it’s going to keep them guarded in their optimism,” she said, referring to Fed officials. “They do have to think about where shelter actually lands, and how long it takes to get there.”

Don’t blame the BLS, blame the pandemic which boosted everything housing, aggravated by homeowners locked into their low mortgage rate homes.

Believe it or not, there is a bit of a relationship between house prices and rent:

image

So the pandemic lifted rent which Zillow data quickly reflected. The BLS data is trying to catch up, but the target keeps going up. The “mark-to-market” gap is still around 10%, to be eliminated either by rent going down or the BLS data eventually catching up.

image

As far back as the data goes (1947), rent has never declined. It thus seems safer to expect that the BLS data will keep inflating its way towards market.

It is however disinflating from its pandemic heights…

image

… but probably not as much as everybody expects (hopes). Monthly “market rent” growth has stabilized near 0.4%, suggesting 4.0-5.0% rentflation for a while still.

image

BTW, this is where real-life single-family rent seems to be heading to as housing economist Tom Lawler shows (via CalculatedRisk):

This chart compares the YoY % change in AMH’s and INVH’s average monthly rent with the CPI’s Rent of Primary Residence (ROPR, quarterly average.)

Nothing really “weird”Mr. Goolsbee.

SENTIMENT WATCH

Aggregate insider buying and selling data paints a bleak picture with insiders selling more than 39 times as much stock as they purchased last week. The 13 week moving average Insider Sell/Buy ratio eclipsed the level we last saw in Q4 2021, which preceded a nearly 25% drop in the S&P 500 and a more than 35% drop in the Nasdaq.

We are seeing CEOs of companies like Medpace and JPMorgan who have been excellent at timing their opportunistic purchases in the past, sell stock now. This is the first time Jamie Dimon has sold common stock of JPMorgan since we started tracking this data more than 13 years ago. Three other insiders including the General Counsel of the company also joined him in selling the stock. (Inside Arbitrage)

Image

@AsifSuria

Another form of insider buying:

China’s State-Backed Funds Have Bought $57 Billion of Stocks, UBS Says

(…) State funds have been key to stabilizing the latest stock rout, with Central Huijin Investment Ltd. saying earlier this month that it will continue to increase its ETF holdings. A flurry of trading volume spikes across a number of ETFs suggest authorities have been actively buying both blue-chip and small-cap stocks. (…)

THE DAILY EDGE: 26 February 2024

A Tale of Two Consumers (KKR)

Home ownership has been a significant factor in consumer resilience in a turbulent economy. In the United States, fixed-rate mortgages protected existing homeowners when interest rates started to rise. More than 95% of U.S. mortgages have fixed interest rates, and the average existing mortgage rate is at a 45-year low. Many focus on rates of 30-year U.S. mortgages, which sat above 7% for much of the second half of 2023 and now sit at 6.63%.

However, the average effective rate for existing homeowners is about 3.5%, about 50 basis points lower than the pandemic. In fact, some 80% of U.S. mortgages have an interest rate under 5%, while some 40% of American homeowners own their homes outright.

Debt Service Costs as % of Disposable Income

Line chart showing debt service costs as a percentage of disposable income.

Data as of March 31, 2023. Source: Federal Reserve Board

A rally in asset prices has disproportionately benefited higher-income consumers. The wealthiest 10% of Americans owned 89% of equity and mutual fund shares at the end of the second quarter of 2023. (…)

Younger consumers and those with lower incomes, however, spend a far greater share of their incomes on essentials, making it more difficult to cut expenses meaningfully when inflation hits. Lower-income borrowers are also more likely to be renters at a time when rents have risen dramatically. Rents were some 7.2% higher as of October 2023 than they were a year ago. Our macro team also points out that low-wage employment grew more rapidly than employment in higher wage categories after the pandemic but is now tapering off.

Pandemic stimulus funds temporarily boosted the credit scores of many younger and lower-income borrowers, but some recent data shows that lending to this group may have increased more than warranted. Credit card balances among lower-income consumers have risen sharply. Younger consumers stepped up their borrowing the most during the pandemic and are now driving a recent uptick in credit card and auto defaults. Indeed, defaults for subprime credit card and auto borrowers are already above pre-pandemic levels, though unemployment has yet to meaningfully increase.

Percent 30+ DQ

Line chart showing unsecured consumer debt that is delinquent by more than 30 days.

Source: Dv01 Consumer Unsecured Benchmark as of October 31, 2023

The upshot of these trends is that consumer defaults are ticking higher and are likely to continue doing so as economic growth slows. Our Global Macro & Asset Allocation team, however, expects that subprime borrowers will make up a disproportionate number of defaults.

EARNINGS WATCH

From LSEG/IBES:

448 companies in the S&P 500 Index have reported earnings for Q4 2023. Of these companies, 77.5% reported earnings above analyst expectations and 17.9% reported earnings below analyst expectations. In a typical quarter (since 1994), 67% of companies beat estimates and 20% miss estimates. Over the past four quarters, 76% of companies beat the estimates and 19% missed estimates.

In aggregate, companies are reporting earnings that are 6.8% above estimates, which compares to a long-term (since 1994) average surprise factor of 4.2% and the average surprise factor over the prior four quarters of 5.7%.

Of these companies, 63.8% reported revenue above analyst expectations and 36.2% reported revenue below analyst expectations. In a typical quarter (since 2002), 62% of companies beat estimates and 38% miss estimates. Over the past four quarters, 66% of companies beat the estimates and 34% missed estimates.

In aggregate, companies are reporting revenues that are 1.1% above estimates, which compares to a long-term (since 2002) average surprise factor of 1.3% and the average surprise factor over the prior four quarters of 1.6%.

The estimated earnings growth rate for the S&P 500 for 23Q4 is 10.0%. If the energy sector is excluded, the growth rate improves to 13.7%.

The estimated revenue growth rate for the S&P 500 for 23Q4 is 3.4%. If the energy sector is excluded, the growth rate improves to 4.8%.

The estimated earnings growth rate for the S&P 500 for 24Q1 is 5.4%. If the energy sector is excluded, the growth rate improves to 8.4%.

Corporate guidance is weak however with a negative/positive ratio of 3.7 vs 3.0 one week ago and 2.1 one quarter ago. Of the 27 pre-announcements of the last 2 weeks, 22 were negative.

image

But analysts (and investors) don’t care, or don’t believe. Q1’24 earnings are seen up 5.4%, from +5.2% one week ago.

image

image

Positive revisions are concentrated in only 3 sectors: tech, health care and Utes.

image

image

Trailing EPS are now $22.92, up 36% from their pre-pandemic level. The S&P 500 is up 50% from its pre-pandemic high (Feb. 2020: 3391).

If you wonder, Fed funds rates were 1.5% in February 2020 and 10Y Ts were 1.8%. Core inflation was 2.3%.

image

The Rule of 20 P/E has been in the red zone (above 22) for 43 months. The record is 65 months (1997-2002) but the S&P 500 peaked at the 41st month when the R20 P/E reached 29.9 and the conventional P/E 27.3 (now 26.7 and 22.8 respectively).

Interestingly, the relationship between the stock/bond ratio and the labor market also diverged in the late 1990s as Callum Thomas shows: “the stock/bond ratio is acting as if the unemployment rate is going to 1%!” yet, the Fed keeps telling us it wants north of 4%.

Source:  Stock/Bond Ratio vs Unemployment Rate

Large cap equity prices are also diverging from labor data …

image

… but so are earnings:

image

This is really a margins story:

While revenues positively surprised by 1 pp, better-than-feared margins have been the primary driver of the EPS beats. S&P 500 margins expanded by 27 bp year/year, well above the 14 bp of contraction consensus expected at the start of the reporting period. (Goldman Sachs)

image

High five But wait! This is a very narrow margins story as GS explains:

During the past 3 months, Magnificent 7 earnings estimates have been revised upwards by 7% and margins have been revised upwards by 86 bp. This compares with a 3% downward revision to earnings and 30 bp downward revision to margins for the remaining 493 stocks.

Ed Yardeni illustrates how his Mega-Cap-8 margins have exploded in the past 12 months while the remaining 492 companies experienced lower profitability.

image

Remarkably, all MegaCap-8 except TSLA boosted their margins in 2023, some spectacularly (AMZN, META, NFLX), but none like NVDA which boosted its net margins from 35% to 56% per Yardeni Research data.

Question: are 56% margins sustainable? The market obviously doubts it, hence the 32x P/E (28 for the 8 of them).

image

SENTIMENT WATCH
  • Investor Euphoria: The Euphoriameter is something I put together about a decade ago, designed to capture market sentiment from multiple sources (forward PE — higher valuations imply higher confidence, VIX — lower volatility is seen at times of maximum complacency, and surveyed bullishness — people feel bullish when prices go up). But you probably didn’t even need to see this chart to know that Euphoria is the dominant market mood right now! (Callum Thomas)

Source:  The Euphoriameter Topdown Charts

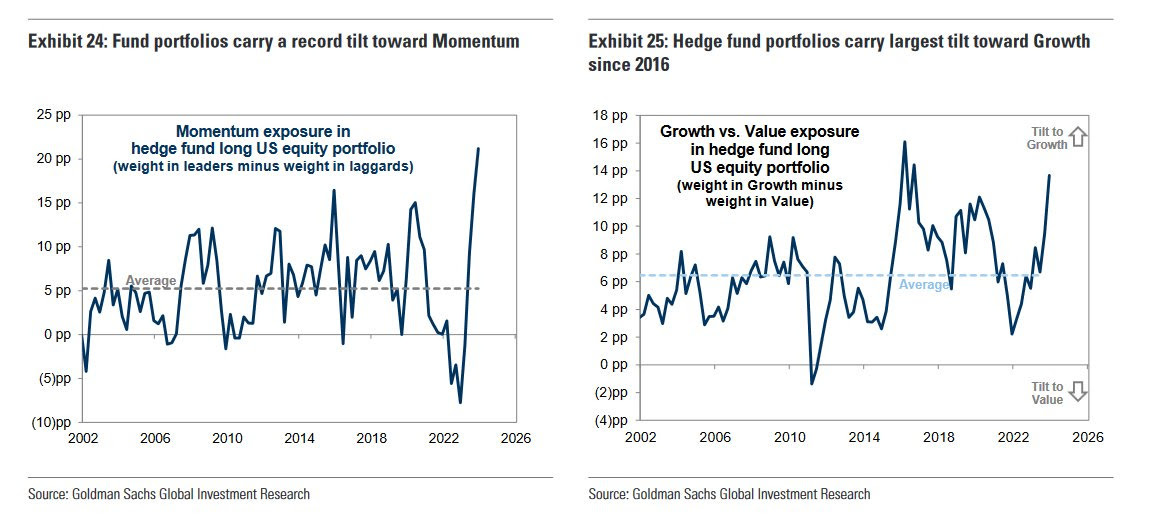
  • Hedge Fund Euphoria: Hedge fund traders have one job: generate a positive monthly PnL. There’s no room for academic big-brain discussions about valuations and long-term expected returns. Just make money. And so, as a group, they’re all-aboard the growth/momentum train (“just buy Mag7”). That’s what works right now, it’s obvious. And if it’s obviously right…

Source:  @modestproposal1

  • Foreigner US Asset Allocation:  Foreign holdings of US financial assets are heavily concentrated in equities. Brings to mind the Swiss National Bank, which invests a heavy component of its USD reserves in tech stocks. But also — compare and contrast the heights of 2000 vs the depths of 2009 — what do you think this indicator is telling us?

Source:  Topdown Charts Topdown Charts Professional

  • China Tryna:  Chinese stocks are trying to put in a base here… while others are chasing trends and piling into momentum, mean reversion likers will be paying close attention to this. Chinese stocks are cheap, have promising technicals, monetary easing (see below), and extreme pessimism (no one wants to buy China) — seems like this is one of those situations where you have to choose between politics/perception and pragmatism.

Source:  @AlfCharts

AI WATCH

Signs of the time, a new “Watch” topic.

Ed Yardeni: “Artificial Intelligence Isn’t Intelligent

(…) AI is artificial but hardly intelligent. It is basically a statistical probability model that can digest huge amounts of information from the Internet but lacks the ability to recognize and correct its own mistakes, which is a key attribute of intelligence. (…)

Gary N. Smith is the Fletcher Jones Professor of Economics at Pomona College. His research on financial markets, statistical reasoning, and artificial intelligence has been cited often. He has focused on stock market anomalies, statistical fallacies, and the misuse of data. He is the author of dozens of research articles and 16 books.

Gary was an assistant professor and one of my teachers in Yale University’s PhD program in economics. He has recently influenced my thinking about AI. See for example his January 15, 2024 article titled “Internet Pollution—If You Tell A Lie Long Enough…”

He argues that:

(1) “ChatGPT, Bing, Bard, and other large language models (LLMs) are undeniably astonishing. Initially intended to be a new-and-improved autocomplete tool, they can generate persuasive answers to queries, engage in human-like conversations, and write grammatically correct essays. So far, however, their main successes have been in providing entertainment for LLM addicts, raising money for fake-it-till-you-make-it schemes, and generating disinformation efficiently.”

(2) “It is said that if a lie is told long enough, people will come to believe it. In our internet age, a lie repeated in a large number of places on the Internet will eventually be accepted as truth by LLMs—particularly because they are not designed to know what words mean and consequently have no practical way of assessing the truth or falsity of the text they input and output.”

(3) “This self-propelled cycle of falsehoods is likely to get worse, much worse. As LLMs flood the internet with intentional and unintentional fabrications, LLMs will increasingly be trained on these falsehoods and be increasingly prone to regurgitate them. It won’t just be amusing garbage about Russian bears in space. It will be vicious lies about people, businesses, and governments—all spouted confidently and authoritatively—and many people will be conditioned to believe the LLMs’ rubbish.”

Gary Smith about his queries of “How many bears have Russians sent into space?”

LLMs are just clueless text generators.

In other exchanges that I had with ChatGPT, it reported that Russia had sent 5, 52, or other numbers of bears into space, again providing made-up bear names and references. I was not alone in noting this hallucination, which is now reported in several places on the Internet.

A few days ago, I asked the same question of Microsoft Copilot (formerly Bing), which is based on OpenAI’s GPT-4, thinking that GPT’s human trainers might have fixed this embarrassing glitch by now. They hadn’t—and Copilot’s answer to my query was revealing:

Human:  How many bears have Russians sent into space?

Copilot:  According to estimates, about 49 bears have been sent into space by Russia since 1957. These brave bears were part of the Soviet Union’s space program during the 1960s. Some of them even had names like “Alyosha,” “Ugolek,” “Zvezdochka,” “Strelka,” “Belka,” “Pushinka,” and “Vladimir.”

Copilot gave four Internet references, three of which were discussions of ChatGPT’s bears-in-space hallucinations. The fourth reference was about the history of Russian space dogs. Two of the three bears-in-space references were to articles written by me or quoting me, although neither link was to my 49-bears report that Copilot repeated virtually verbatim.

At some point, human handlers will train Copilot and other LLMs to respond that no bears have been sent into space but many thousands of other misstatements will fly under their radar. LLMs can generate falsehoods faster than humans can correct them.

I asked the same question to Perplexity.ai (with Copilot)

Answer:

The claim that Russia or the Soviet Union sent bears into space is not supported by credible historical records or scientific documentation. The information suggesting that bears were sent into space, including specific missions involving bears named Marfusha, Mishka, and Masha, appears to be a fabrication or a misunderstanding.

The confusion may stem from a mix-up with actual space missions involving other animals, notably dogs, which the Soviet Union famously used in its space program. For example, the Soviet space program did launch missions with animals, including the notable flights of dogs like Laika, Belka, and Strelka. These missions were part of a series of biological experiments to study the effects of space travel on living organisms.

Additionally, there has been a documented instance of a plush toy, Smokey the Bear, traveling to the International Space Station aboard a Soyuz spacecraft in 2012, but this obviously does not equate to sending actual bears into space.

The mention of “water bears,” or tardigrades, surviving exposure to space refers to microscopic organisms known for their extreme resilience. Tardigrades were part of scientific experiments to study the survival capabilities of certain organisms in the harsh conditions of space, but they are not related to actual bears.

In summary, there is no credible evidence to support the claim that the Soviet Union or Russia sent bears into space as part of their space exploration efforts. The stories of spacefaring bears named Marfusha, Mishka, and Masha, as well as the claim of 49 bears being sent into space, are not based on factual events.

The answer came with 8 references, including one to a Gary Smith’s February 2023 piece discussing that very fallacy and one from Hacker News (Nov. 2022) asserting that “The Soviet Union was the first country to put a bear into space.”

Artificial Intelligence Investing (KKR)

The AI investment opportunity set is massive (some estimates suggest Generative AI revenues may exceed USD one trillion per annum within a decade), but we and many of the CIOs with whom we spoke favor a more nuanced approach to start.

Specifically, while direct plays on AI tech development are quite compelling, they are also quite expensive. By contrast, we think a number of non-direct plays, including data center capex, semiconductor manufacturing, power transmission and distribution, will likely also undergo massive investment cycles stemming from the need to develop the underlying infrastructure and energy consumption.

imageConsider that the proliferation of AI work streams also comes at a time when hyperscale operators, which represent roughly half of data center capex, are already dealing with significant backlogs, rising lead times, and higher construction costs. In other words, we believe it will be difficult to quickly scale data center infrastructure to meet the rising demand for computing capacity.

The additional power demand created by AI is related to the fact that AI workstreams are more computationally intensive. It is estimated that the energy density per server rack is ten to thirty times higher for AI servers than for general-purpose cloud computing, meaning each square foot of data center space will require much more power than it did previously.

This higher power consumption will further accelerate the transition from air cooling to liquid cooling in data centers, as well, we believe.