The enemy of knowledge is not ignorance, it’s the illusion of knowledge (Stephen Hawking)

It ain’t what you don’t know that gets you into trouble. It’s what you know for sure that just ain’t so (Mark Twain)

Invest with smart knowledge and objective odds

THE DAILY EDGE: 3 January 2024

Did you miss: Economic Scenarios?

MANUFACTURING PMIs

US manufacturing performance declines at sharper pace as demand conditions weaken

The seasonally adjusted S&P Global US Manufacturing Purchasing Managers’ Index™ (PMI) posted 47.9 in December, down from 49.4 in November and lower than the earlier released ‘flash’ estimate of 48.2. The latest decline in the health of the sector was modest overall and the quickest since August.

image

Contributing to the overall decline in operating conditions was a sharper fall in new orders during December. The decrease in sales quickened and was the fastest since August. Many companies stated that weak client demand stemmed from lower purchasing power at customers and global economic uncertainty.

External demand conditions also faltered, as new export orders returned to contraction territory. The pace of decline was only fractional, however.

Subsequently, firms lowered their production levels for the first time in four months at the end of 2023. Output dropped at a modest pace that was the fastest in six months. Some companies also suggested that higher input prices weighed on purchasing decisions, which in turn slowed production processes.

At the same time, cost burdens rose at a quicker pace. Hikes in supplier prices for metals and plastics, alongside greater transportation charges, reportedly drove the uptick in inflation. The pace of increase in input prices was slower than the historical series average, however.

Despite a sluggish sales environment, firms opted to pass through higher costs to customers in December. Selling prices rose at a solid pace that was the steepest since April.

At the same time, muted client demand led to a third successive monthly drop in employment at the end of 2023. The rate of job shedding was slightly quicker than that seen in November and the joint-sharpest since June 2020. Manufacturers reported on the non-replacement of voluntary leavers in a bid to cut costs amid lower new orders.

Evidence of spare capacity remained, however, as backlogs contracted at a steeper pace. Although employment fell again, firms were able to process incoming new work in a timely manner. Moreover, the pace of backlog depletion was the strongest since July. (…)

Firms sought to rundown stocks amid cost-cutting initiatives, with both pre- and post-production inventories declining in December. Nonetheless, lower than anticipated new orders led to slower rates of decrease, according to panellists. (…)

Canada: Manufacturing downturn deepens in December

The downturn in Canada’s manufacturing sector intensified during December, with accelerated declines in both output and new orders signalled. There was also a return to job shedding, whilst confidence in the future remained subdued in the context of the survey history. Prices rose again, despite further evidence of deteriorating demand for inputs and improved supply. (…)

image

Mexico: Manufacturers step-up input buying at year-end as new orders rise

The headline S&P Global Mexico Manufacturing Purchasing Managers’ Index™ (PMI®) slipped to 52.0 in December, from 52.5 in November, and pointed to a moderate improvement in the health of the sector that outpaced the series trend. Moreover, favourable readings throughout the latest three months rounded off the best quarterly performance for the sector since Q1 2018. (…)

Although new work intakes rose further at the end of 2023, growth lost momentum. The rate of expansion was moderate and the slowest for three months, but remained above the long-run series average. Where sales increased, goods producers mentioned healthy client appetite and favourable demand conditions.

A key aspect of the slowdown in total sales growth was weakness in international sales trends. New export orders decreased for the fourth month in a row during December, though to the least extent over this period.

image
Eurozone manufacturing sector finishes 2023 with another strong reduction in output

The HCOB Eurozone Manufacturing PMI, compiled by S&P Global, rose marginally in December to 44.4, from 44.2 in November. Crucially, the headline index remained in sub-50.0 territory, indicating a further month of deteriorating operating conditions faced by factories across the single-currency union. According to data split by the three main industrial groups, challenges were their most acute for intermediate goods producers, as has generally been the case across the manufacturing industry’s current downturn (which has been ongoing for a year-and-a-half).

image

The increase in the HCOB Eurozone Manufacturing PMI primarily reflected softer deteriorations in Germany and Italy. Notably, France, the second-largest economy in the euro area, recorded the strongest worsening of business conditions in over three-and-a-half years. Greece remained the solitary area of improvement, with growth edging up to a four-month high.

The level of factory production across the euro area continued to shrink in December, with the rate of contraction accelerating slightly. Overall, the pace of decline was strong, albeit the second-weakest since May. France was the main driver of the latest fall, country-level data showed.

Output continued to be constrained by a lack of new business as demand for eurozone goods decreased once again. Although the decline was the softest for seven months, it was sharp nevertheless. New orders from external customers were also down on the month, extending the current sequence of shrinking export sales to nearly two years.

Sustained weakness in demand conditions led firms to make further progress with backlogs. The volume of work outstanding decreased further, highlighting another month of spare capacity across the euro area manufacturing sector. The rate of depletion, albeit sharp, was the slowest since May. Subsequently, factory employment across the eurozone continued to fall, in line with the trend since last June.

A slower rate of decline was also seen in purchasing activity during December. Although eurozone manufacturing companies continued to cut input buying at a considerable rate, the reduction was the weakest in seven months. Stocks of purchases were depleted more rapidly, however, and to one of the greatest degrees in the survey history. Amid sustained inventory reductions and lower demand for inputs, the latest survey data signalled a further improvement in suppliers’ delivery times. The extent to which vendor performance improved was the smallest in almost a year.

Meanwhile, growth expectations for the coming year improved in December. Overall, eurozone manufacturers were their most confident in the outlook for production since last April, although the prevailing level of optimism was still subdued by historical comparisons.

Turning to prices data, eurozone factory input costs continued to decrease at the end of 2023, as was the case in the previous nine months. This presented manufacturers with a greater allowance over their own pricing decisions, with the latest survey data indicating another month of discounting. That said, the extents to which input prices and output charges fell were the least marked for eight and seven months, respectively.

China: Manufacturing sector growth picks up in December

The headline seasonally adjusted Purchasing Managers’ Index™ (PMI) edged up from 50.7 in November to 50.8 in the final month of 2023. This signalled an improvement in the health of the sector for the fourth time in the past five months, albeit one that remained marginal overall.

image

The slight uplift in the headline index was partly due to a stronger rise in new orders during December. Although modest, the latest increase in overall sales was the quickest recorded since February, with particularly strong demand for consumer goods.

Companies often mentioned that improved market conditions and greater client spending had supported the latest rise in new work. At the same time, the downturn in new foreign sales moderated in December, with new export business declining at a marginal rate that was the weakest in six months.

image

Higher amounts of new orders led manufacturers to raise output for the second straight month in December. The rate of growth was the most pronounced in seven months, albeit modest overall. Despite the quicker increases in production and sales, manufacturers maintained a cautious approach to staffing levels. Notably, employment across the sector fell for the fourth straight month, and at the quickest pace since May.

Firms often mentioned that they had opted not to replace voluntary leavers or trimmed headcounts as demand was more subdued than expected. Moreover, companies indicated that capacity pressures eased in December, with backlogs of work falling for the first time in seven months.

Purchasing activity meanwhile stagnated after a marginal rise in November. A number of companies cited greater usage of existing stocks to cut costs, driving a further marginal drop in inventories of inputs. Stocks of finished goods meanwhile increased slightly, partly due to the delayed shipment of items to clients. (…)

Although input costs continued to rise at the end of the year, the rate of inflation moderated to a four-month low and was only marginal. Concurrently, firms signalled only a fractional rise in selling prices, with companies often reluctant to pass on higher expenses to clients amid greater market competition. (…)

ASEAN manufacturing sector slips back into contraction territory during December

The headline S&P Global ASEAN Manufacturing Purchasing Managers’ Index (PMI®) fell from 50.0 in November to 49.7 in December, indicating a deterioration in the health of the ASEAN manufacturing sector for the third time in the past four months. That said, the rate of decline was only marginal. (…)

Weighing on the headline ASEAN Manufacturing PMI was a further deterioration in overall client demand in December. New business across the region has now declined in each of the past four months. Though modest, the pace of contraction was the fastest since August 2021. Demand conditions were weak across overseas markets as well, with new export business also falling again in December. Consequently, growth of factory output weakened, with the latest upturn the slowest in the current 27-month period of expansion. (…)

image

MORE ON CHINA

China’s Workers Suffer Biggest Drop in Hiring Salaries on Record Average wages for new hires fell by most since at least 2016

Average salaries offered by companies to new hires in 38 key Chinese cities fell 1.3% to 10,420 yuan ($1,458) in the fourth quarter of 2023 from a year ago. That was the worst drop since at least 2016, according to data from online recruitment platform Zhaopin Ltd. compiled by Bloomberg.

It’s also the third straight quarter of decline, the longest run since data on yearly changes were first available in 2016.

In Beijing, the wages decreased 2.7% from a year ago in the fourth consecutive quarter of contraction. Salaries in the southern metropolis of Guangzhou fell 4.5%.

The data highlights the mounting deflation risks faced by China going into 2024, which weigh on its growth outlook. A gloomy job market means residents could pare back their spending, adding to downward pressure on consumer prices that are already falling at the steepest pace in three years.

It also bodes ill for the property market, which is extending its worst slump in history. With an uncertain income outlook, households could continue to delay their home purchases and avoid taking out mortgages.

A consumer confidence index compiled by the National Bureau of Statistics shows sentiment hovered around a historical low as of November, the most recent month for which data is available.

Source: @business 

China Fortune Land’s Bond Investors Get Only Partial Payment Some creditors received 0.55% of principal versus 1.8% due

(…) Creditors who participated in the offshore debt restructuring received about 0.55% of the principal as of Tuesday afternoon in Hong Kong, the people said, asking not to be identified as the information is private. The distressed builder, which was obliged to repay 1.8% of the principal, said the delay was due to a technical problem, the people said.

The development underscores how some Chinese builders may be still struggling with debt payment post-restructuring despite Beijing’s recent efforts to revive home sales and smooth financing. The nation’s home sales plunged 34.6% in December from a year earlier, steeper than an almost 30% decline in the prior month, according to preliminary data from China Real Estate Information Corp. last week. (…)

Xi’s Mixed Messages Leave Whiplashed Investors Wary of China Conflicting goals have left investors confused and put bureaucrats on edge.

(…) His government’s apparent backpedal this week is the latest example. Regulators shocked gaming companies on Dec. 22 with rules to cap in-game spending and prohibit mechanisms to incentivize more play time, in a bid to control a sector with growing sway over the nation’s youth. That wiped $80 billion in market value off firms such as tech giant Tencent Holdings Ltd.

Then came a report that authorities had fired the top official at the country’s gaming regulator and Beijing said it may review the controversial rules, suggesting a heightened sensitivity to offending markets. Tencent — the operator of WeChat — recovered some of its gains, but remains down about 4% since the proposed curbs emerged. China’s government hasn’t commented publicly on the reported personnel changes. (…)

Local officials are putting growth in the backseat, as they try to avoid political missteps, according to six bureaucrats who spoke on the condition of anonymity. In that environment, two official measures of foreign direct investment into China fell to record lows last year, with one marking its first contraction. (…)

“Businesses do not know where they stand due to mixed messaging from the Chinese government.” (…)

For local officials charged with implementing Xi’s vision, it’s clear which goal takes priority. Navigating the political landscape is the primary concern, according to conversations with the six officials, who are directly involved in local economic development policies in provinces including Zhejiang and Sichuan.

Growth isn’t a key measure for performance reviews and Beijing’s warm words about foreign investment are directed to those overseas, said two separate officials. Their comments reflect the challenges business leaders face when dealing with bureaucrats interpreting messages from Beijing. (…)

There’s now no clear figure in the party’s upper echelons advocating a pro-growth message, according to one business person who has been engaged in high-level dialogue with senior officials for over two decades. Instead, those promoting national security have become more active, particularly in the past three years, they told Bloomberg on the condition of anonymity. (…)

Businesspeople mulling trips to China are increasingly inquiring about the risks of detention, according to one US diplomat. That anxiety has clashed with Xi’s call for “heartwarming” measures to attract investors, such as looser visa rules for some nations and extending preferential tax benefits to foreign nationals. (…)

China Injects $50 Billion Into Policy Banks in Stimulus Push Net injection marks largest increase via tool since Nov. 2022

The People’s Bank of China injected nearly $50 billion worth of low-cost funds into policy-oriented banks last month, suggesting the central bank may be ramping up financing for housing and infrastructure projects to support the economy.

The outstanding amount of the PBOC’s Pledged Supplemental Lending program to policy banks climbed to 3.25 trillion yuan ($456 billion) at the end of December from 2.9 trillion yuan in the previous month, the central bank said in a Tuesday statement. The net injection of 350 billion yuan was the largest increase via the tool since November 2022.

The PSL program is seen as an important tool in Beijing’s arsenal, which the government can use to shore up the property sector and stabilize growth this year. Markets have been expecting the central bank to use the money to drive construction of public housing in a bid to alleviate a multi-year property slump that’s hammered consumer confidence. (…)

U.S. Auto Sales Bounced Back in 2023 Automakers could confront more difficulties this year with industrywide sales expected to level off.

(…) Now, consumers are finding more options at dealerships as some of the snarls that impeded factory production in recent years have eased. Increasing inventory levels have led to moderating new-vehicle prices, discounts and sales promotions, providing a welcome relief for car shoppers who have dealt with sharply increasing price tags.

“We’re finally getting back to the traditional buyer’s market,” said Cole Potamkin, chief operating officer at Potamkin Cos., which runs a chain of dealerships across the country.

Rather than relying on pent-up demand, auto dealers will have to start courting buyers again, Potamkin said.

Carmakers, too, have enjoyed several years of robust profits, partly because of consumers willing to pay more for vehicles that were in short supply. Now they are confronting a more hesitant group with some auto executives saying new-car prices will drop further this year. (…)

Throughout the pandemic, auto executives pledged to keep inventories tight as a way to maximize profits, a sign that industrywide sales aren’t likely to return to prepandemic levels where results for several years topped 17 million vehicles.

Cox Automotive projects modest sales growth for 2024 with forecasts of about 15.6 million in annual sales.

While car prices remain far above what they were in 2019, the average price paid for a new vehicle peaked in December 2022 and fell further last year to about $46,055 last month, according to research firm J.D. Power. 

Electric-vehicle sales in the U.S. continued to rise in 2023, outpacing the broader industry. But the growth rate also slowed from the prior year, resulting in several car companies walking back or delaying some of their planned investment in EVs last year. (…)

Electric-car pioneer Tesla on Tuesday reported global vehicle deliveries of about 1.81 million EVs worldwide in 2023, slightly ahead of analysts’ expectations. But its growth rate slowed last year, despite steep price cuts, and Chinese automaker BYD surpassed it in the fourth quarter as the world’s largest EV seller.

Another obstacle for carmakers and potential buyers is the Biden administration’s recently defined rules on which electric models qualify for a $7,500 tax credit. Vehicles that are assembled using battery parts from “a foreign entity of concern,” including China, aren’t eligible for the credit starting this year.

A number of popular electric vehicles, including Ford’s Mustang Mach-E and some Tesla models, lost their eligibility for the tax credit at the turn of the year as a result.

fredgraph - 2024-01-03T054925.830

Construction Spending Advances in November Sturdy Residential Construction Counteracts a Slip in Nonresidential Outlays

Construction spending posted another solid gain in November, rising 0.4% over the month. Amid high financing costs and shaky demand for real estate, overall momentum in the construction sector continues to be fueled by a few key segments.

First, private single-family outlays have now picked up for seven consecutive months, reflecting the relative attractiveness of new construction amid scarce supply and tough affordability conditions in the existing home market.

Builders increased outlays for the seventh straight month, spurring a robust 2.9% uptick in private single-family spending. Strong underlying demand for homes and low resale inventory are fueling the single-family construction renaissance. Home builders’ ability to offer mortgage rate buy-downs and discounts have also made new homes attractive to buyers.

Second, the manufacturing construction rally appears to be counteracting the broader interest rate headwinds facing nonresidential construction. Private manufacturing outlays climbed 0.5% in November amounting to a 59.4% year-over-year gain.

On the downside, multifamily outlays continue to moderate off of the post-pandemic construction boom alongside normalizing apartment demand and declining multifamily starts. Commercial construction also remains acutely challenged by elevated financing costs and restrictive lending conditions. (…)


BOND FACTS

(…) the rally in the bond market at the end of last year was sparked by the November 1 Treasury announcement that less would be raised in the note and bond markets and more in the bill market to finance the government’s deficits.

Also helping to push yields down during the last two months of 2023 was a drop in the Citigroup Economic Surprise Index from 63.4 at the end of October to 1.1 today. We don’t expect much more downside in the CESI in coming weeks.

The steep drop in the price of oil since September 27 has also been bullish for bonds since the former has an important influence on overall actual and expected inflation (chart). We don’t see much downside or upside in the price of oil in coming weeks unless the conflicts in the Middle East seriously reduce the supply of oil. (Ed Yardeni)

Image

@M_McDonough

  • The trend in HY, as measured by the Daily MACD technical indicator, turned bullish around November 1 (green arrow lower section), and the trend turned bearish after last Friday’s close (circled red arrow lower section). Following is a daily price chart of the Pimco High-Yield bond mutual fund. Think of it as a proxy for the high-yield bond market in general. After the recent rally off the October 2023 low, a correction makes sense—the red horizontal lines in the top right of the chart plot technical retracement targets. (Steve Blumenthal)

unnamed - 2024-01-03T071611.885

MEMORIES

This chart from RBA reminds me of how miserable I was in 1999 after having outperformed equity markets for 12 consecutive years by 500bps on average. From hero to zero! Crying face

Then came 2000 and 2001… Nyah-Nyah

4 for ’24: Year Ahead Outlook

Richard Bernstein thinks we’re about to have a replay of the 2000’s Lost Decade:

We envision an extended period during which the Magnificent 7 significantly underperform, but other sectors, industries, countries, and investment themes that are currently being ignored could present excellent opportunities.

With this backdrop, our portfolios enter 2024 with four embedded themes:

  1. US Small Caps

  2. US Cyclicals

  3. Non-US and Emerging Markets

  4. Industrials: Deglobalization spurs infrastructure

THE DAILY EDGE: 2 January 2024: Economic Scenarios

**** Birthday cake  Edge and Odds is 15 years old!  Birthday cake ****

I asked perplexity.ai, a smart, conversational search engine, if it knows Edge and Odds.

Yes, I’m aware of the Edge and Odds blog. It is a platform that provides pertinent facts and independent, unbiased, and often contrarian thinking for investors. The blog seeks to offer thoroughness and is focused on smart investing. The concept of “edge over odds” is discussed, emphasizing the importance of having a greater edge when making bets. (…)

The author, Denis, who has been involved in the investment business since 1975, strives for thoroughness and objectivity, emphasizing the importance of having a greater edge when making investment decisions. The blog is focused on smart investing and is open and free for all readers.

You can converse with perplexity.ai, with current info/data and references to boot:

Q. What are the odds of an economic soft landing in the USA?

The odds of an economic soft landing in the USA are a topic of current debate among economists and policymakers. Some experts believe that the Federal Reserve has low odds of achieving a soft landing due to the strong economy and ongoing inflation concerns. However, other economists are increasingly predicting that the US is heading for a soft landing, as inflation is cooling and hiring remains strong.

The concept of a soft landing refers to an economic scenario where the economy grows enough to avoid a recession and a negative impact on the labor market, without fueling excessive inflation. (…) the likelihood of an economic soft landing in the USA is a complex and evolving issue, with different experts holding varying perspectives.

Q. What are some examples of past rate hiking cycles that did result in a soft landing?

One example of a past rate hiking cycle that resulted in a soft landing is the monetary tightening conducted under Alan Greenspan in the mid-1990s. During this period, the economy experienced a gradual, relatively painless slowdown in economic growth that avoided a recession, which is considered a classic example of a soft landing.

Another example is the rate hike cycle in 2015, where the Federal Reserve implemented interest rate increases, resulting in a decrease in inflation combined with economic growth in the third quarter of that year.

At this time last year, after a 400bps hike by the FOMC, the mainstream scenario was recession. Understandable given that between 1955 and 2015, 9 of 12 rate hike cycles ended in a recession. Solid odds (75%) … that proved wrong.

Not only was there no recession, the economy accelerated to a 4.9% growth rate in Q3’23 while interest rates were still rising!

Bankim Chadha of Deutsche Bank AG shows how way off the mark the Bloomberg economist surveys were throughout 2023:

Blended together, these three calls — sell US stocks, buy Treasuries, buy Chinese stocks — formed the consensus view on Wall Street. And, once again, the consensus was dead wrong. What was supposed to go up went down, or listed sideways, and what was supposed to go down went up — and up and up. (Bloomberg)

Bob Farrell’s Rule #9 prevails: “When all the experts and forecasts agree – something else is going to happen.”

In April, I posted Economic Perspectives: Re-Acceleration!

And here we are, 4 months later, with indications that manufacturing, far from crashing, is now about to contribute to growth, perhaps significantly given that supply chains have normalized, inventories are very low, labor supply is improving and consumer demand remains reasonably solid. Reshoring and nationalistic policies would only add fuel to this nascent fire.

Keep in mind that manufacturing carries more economic pull than its weight suggests: high salaries and important collateral effects on many services such as transportation, restaurants and banking act as economic multipliers.

In September: The Wealth Defect :

At their core, American consumers are rational animals. They enjoy consuming but, over time, they spend what they earn. When they did not, it was either because of difficulties/uncertainty (e.g. recessions) or because their rapidly rising net worth allowed for splurging thanks to realized capital gains or increased borrowings against rising asset values.

The chart below illustrate these trends. When  inflation-adjusted household net worth rose rapidly above trend like in the late 1990s, the mid-2000s and recently, expenditures grew faster than income.

image

(…) the conventional playbook is ineffective post this period of non-conventional monetary policy!

The Fed’s policies boosted household wealth 15.5% above their 2019 level and 35% above trend. Thanks to rising stock prices but, principally, to rising home values due to unusually low supply of existing homes due to Fed-supplied mortgage handcuffs.

From a monetary policy perspective, the wealth effect is now a wealth defect: rising interest rates have little impact on a very wealthy, under leveraged, consumer looking to enjoy life AMAP (as much as possible) post pandemic.

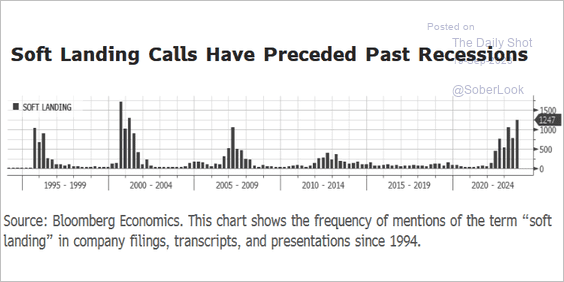
The mainstream scenario is now a soft landing, in spite of low historical odds:

  • The Bloomberg consensus for 2024 Q4/Q4 GDP growth is +0.9% (Q1 and Q2 at +0.4%).
  • Respondents in a survey of market participants carried out regularly by the research firm MacroPolicy Perspectives are more optimistic about the odds of a soft landing than ever before: 74 percent said that no recession was needed to lower inflation back to the Fed’s target in a Dec. 1-7 survey, up from a low of 41 percent in September 2022.
  • And according to the latest global fund managers survey from Bank of America, investors agree. The survey, which takes responses from investors collectively managing nearly $700 billion, found that 66% of folks see a “soft landing” as their base case. Some 23% of investors see a “hard landing” incoming whereby the economy crashes into recession after the Fed’s aggressive rate hikes executed since 2022. And just 6% of investors are expecting the seemingly impossible “no landing” to come through.

So, 74% of economic forecasters now expect the Fed to harmlessly win its inflation battle, up from 41% three months ago.

And two-thirds of investors are positioning accordingly.

Less than one in four fears a recession.

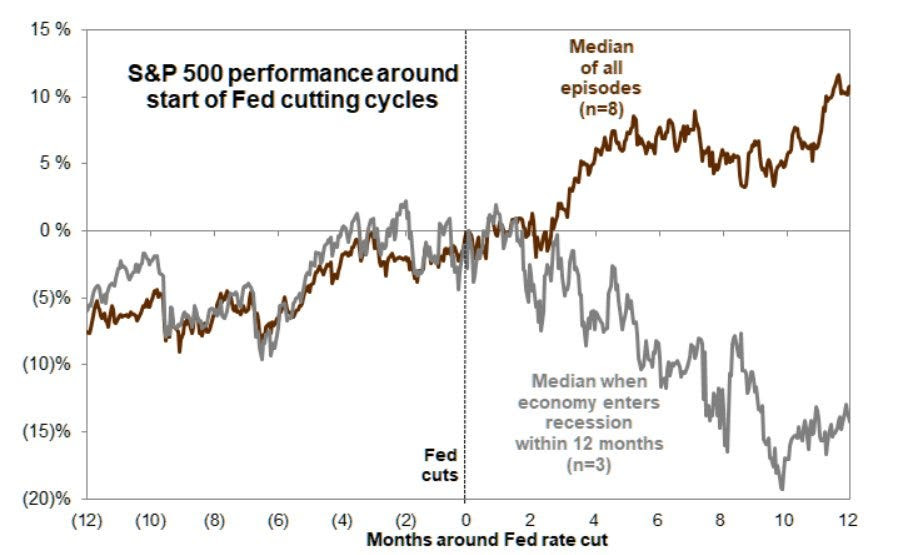
A pretty important bet based on history:

Source:  @Mayhem4Markets

The S&P 500 rose 24.2% last year after falling 19.4% during 2022. Since the start of the data in 1928, years with gains of over 20% were followed by years of 5.9% gains on average. Excluding recession years, the second-year gains averaged 9.7%. Losses during recession years averaged 10.1%. (Ed Yardeni)

Only 6% of investors are in the no-landing camp. That in spite of a rather strong economy, inflation still above the Fed’s target and a surprising Fed pivot that dropped yields of 2-Y and 10-Y Ts about 20%.

I came across 2 well laid out opposite viewpoints for your consideration.

The excellent National Bank Financial economists are in the not-so-soft/recession camp.

(…) our analysis suggests that economic growth in the
U.S. is less vigorous than it might seem. As for the future, the few leading economic indicators that have proven their predictive value in previous cycles almost all point in the same direction: that of an economic slowdown in 2024. (…)

After a strong end to 2023, we expect growth in the U.S. to decelerate significantly in the first half of 2024. We then see the economy tipping into recession around mid-year.

1- The Fed’s Beige Book: “On balance, economic activity slowed since the previous report, with four districts reporting modest growth, two indicating conditions were flat to slightly down, and six noting slight declines in activity.”

(…) growth as poorly diffused geographically as that reported in November by the Beige Book is in fact extremely rare outside periods of recession. To find a characterization of the economy similar to the one quoted above, we have to go back to the editions published during the darkest months of the pandemic or, before that, during the great recession of 2007-2009. In the latter case, it wasn’t until March 2008
– four months after the start of what would turn out to be one of the worst recessions of the century – that the Beige Book painted as bleak a picture as it did in November 2023. (…) Could it be that growth isn’t as robust as the GDP data suggest?

2- GDP vs GDI:

(…) these two measures of economic activity seem to have drifted further and further apart over the past year, to such an extent that GDP is now showing 3.0% year-on-year growth, while GDI is showing a slight contraction. Never in their 75-year history have these series sent out such contradictory messages.

image

(…) the Fed has developed a measure whose precise purpose is to combine the results of GDP and GDI. This measure, known as GDPplus, (…) confirms that the U.S. economy is not in recession, which is no surprise. But it also indicates that growth has been much less vigorous recently than GDP would suggest. Indeed, GDPplus grew at an annualized rate of just 1.2% on average over the first three quarters of the year.

3- The LEI-CEI combo:

(…) other indicators suggest that the US economy is heading for a period of contraction. These include the Conference Board’s Index of Leading Economic Indicators (LEI). Historical analysis reveals that an annualized decline of 3.5% in this index over six months, combined with a diffusion index of less than 50%, generally heralds an impending recession. Unfortunately, both these conditions were present in October. And given that, using these two thresholds together, the LEI has not produced a single false recession signal in the last 65 years, we find it hard to believe that this time it will be any different, and that the economy will experience a soft landing.

image

It’s also interesting to note how quickly the LEI has recently weakened in relation to the Index of Coincident Economic Indicators (CEI) also published by the Conference Board. Conceptually, this suggests that future growth will be much less vigorous than current growth, and historically this has been the case, with recessions almost invariably following periods in which the LEI level deteriorated relative to the CEI.

image

4- Business investments

Business investment is also feeling the effects of rising interest rates, as evidenced by a third decline in machinery and equipment spending in four quarters in Q3. (…)

In the latest edition of the [NFIB] poll, a net 11% of respondents said they expected credit conditions to tighten further in the future. As this series is historically closely correlated with that following investment intentions, this development does not point to a major rebound in capital spending.

5- Pinched consumers

 image image

5- Real rates

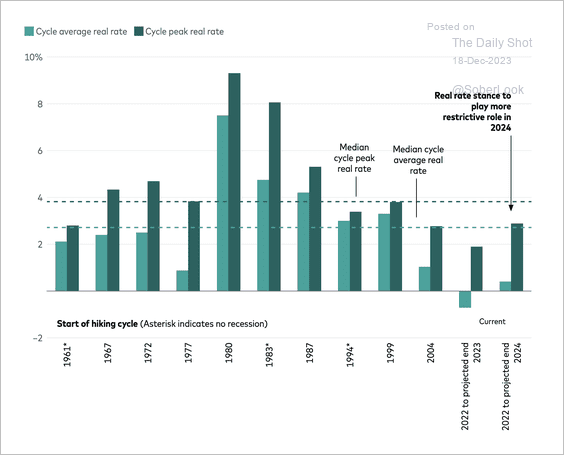
imageAnd while some may take solace from the fact that the Fed now seems much more open to the possibility of rate cuts in 2024 – a scenario that would obviously ease the pressure on economic agents – we’re much more concerned about the evolution of real policy rates between now and when these cuts materialize. The sharp fall in inflation seen recently means that they are already at their highest level since 2007. And they are likely to rise further in the coming months if economists’ forecasts of a further easing in price pressures prove correct. (…)

After a fairly solid end to 2023, we therefore expect growth in the US to slow markedly in the first half of 2024. This deceleration should enable the Fed to make rate cuts, but we believe they will come too late to prevent a few quarters of negative growth next year. (…)

As for those who believe that a low unemployment rate could somehow prevent the economy from falling into recession, we would like to remind them that this theory runs counter to historical data. These show that, as the unemployment rate falls below its long-term equilibrium level (NAIRU), the probability of recession increases. (…)
By way of illustration, the U.S. unemployment rate is currently below the NAIRU by more than 0.5%, a situation that historically implies a 70% risk of recession over three years. Three years sure is a long time, but remember that the unemployment rate has been in this range for almost two years already. (…)

Historically, employers have tended to stop using consultants before proceeding with more costly lay-offs, which explains why employment in temporary help services generally begins to decline a few months before a recession. Such a decline is currently underway.

image

(…) never has this sentiment declined as much as it has in
recent months, without the economy subsequently slipping into recession.

image

The final indicator we’ll mention is the diffusion of hiring. Since the early 1990s, expansionary phases have been characterized by widespread employment gains, while economic slowdowns have often been heralded by less diffuse job creation. This is because some sectors of the economy are affected earlier than others by the deterioration in activity, and therefore stop hiring sooner. As a general rule, however, recessions have tended to occur shortly after the six-month diffusion index published by the Bureau of Labor Statistics falls below 60%. This indicator was barely above this level in November, with only 60.4% of the sectors covered reporting an increase in headcount over the past six months. (…)

 image image

The also excellent Ed Yardeni is a staunch soft lander:

1- Interest rates are back to normal

Perhaps the Fed hasn’t been tightening monetary policy so much as normalizing it. Interest rates are back to the Old Normal. They are back to where they were before the New Abnormal period between the Great Financial Crisis and the Great Virus Crisis, during which the Fed pegged interest rates near zero.

The normalization theory implies that the Fed might not lower interest rates next year as much as widely expected. That’s because the economy wouldn’t require as much easing to reverse the tightening. If the economy remains resilient but inflation continues to fall closer to the Fed’s 2.0% target next year—both of which we’re expecting—then the Fed might lower the federal funds rate twice next year, by 25bps each time, instead of four times or more as widely anticipated.

image image

2- Consumers have purchasing power

Many consumers may soon run out of their excess saving, as the economy’s naysayers are saying. Some consumers could be weighed down by too much consumer debt, especially student loans. Nevertheless, most of them are likely to continue to consume as long as their job security remains high, which it will be as long as there are plenty of job openings and as long as the unemployed and new entrants to the labor force fill those openings. That describes the current state of the labor market.

Indeed, during November, 40% of small business owners reported that they have job openings. During October, there were 8.7 million job openings overall in the labor market versus 6.5 million unemployed that month. The labor force has increased 3.3 million during the first 11 months of this year. The household measure of employment is up 2.7 million over the same period.

Pandemic-related excess saving certainly helped to boost consumer spending over the previous three years when unemployment was very high and real wages stagnated. But unemployment is low now (i.e., below 4.0% since February 2022), and real average hourly earnings is rising once again along its 1.4% annualized trendline that started in 1993.

Both nominal and real wages & salaries in personal income and unearned personal income (including interest income, dividends, rents, and proprietors’ income) rose to record highs during October. They probably did so again in November.

3- Households are wealthy and liquid

The net worth of American households totaled a staggering record-high $151.0 trillion at the end of Q3-2023. Their portfolios are diversified in various asset holdings that all are at or near record highs. (…)

There are 86 million households who own their own homes, and 40% of them have no mortgages. Many of these homeowners likely are Baby Boomers. (…) Collectively, the generation held $73.1 trillion of net worth at the end of Q3. Boomers are likely to be among the main beneficiaries of record unearned income streams.

4- Demand for labor is strong

From personal experience, we know that some of the Baby Boomers are providing some financial support to their young adult children. The Boomers are also eating at restaurants and traveling more often. They are visiting their health care providers more frequently to make sure that they live long enough to spend some of their retirement nest eggs.

Not surprisingly, November’s better-than-expected retail sales was led by food services, which rose to yet another record high. Employment continues to soar in the leisure & hospitality industry as well as in the health care sector.

5- Onshoring boom is boosting capital spending

American and foreign manufacturing companies clearly are onshoring to the US. Supply-chain disruptions during the pandemic and growing geopolitical tensions between the US and China have stimulated the onshoring rush. So has a shortage of workers in China.

The onshoring boom and the federal government’s increased spending on public infrastructure are boosting new orders for construction machinery, which is up 30.5% over the past 24 months through October. Onshoring and infrastructure investment also explain why construction employment rose to yet another record high of 8.0 million during November despite the recession in single-family housing starts.

Construction spending on manufacturing facilities is soaring because of the increase in onshoring partly owing to federal incentives. In current dollars, it is up a whopping 71.6% and 136.8% on one-year and two-year bases.

6- Housing is all set for a recovery

The plunge in mortgage interest rates since early November undoubtedly will boost new and existing home sales. That should give a boost to housing-related retail sales on appliances, furniture, and furnishings. The rolling recessions in housing and housing-related retailing should turn into rolling recoveries for both.

7- Corporate cash flow is at a record high

The economy’s resilience can also be attributed to the awesome ability of US corporations to generate cash flow. It totaled a record $3.4 trillion (saar) during Q3-2023. That’s despite the pressure on companies’ profit margins coming from high labor costs and higher interest rates over the past couple of years. Corporate cash flow is up 4.1% y/y, with tax-reported depreciation up 6.9% and undistributed profits down 3.3%. The latter has been relatively flat since Q3-2009.

8- Inflation is turning out to be transitory

There can be no debate about the transitory nature of goods inflation since H2-2020. It was back down to 0.0 y/y during November. It turned out to be mostly attributable to the shocks and aftershocks of the pandemic, which have been dissipating since the end of the pandemic. (…)

Now that the goods inflation shock is behind us, the services inflation shock is showing signs of dissipating. We expect it will do just that in 2024.

9- The High-Tech Revolution is boosting productivity

Companies are allocating more of their capital spending budgets to technology hardware and software to boost their productivity in response to chronic labor shortages. As a result, production of high-tech equipment and spending on software are at all-time highs.

We believe that a major cycle in productivity growth started at the end of 2015, when it bottomed at 0.5% (based on the 20-quarter average) and rose to 1.8% during Q3-2023. We expect productivity growth will peak around 4.0% by the end of the decade.

10- Leading indicators are mostly misleading

(…) For example, inverted yield curves in the past have anticipated that the Fed’s tightening would break something in the financial system, causing a credit crunch and a recession, that’s not always the case. There was a mini-banking crisis in March of this year. But it was contained by the Fed so had few systemic ripple effects.

The LEI has misfired its recession signals because its composition is biased toward predicting the goods sector more than the services sector of the economy. There has been a rolling recession in the goods sector, but it has been more than offset by strength in services, nonresidential private and public construction, and high-tech capital spending.

11- The rest of the world’s challenges should remain contained

Also booming is industrial production of defense, which is likely to continue rising to new record highs given the geopolitical turmoil around the world. The wars between Russia and Ukraine and between Israel and Gaza should remain contained regionally. China’s economic woes reduce the chances that China will invade Taiwan. Nevertheless, these geopolitical hot spots will boost defense spending among the NATO members.

The bursting of China’s property bubble should continue to weigh on global economic growth and commodity prices. China will remain a major source of global deflationary pressures. Europe is in a shallow recession and should recover next year as the European Central Bank lowers interest rates.

12- The Roaring 2020s will broaden the bull market

At last week’s FOMC meeting, Fed Chair Jerome Powell and his colleagues pivoted toward the soft-landing scenario, which is also known as “immaculate disinflation.” In their Summary of Economic Projections (SEP), they projected three 25bps cuts in the federal funds rate next year, up from September’s two rate cuts. They are starting to recognize that inflation can subside without a recession. We think this is happening because China is having a recession and effectively exporting goods deflation to the US. In addition, technology-driven productivity growth is making a comeback, in our opinion.

The current bull market started on October 12, 2023. It received a big boost when AI-related stocks took off late last year. OpenAI launched ChatGPT on November 30, 2022. We believe that date is when the stock market first started to discount our Roaring 2020s scenario. At first, the bull market was narrowly based, but it since has been broadening to include more sectors and industries. We believe that reflects investors’ realization that the beneficiaries of the Roaring 2020s theme aren’t just the companies that make technology but also those that use it to boost their productivity—i.e., companies generally whatever their industry may be.

U.S. Secretary of Defense James R. Schlesinger once said: “You are entitled to your own views, but you are not entitled to your own facts.”

But nowadays, there is quite enough data out there to support just about any narrative, the good, the bad and the ugly. We actually can be confused with facts!

Let’s review some of the NBF/Yardeni arguments:

  • Nominal interest rates may be “back to normal”, but real rates are only near or at previous pinch points.

  • Based on machinery and equipment spending data, NBF argues that business investments are declining. Yardeni claims that an “onshoring boom is boosting capital spending”. They are both right, but Yardeni is more right. New orders for non-defense capital goods ex-aircraft, a widely used proxy for capex, are flat nominally in 2023. However, total construction spending is up 10.7% and manufacturing construction expenditures are up a whopping 71% YoY, +265% since February 2020. Total construction expenditures are 27 times larger than the “capex proxy”. The highly cyclical construction employment is still up 2.6% YoY, unchanged since March while total employment growth has slowed from 2.7% to 1.8%.
  • Consumers are obviously pinched by high interest rates and the resumption of student loans servicing is hurting more than 40 million Americans right into the holidays season. But Americans have a strong habit of generally spending what they earn. After having spent most of their Covid-subsidies between June 2020 and December 2022, their spending has actually mirrored their labor income in 2023, both series up 5.3% YoY in November. The second chart below shows how stable labor income growth has been in 2023 at +0.4% MoM on average (ex-January, dashed red), +5.0% annualized, while PCE inflation only averaged +0.18%/month (dashed black), +2.2% annualized.

fredgraph - 2023-12-24T140846.786

image

  • Since the GFC, continuing post-pandemic, American household wealth was unusually boosted by rising asset prices (equities + housing) largely thanks to the Fed’s own QE policies. Importantly, the bottom 50% have seen their wealth explode 87% post-pandemic, double the 50-90th percentile. So even the less wealthy folks do feel wealthier.

fredgraph - 2023-12-24T143922.643

  • Labor demand is slowly normalizing but it is not collapsing. Job postings on Indeed through December 15 suggest that the BLS Job Openings will next come in around 9M (November), flattening but still 25% above their pre-pandemic level, while the number of unemployeds, at 6.3M, is only up 8.6%.

fredgraph - 2023-12-24T162627.097

  • My two-cents on the GDP-GDI debate: the pandemic and its remedies continue to distort certain data series. GDI includes corporate profits and taxes, both series being down in 2023 in part because of their respective unusually high base. These series will eventually converge but the consumption based equation currently carries more weight than the income based equation.
    • GDI = Wages + Profits + Interest Income + Rental Income + Taxes − Production/Import Subsidies
    • GDP = Consumption + Investment + Government Purchases + Exports−Imports

In all, Yardeni’s arguments are more persuasive in my humble opinion. (See also Slowing, Really?)

But the soft landing scenario nonetheless carries low historical odds. Beware the soft-landing trap, it always starts softly…

Source: @AnnaEconomist, @economics

And as the economy’s average growth rate declines, the difference between soft, hard and no-landing becomes tenuous except when defining no-landing by a failure to contain inflation like in 1966-68 (Vietnam war, Johnson’s Great Society) and 1987-89 (wages reacceleration?).

image

The little contrarian in me is intrigued by the very low 6% of investors “expecting the seemingly impossible “no landing” to come through”, that the inflation dragon has been definitely annihilated.

The hope on inflation is that

  • overall demand will slow, something that has yet to happen even after the Fed’s aggressive tightening. GDP growth is now seen up 2.4% in Q4’23 and 2.2% in Q1’24, down from Q3 but in line with the Q2’22 to Q2’23 average of 2.4%. Personal consumption is not slowing and the “wealth defect”, combined with the recent 15% deflation in energy costs, should keep consumers buoyant; KKR notes that “the actual level of real government outlays (i.e., spending including transfer payments, which are not counted in GDP calculations) is still running more than 25% above trend, which is quite
    remarkable considering total employment is now about 3.5 million higher than it was pre-pandemic.” Lagging lags!

image

(Goldman Sachs)

  • the upward trend in wages since 2012 will be breaking down shortly…

image

  • … or stabilize in the 4.0% range with strong productivity growth limiting its cost impact (dashed red line = 2012-2019 average of 1.2% a.r.). Technology + AI feed the hopes.

image

Perplexity.ai:

Measuring productivity in the services sector presents unique challenges. Unlike the manufacturing sector, the output in services is often intangible, making it difficult to measure. Additionally, the diverse nature of services and the changing quality of output further complicate productivity measurement. The Brookings Institution highlights that there is no central theme to the problem of services measurement, with each industry containing unique measurement challenges.

If productivity is rising rapidly, why are total job openings broadly up 24.8% since 2019 when real GDP is only up 8.8%?

Job openings since 2019:

  • Government: +23.2%
  • Information: +28.4%
  • Construction: +36.9%
  • Leisure and hospitality: +29.4%
  • Education and health care: +32.2%
  • Health Care and social assistance: +29.4%
  • Accommodation and food services: +28.9%
  • Professional and business services: +36.4%
  • Transportation, warehousing, utilities: +74.3%

Had all these job openings been filled “as needed”, what would have productivity looked like?

Was the recent productivity jump accidental, due to labor scarcity, temporary or not?

This chart plots productivity, real wages, real total employment cost (all indexed to Q1’20 = 100, left scale), and pretax corporate profits (black, rs).

image

  • Real wages, while up since the late 1990s, are only back to their 1972 level. Most of the productivity gains this century went to profits.
  • Profits stagnated between 2014 and 2019 as real wages and total compensation finally grew along with productivity.
  • Productivity jumped 6.3% during and after the pandemic but real wages rose only 2.0% and total compensation declined 2.9% in real terms, helping boost profits 48%, which is exactly what the S&P 500 did since the end of 2019. Equities feed on profits, and profits don’t grow from thin air.
  • Productivity always jumps during or right after recessions. It rose 7.8% in 2009-2010 but crawled only 0.8% per year during the following 8 years.
  • The 2023 productivity gains only brought the productivity measure nearly back to its Q3’20 peak. Since that peak three years ago, productivity is actually down 0.3%.

Measures of labor tightness suggest continued pressures on labor costs.

  • The unemployment rate (inversed) is at its low pre-pandemic level while real labor costs have declined 2.6%. Note how real compensation cost accelerated after the unemployment rate declined below 5%.

image

  • Job openings remain 34% above the number of unemployed people and well above previous levels that fostered rising real compensation costs.

image

KKR’s case for productivity is nuanced:

(…) we still think labors costs could dent profitability more than some investors are willing to acknowledge. Simply stated, we need a productivity boost to offset the wage increases we envision. If not, central banks may not be able to ease as abruptly as many investors hope. (…)

Corporations will need to focus on automation and productivity gains. Periods of labor scarcity have historically been opportunities for greater automation. (…) Specifically, many of the important technological trends, including automation and digitalization, that were already in place before the pandemic have now only accelerated. We are also very bullish on trends in worker retraining. Using data and educational techniques to improve student/employee skills to better match the demand by corporations for labor will be a mega-theme, we believe.

Using history as our guide, we believe that the recent uplifts in productivity are closely linked to a resurgence in capital investment that began around 2014. To date, the most advanced efforts have been heavily concentrated in the manufacturing industry, which in the United States accounts for less than 10% of total employment but nearly 90% of all robot installations. However, the playbook is starting to shift, as the aging population makes it harder to fill junior roles in service industries. We have already seen robots cleaning floors at Heathrow and clearing dishes in Japan and think this trend will accelerate as automation increases in fields like retail, leisure and hospitality, and healthcare. (…)

imageHowever, from a macro perspective, we are less convinced that the productivity-enhancing capabilities of GAI [Generative Artificial Intelligence] will be enough to offset the impact of demographic headwinds and structural labor shortages on wages. In our view, there are several ‘gating factors’ that may impede the widespread adoption and implementation of GAI in displacing high-skill service positions including an increasingly complex cybersecurity threat landscape, concerns over data privacy, an uncertain regulatory environment, labor disputes, and shortages of high-end computing capacity. (…)

We think ‘Supercore’ inflation will remain ‘sticky’ this cycle amidst higher wage growth. As we have written for some time, we believe wages are on track to rise faster than overall inflation over a multi-year period as workers recoup lost real income.

That said, at 2.6% KKR is near consensus on CPI inflation in 2024, “thinking that shelter inflation, which accounts for about one-third of overall CPI, will continue to slow next year as the official BLS inflation measures start to ‘catch down’ to the disinflation seen in actual rents.”

One year ago, KKR, like most everybody, clearly saw “government data catching up to the rent growth that is already incorporated into our proprietary leading indicators.”

Its current forecast for 2024 shelter inflation is 5.1%, up from 4.5% one year and six months ago. Lagging lags!

Inflation forecasts are treacherous as everybody should know. KKR’s core 2023 CPI inflation number rose from +3.9% in December 2022 to +4.8%. Its 2024 forecast is now +3.0%, up from +2.4% one year ago. I offer their inflation forecasts last year and this year, not to denigrate them, but rather to show the difficulty with the large number of very different balls up in the air.

 image image

Just to confuse you more, Goldman Sachs is more optimistic on core CPI (+2.7%) even with a well above consensus +2.1% GDP growth rate (KKR: +1.5%). Note that the 2015-19 GDP average growth rate was +2.5%. From GS:

  • Consumer spending is expected to be strong. Real disposable income is forecast to grow nearly 3% next year amid slowing but solid job gains, roughly 1% real wage growth, and a large increase in household interest income. Income growth will be partly offset by a higher savings rate, which is a little too low compared with its pre-pandemic level.
  • Business investment will slow. Subsidies driven by the CHIPS Act and Inflation Reduction Act accounted for all of the net growth in business investment this year, and financing conditions are expected to be more difficult, especially for commercial real estate. At the same time, investment in artificial intelligence is rising and recessionary fears are fading, which could make business leaders more confident. All told, business investment is expected to grow 1.75% in 2024.
  • Existing home sales are expected to be very weak next year as mortgage rates remain high. Residential investment is predicted to end the year roughly flat. Low affordability but very tight supply should generate modest home price growth of about 1% in 2024.
  • Federal government spending is forecast to be roughly flat, while state and local spending increases 0.5%. A government shutdown would shift growth between quarters.
  • US imports have eased from an elevated level (fueled by pandemic stimulus), but US exports remain depressed. Goldman Sachs Research predicts a recovery in foreign economic growth next year will boost demand for US exports. That’s expected to narrow the trade deficit enough in 2024 to contribute 0.2 percentage points to GDP expansion.

In summary, GS has GDP growth at +2.1% and core CPI at +2.7%.

KKR has GDP growth at +1.5% and core CPI at +3.0%.

Ed Yardeni has GDP growth above 2.0% and inflation falling “to the Fed’s target of 2.0% y/y at some point during the year” with booming productivity.

Gloomy NBF has GDP growth at +0.9% (negative growth Q2 to Q4) with core CPI still at +2.6% in Q4.

I don’t have a crystal ball (!) but my sense is that solid consumer and construction spending will keep the economy humming, with the risk tilted on the high side. I would be surprised if core inflation rests outside of a 3-4% range. Will this be the year when the Fed moves the goal posts? Rafael Bostic (Atlanta Fed) said on Dec.19 that “nothing should be etched in stone”.

I am happy not being a FOMC voter this year…

  • NBF expects the Fed to cut 150bps starting in Q2 and 10Y Ts at 3.55% in Q4.
  • Ed Yardeni sees 2 to 3 cuts and 10Y Ts between 3.75% and 4.25%.
  • KKR forecasts cuts of 75bps late in 2024 and 10Y Ts a 4.0%.
  • GS has only one 25bps rate cut, in Q4 and Ts at 4.3%.

All very smart, resourceful people working with the same basic data.

Sadly, there is no firm consensus to bet against.

Wait, wait! “66% of investors see a soft landing as their base case.”

Here’s something to bet against … but which way?

Red rose Healthy, Peaceful and Happy New Year Red rose