FLASH PMIs
The S&P Global Flash US Services Business Activity Index posted 53.8 in March, up from 50.6 in February to signal a solid expansion in service sector business activity. The rise in output was the fastest since April 2022, with firms linking the upturn to stronger demand conditions and a renewed increase in new business.
New orders at service providers increased for the first time since last September, as greater client activity sparked a modest upturn in new sales. The expansion in new business was the fastest since May 2022 with domestic and foreign client demand both improving.
Input prices rose markedly again in March, despite the rate of cost inflation softening to the second-slowest since October 2020. Firms’ pricing power was buoyed by stronger demand conditions, as they raised their selling prices at the sharpest rate for five months.
A renewed upturn in new business led to the fastest increase in backlogs of work since May 2022. Pressure on capacity subsequently drove job creation, as service sector employment rose at the steepest rate since last September.
Service sector business expectations regarding the outlook for the coming year remained upbeat during March. Concerns relating to inflation and higher interest rates nonetheless weighed on confidence, as the degree of optimism dipped from that seen in February to below the series average.
At 49.3, the S&P Global Flash US Manufacturing PMI was up from 47.3 in February, and signalled a slight deterioration in operating conditions across the manufacturing sector during March. The rate of decline in the health of the sector was the slowest in the current five-month sequence of deterioration amid a renewed rise in production and a softer fall in new orders.
Output across the goods-producing sector increased for the first time since last October, and at the steepest rate for ten months. Companies noted that greater production stemmed from a less marked contraction in new sales. The decline in new orders was the slowest in the current six-month sequence of decrease amid signs of improvements in demand conditions. New export orders fell at a sharper pace, however.
Inflationary pressures across the manufacturing sector softened in March. Rates of increase in input costs and output charges slowed as firms noted less marked supplier price hikes and moderations in some raw material costs. The rise in cost burdens was the second-slowest since July 2020, as companies increased their selling prices at the softest rate since October 2020 in a bid to remain competitive.
Increased output and an unprecedented improvement in supplier delivery times led to a slower fall in input buying and a softer depletion of pre-production inventories. Lead times were reduced to the greatest extent on record (since May 2007), allowing firms to start replenishing stocks and process backlogs of work, which fell solidly. At the same time, post-production inventories expanded for the first time in four months.
Employment continued to rise at a modest pace in March, with the rate of job creation broadly in line with the series average. Firms noted further difficulties finding skilled candidates.
Finally, output expectations regarding the next 12 months were buoyed by hopes of greater investment, increased marketing spending and boosts to client demand. The degree of confidence was below the series trend, however, and the lowest for three months, amid inflationary concerns and uncertainty about the outlook for demand.
The [Composite] PMI is broadly consistent with annualized GDP growth approaching 2%, painting a far more positive picture of economic resilience than the declines seen throughout the second half of last year and at the start of 2023. (…)
There is also some concern regarding inflation, with the survey’s gauge of selling prices increasing at a faster rate in March despite lower costs feeding through the manufacturing sector. The inflationary upturn is now being led by stronger service sector price increases, linked largely to faster wage growth.

My take is that the U.S. economy is hanging in thanks to services but the “modest upturn in new sales” makes this fragile. Services employment, wages and pricing power remain solid while the goods sector is in recession. Not stagflation, slowflation rather.
EUROZONE: Service sector revival powers eurozone growth higher in March
- Flash Eurozone PMI Composite Output Index at 54.1 (Feb: 52.0). 10-month high.
- Flash Eurozone Services PMI Activity Index at 55.6 (Feb: 52.7). 10-month high.
- Flash Eurozone Manufacturing Output Index at 49.9 (Feb: 50.1). 2-month low.
- Flash Eurozone Manufacturing PMI at 47.1 (Feb: 48.5). 4-month low.
(…) A key development was the further revival of growth in financial services, with a notable turnaround in real estate activity compared to late last year, despite recent concerns regarding banking sector stability and higher interest rates. Consumer services activity also continued to revive from the downturn seen late last year, notably in respect to travel and tourism. Growth was also recorded in industrial services, IT and healthcare.
Measured across both sectors, new orders rose for a second month in a row and at the steepest rate since last May. However, an increased rate of growth of new business in the service sector contrasted with a steeper rate of loss of new orders in manufacturing, which has now seen order inflows fall for 11 successive months.
The backlogs data therefore suggest that rising levels of outstanding work will help support further service sector growth in coming months, but in manufacturing existing output is only being sustained by eating into previously-placed orders, posing downside risks to future output.
Average prices charged for goods and services meanwhile continued to rise sharply, the rate of increase falling further from the peak seen last year to the lowest since May 2021, though remaining higher than any time in the survey’s history prior to the pandemic.
Especially elevated output price inflation was seen in services, albeit down to a 13-month low, while prices charged for goods leaving the factory gate rose at the slowest rate since January 2021.
Employment growth meanwhile picked up to reach a nine-month high in March, accelerating notably in services to a ten-month high as firms sought to keep pace with rising demand, but holding steady in manufacturing at a relatively slower pace that was among the lowest seen over the past two years.


China’s economic rebound weaker than expected, warns Maersk 70 per cent of Chinese savings are in real estate, which has been hit hard by a government crackdown on leverage, while Chinese stocks were also underperforming.
Buy-or-Rent Premium Is Highest Since 2006 Housing Bubble
With mortgage rates high and home prices still elevated, the monthly payment for a newly purchased home — assuming a 10% down payment and a 30-year fixed rate mortgage — was $1,176 more than renting an apartment at the end 2022, according to an analysis from the National Multifamily Housing Council, a trade group that represents owners of professionally managed rental buildings.
The cost of homeownership has surged 71% over the past three years, or an average of about 20% per year, compared to average annual rent growth of 6.3% over the same period. As a result, the premium owners pay over renters is now wider than it’s been since third quarter of 2006, the report said. (…)
Relief from covid money is more than over. Delinquencies on credit cards are rising sharply and are now at 2010 levels for all age groups on their way to 2008 levels:

Delinquency rates on CC loans are particularly high at smaller banks. While smaller banks are only a fraction of the CC business, their recent poor credit experience likely reflects loose lending standards overall…

…potentially also applied to their CRE loans which totally dominate that segment.

A severe recession could wipe out $140B of small bank equity. MS data show banks hold 38% of the $4.5B CRE debt outstanding. Smaller banks own 80% of that debt, $1.4B.

- Banks Step Up to Serve Crypto Firms After Signature, Silvergate Blowups As crypto companies have scrambled to establish new bank relationships, industry executives say they have received a positive reception from some regional banks.
- Small U.S. banks imperiled by big office loans
Small U.S. lenders that have outsized exposure to office loans could become the next group to face strains after bank failures roiled financial markets this month, according to analysts.
Rising interest rates, a slowdown in the commercial real estate (CRE) market and the proliferation of remote work pose challenges for smaller firms that made risky loans to finance office buildings, the analysts said.
For banks with assets between $1 billion to $10 billion, CRE loans comprised about 33% of the total held on their books, according to estimates by ratings agency Fitch. At the end of last year, CRE only made up about 6% of loans held by larger banks that had total assets of more than $250 billion, it said.
Goldman Sachs economists estimate the combined share of small and mid-sized banks, including lenders with less than $250 billion in assets, is 80% of the overall stock of commercial mortgage loans, it said in a note. (…)
The total exposure of the U.S. banking system to CRE loans was $2.5 trillion at the end of December, Fitch said. (…)


- Financial bankruptcy filings on the rise in 2023 SVB Financial Group’s Chapter 11 bankruptcy filing March 17 marked the ninth corporate bankruptcy filing in the financial sector in 2023, the highest level since 2010 for the first two-and-a-half months of the year, according to S&P Global Market Intelligence data.

Monetary Tightening and U.S. Bank Fragility in 2023
This is from the NBER last week
A case study of the recently failed Silicon Valley Bank (SVB) is illustrative. 10 percent of banks have larger unrecognized losses than those at SVB. Nor was SVB the worst capitalized bank, with 10 percent of banks having lower capitalization than SVB. On the other hand, SVB had a disproportional share of uninsured funding: only 1 percent of banks had higher uninsured leverage. Combined, losses and uninsured leverage provide incentives for an SVB uninsured depositor run. We compute similar incentives for the sample of all U.S. banks.
Even if only half of uninsured depositors decide to withdraw, almost 190 banks are at a potential risk of impairment to insured depositors, with potentially $300 billion of insured deposits at risk. If uninsured deposit withdrawals cause even small fire sales, substantially more banks are at risk. Overall, these calculations suggest that recent declines in bank asset values very significantly increased the fragility of the US banking system to uninsured depositor runs.
Now that banks can sell their underwater bonds at par to the Fed, the risk to their equity capital is substantially reduced. But uninsured deposits will continue to flee, severely limiting these banks’ ability to lend.
Money market inflows accelerated further this week, suggesting bank deposit flight continued. Last week $116 billion flowed into US money market mutual funds. This week $136 billion flowed into US money market funds (the 4th largest weekly inflow since 2007) suggesting deposit flight continued this week. (GS)

Larger banks are also seeing cash going out toward higher return instruments like mutual funds which are not in the lending business.

SVB Collapse Could Mean a $500 Billion Venture Capital ‘Haircut’
The $2 trillion venture capital industry could see portfolio markdowns of 25% to 30% — a “haircut” of possibly $500 billion — following the Silicon Valley Bank debacle, according to Bloomberg Intelligence.
“After the failure of SVB, we expect greater valuation scrutiny and disclosure, especially as a large chunk of ‘fiduciary’ capital from pension funds has flowed into these markets — and unlike endowments and family offices, there are no avenues to extend and pretend,” Bloomberg Intelligence analyst Gaurav Patankar writes in a note Friday.
Some VC and private equity firms are turning toward strategies to “extend” and “pretend,” meaning they would hold on to assets or prop up capital to avoid true price discovery, Patankar added in a Friday interview. Examples of this include net asset value loans that let general partners borrow against a pool of portfolio companies within a fund, GP-led secondary structures where a fund sponsor sells one or more assets from a fund it already manages to a new fund, and alternative financing via private credit. (…)
The Information informs us:
Tonal, a fitness startup with a cadre of celebrity backers, is crunched for cash after failing to find a buyer. The company now may take a drastic step: raising money at a valuation nearly 90% lower than its last one, in a deal that would effectively wipe out the stakes of many existing investors, people familiar with the matter said.
Private equity firm L Catterton, a current Tonal shareholder, is in talks to lead the funding round, which is expected to total $125 million at a valuation of between $200 million and $300 million, the people said. That would compare to the valuation of $1.6 billion at which Tonal last raised money, in 2021. The potential financing would be one of the harshest down rounds for a once high-flying startup that last raised money during the era of low interest rates.
Likely not the only one…
Central Banks Shed Most US Debt Since 2014 as Dollar Needs Jump
Fed data show foreign official holdings of Treasury securities fell by $76 billion in the week through March 22 to $2.86 trillion. That’s the largest weekly decline since March 2014.
At the same time, the US central bank’s recently-established Foreign and International Monetary Authorities, or FIMA, repurchase agreement facility was tapped for a record $60 billion, data show, dwarfing the $1.4 billion peak reached during the height of the pandemic. (…)
The dash for dollars all happened before the focus pivoted to Deutsche Bank AG Friday. (…)
“Our sense, given dollar funding rates, is that the borrowing was precautionary,” Barclays Plc strategist Joseph Abate said of the surge in use of the Fed’s FIMA program.
The facility was established in March 2020 and is designed to help ease any pressures in global dollar funding markets. It allows foreign central banks to post their US Treasury holdings as collateral in exchange for dollar liquidity, which is often in high demand during times of stress. The rate was 4.75% at the time of the operations, before the Fed raised borrowing costs by another quarter-point this week.
The weekly average level of usage as of Wednesday was $33 billion, which suggests an institution made multiple trips to the FIMA facility, according to Barclays.
“The central bank wanted to build a war chest of available dollars in case the banking crisis deteriorated but did not want to fire sell its Treasuries,” Abate wrote in a note to clients. (…)
“Someone, somewhere, needs dollar funding,” said Antoine Bouvet, senior rates strategist at ING Bank NV. It’s “not a huge worry at this stage given the cross-currency bases and also low take-up in dollar FX lines.” (…)
Note that the FIMA program was designed “primarily [to] be used only in times of unusual market stress” according to the Fed. It requires that counterparties post U.S. Treasury collateral at an approximate 5% annual rate.
- @Jkylebass: so it appears that the secret borrower of USD from the FED could be China.
Meanwhile, across the pond
Deutsche Bank Drops in Selloff Citi Describes as Irrational
(…) Analysts struggled to explain the selloff, which prompted German Chancellor Olaf Scholz to publicly back the lender. (…)
“Deutsche Bank has fundamentally modernized and reorganized its business model and is a very profitable bank,” Chancellor Scholz said Friday at a news conference in Brussels when asked about the lender’s situation. “There is no need to worry about anything.” (…)
@biancoresearch: This is not the stock chart of a company that is “fundamentally modernized and reorganized its business model and is a very profitable” as Scholz contends.

All of the above screams some sort of a credit crunch is coming. If the Fed saved banks from deposit runs, will it want to have to save them from a CRE crisis potentially engulfing many small and medium-size banks.
A bit of inflation for a while may be more desirable.
COLLATERAL DAMAGE?
Buyback warning (The Market Ear)
“The 20% year/year decline in buybacks during 4Q 2022 is likely one early signal of a broader slowdown in corporate spending. Buybacks typically lead stickier investment spending in capex and R&D. Despite a record $360 bn in YTD authorizations, GS Buyback Desk flows suggest actual YTD executions are running well below 2022 levels. Economic data that have historically been leading indicators of capex have also turned lower in recent months.”
Goldman

Corporations will buy a net $350 billion in equities in 2023, a 47% slowdown vs. 2022. According the GS Buyback desk, a record high $360 billion of stock buybacks have been authorized so far this year. However, authorized buybacks are concentrated among a handful of companies and executions are down significantly vs. 2022. We expect just 1% EPS growth this year and forecast S&P 500 buybacks will decline 10% from a record high of $949 billion in 2022. M&A activity has also slowed materially YTD.


 JPM Asset Management:
While the odds of a U.S. recession have increased in light of all this, the risk outlook for the markets is becoming more balanced. Monetary policy should pose less of a headwind for stocks going forward. Economic data is moving in the right direction and the slowdown in inflation, wages and activity should become more pronounced in the coming months.
Moreover, if the outlook worsens, the Fed could ease monetary policy, which could provide significant support to financial markets.
Meanwhile, the investment landscape still presents opportunities. Bonds can provide portfolios with attractive income and some capital appreciation when the Fed eventually cuts rates. An emphasis on quality is important, but broadly speaking, equity markets tend to perform well in the 12months following an end of a tightening cycle. By no means are we looking at clear skies yet, but calmer waters after a tumultuous March could provide support for balanced portfolios in the remainder of the year.

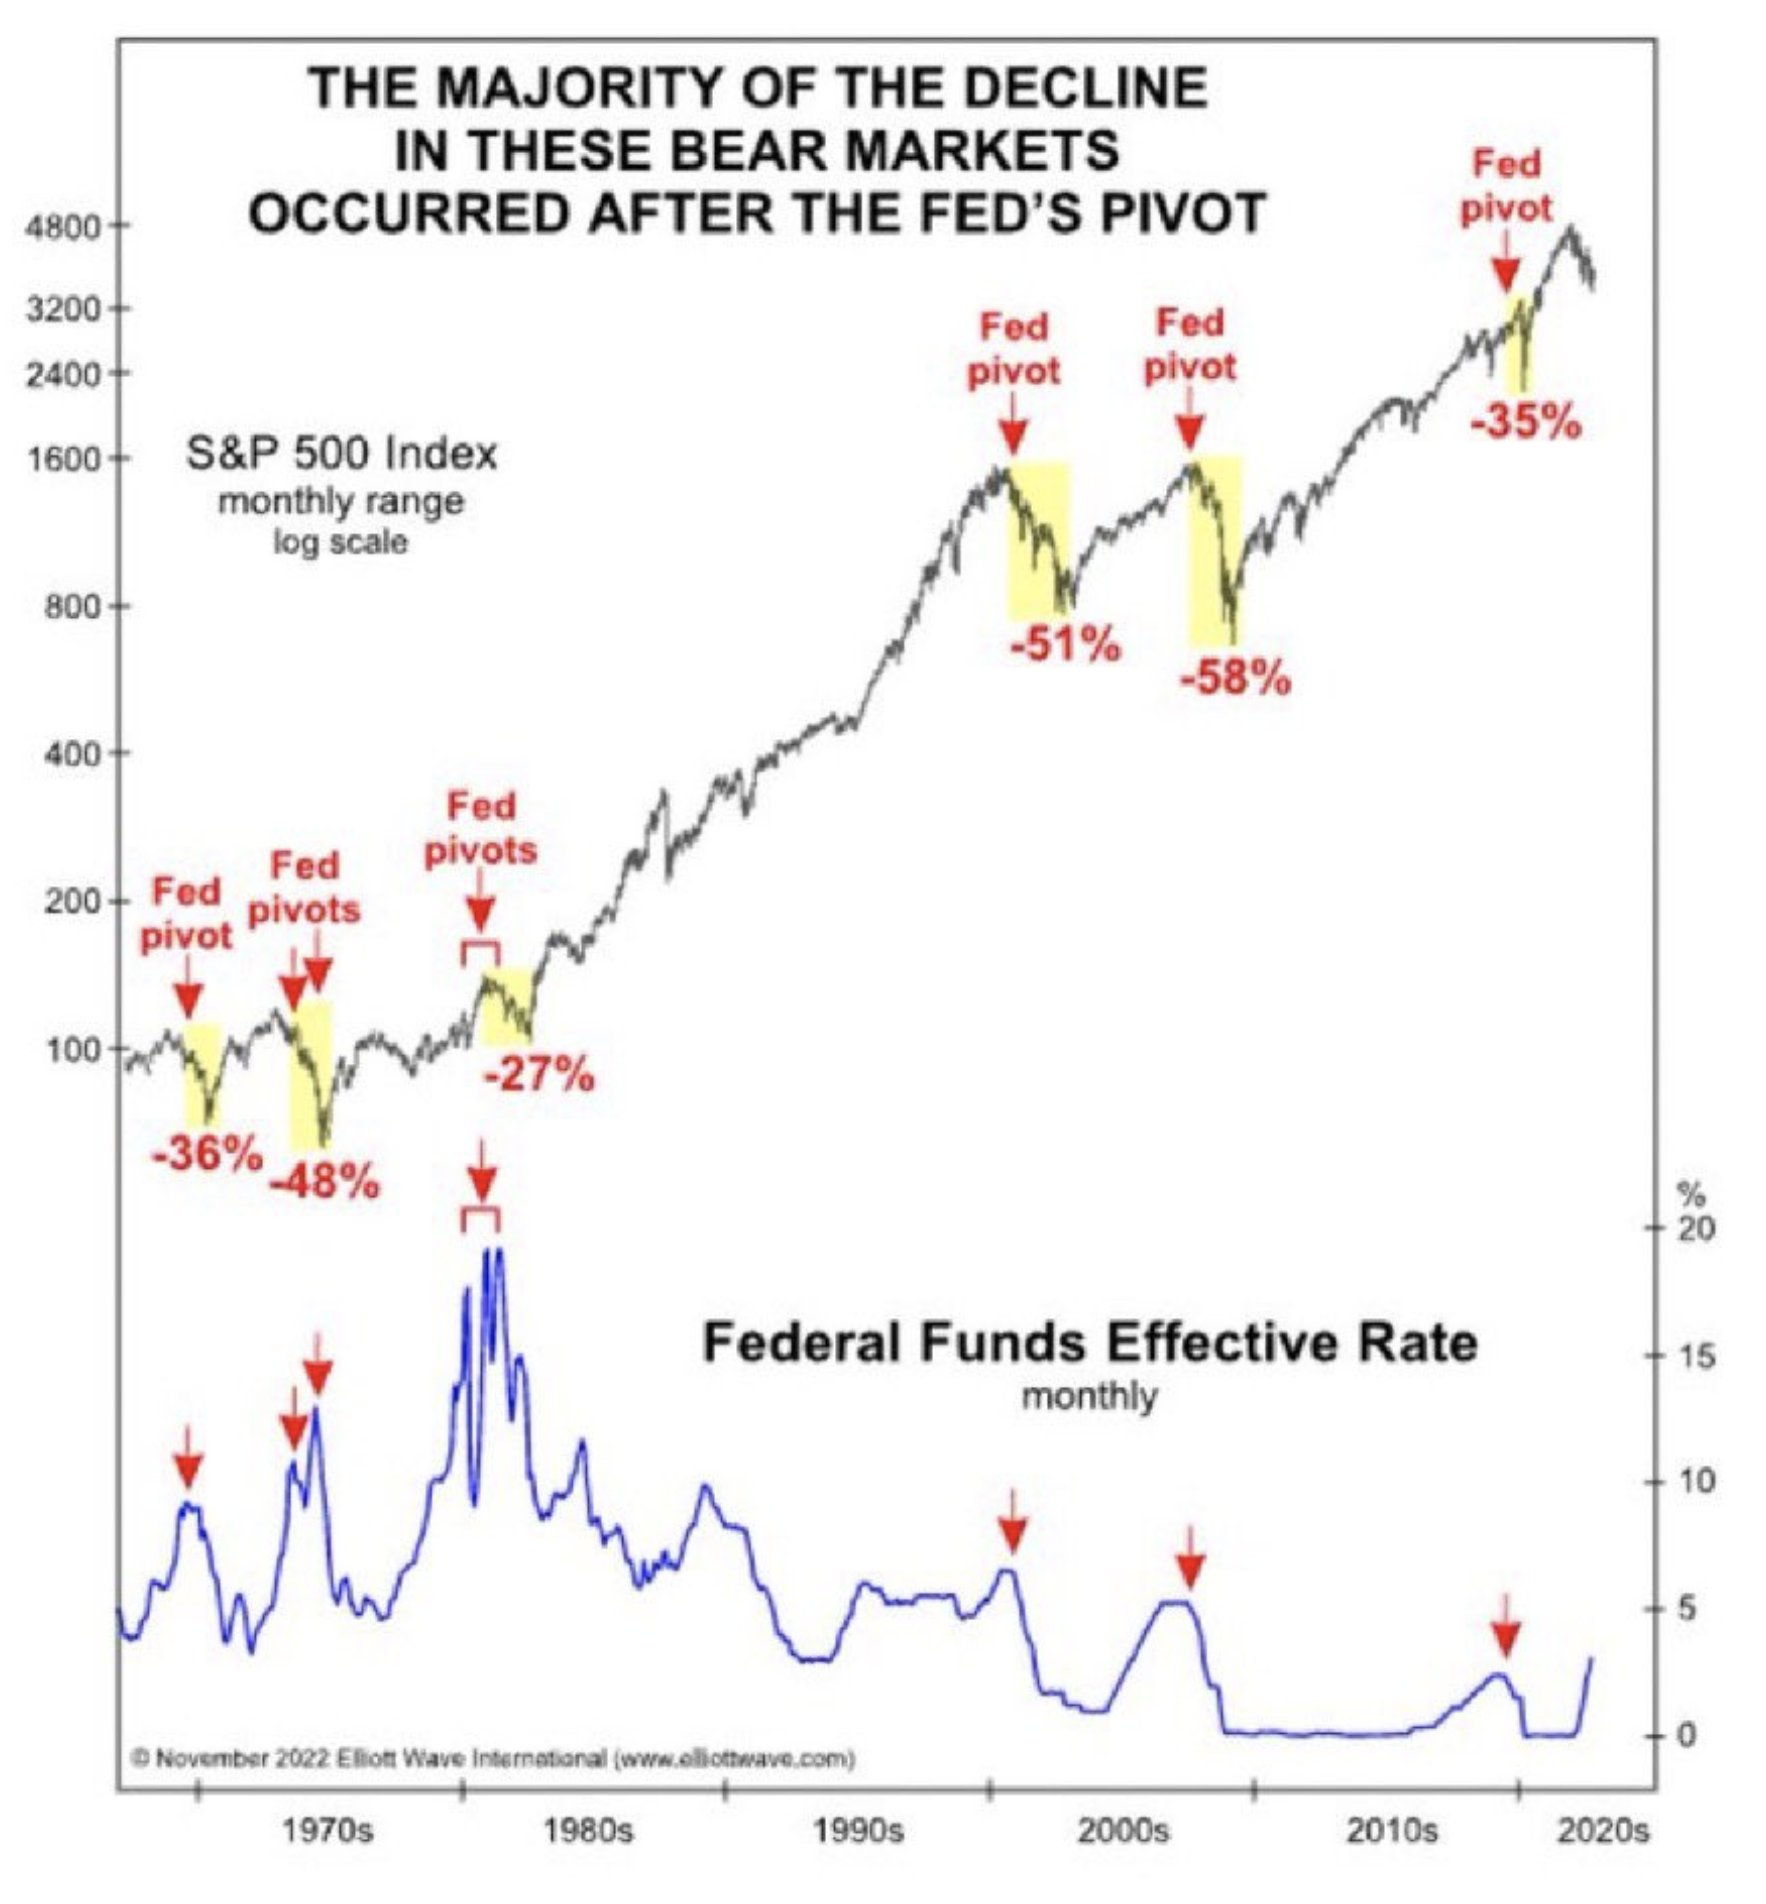
 Hmmm…my own analysis (Jan. 10 2023) showed that “buy-the-pivot” ain’t so simple.
The black circles in these next charts (log left scale) point out periods when equities fell during Fed easing periods:


While it is true that equities eventually tend to do well after Fed easing episodes, “eventually” is the key word here: most times, the Fed eases for “good” reasons. Equity markets are not always in sync with the FOMC and some lags have been very costly.
I found 15 “Fed changes of posture” since 1957.
- From the first pause to the market low, the S&P 500 troughed 9 months after, on average. But the range is -3 months to +31 months.
- From the first cut to the market low, the S&P 500 troughed 6 months after, on average. But the range is -3 months to +21 months.
Actually, the S&P 500 declined after every Fed cut but five (1966, 1980, 1984, 1989, and 1995). Equities dropped between -4.0% to -47.7% (month end data) with an average of -16.1%. If we exclude 1974 (inflation) and 2001 and 2007 (bubbles), the average is -5.9% (range: 0.0% to -19.9%).
And I found no stable correlation with valuations, inflation and profit trends that could help decide when it might be safe to jump in.
A dovish turning Fed then only tells us to reduce our underweight and get ready to buy more aggressively.
Also illustrated by elliottwave international:
Talk of a “banking/financial crisis” has dominated the business news in recent weeks. Even so, Jay noted that financial corporate insiders have been voting with their wallets.
The chart below displays Corporate Insider Buys among component companies of the Financial Select Sector SPDR Fund ETF (XLF) and denotes those times when the indicator crossed above 39.9. Note the sharp uptick in buying over the past two weeks. Under similar buying conditions, XLF rallied 88% of the time between 2-12 months later and outperformed the S&P over the next year after 6 of 8 signals.
Insiders would presumably be more inclined to sell shares if they anticipated a collapse in their sector. While insider selling has picked up somewhat, it remains subdued relative to other periods. The indicator below combines buying and selling activity into the Corporate Insider Buy/Sell Ratio – XLF indicator. The red dots note those times when the ratio has crossed above 0.139. Again, mostly gains over the medium-term.


- Outside of banks, insiders give the US market the cold shoulder (INK Research)
Insider buying has picked up over the past week, but the response outside of the Financials sector has been underwhelming. That may be explained by the behaviour of the broad market compared to the Financials group. The S&P 500 has not changed much over the past month, but as of Monday, the Dow Jones U.S. Banks Index was down about 20% during the period. Potential bargains are simply easier to find in the Financials than in the broad market.
We see the INK US Financials Indicator has moved over 100%, led by the banks. In light of this meaningful insider buying, we have put the Financials sector on watch for a possible upgrade to undervalued. We are also watching the Energy sector for
a possible upgrade as insider sentiment continues to climb.(…) the INK US Indicator, which tracks insider sentiment across listed companies on the major US exchanges, sits at an unimpressive 33%. That means there have been three stocks with key insider selling for every one stock with key insider buying over the past 60 days. Moreover, insider selling measured in dollars has picked up and is now above average as we near the end of Q1.
The broad American market remains unattractive from an insider sentiment perspective. Based on our signals, passive investors betting on a buy-and-hold strategy via market-cap-weighted ETFs are likely to remain frustrated for months to come.


Ink’s list of companies with net insider buying and selling can be accessed in the Inside Insiders section of my SPECIAL FRIENDS PLACE.
Ed Yardeni:
Eight of the 11 S&P 500 sectors are down ytd, led by an 11.1% drop in Energy and a 9.4% decline in Financials, while only three are up ytd, namely Communication Services (18.4%), Information Technology (17.5), and Consumer Discretionary (9.6). The three outperforming sectors are doing well because they include the MegaCap-8 stocks, which as a group are up 26.5% ytd based on their collective market cap.

FYI, these 8 MegaCap stocks average a 43.3 trailing P/E, 37.6x on forward.

 REALLY COOL!!


