The enemy of knowledge is not ignorance, it’s the illusion of knowledge (Stephen Hawking)

It ain’t what you don’t know that gets you into trouble. It’s what you know for sure that just ain’t so (Mark Twain)

Invest with smart knowledge and objective odds

THE DAILY EDGE: 7 MARCH 2023

Jerome Powell to Testify to Congress on Outlook for Rates, Inflation

Federal Reserve Chair Jerome Powell is likely to caution on Capitol Hill that strong economic activity this year could lead U.S. central bank officials to raise interest rates more than they expected to combat high inflation.

Mr. Powell is set to testify for two days, starting Tuesday at 10 a.m. Eastern time before the Senate Banking Committee and continuing Wednesday before a House committee. They will be his last scheduled public remarks on interest-rate policy, and a final chance to shape market expectations, before the Fed’s next meeting, March 21-22. Officials begin their premeeting quiet period on Saturday. (…)

Confused smile The St-Louis Fed’s GDP Nowcast is at -1.2% for Q1’23 while the Atlanta Fed’s GDPNow is flagging +2.3%. Presumably with the same database!

fredgraph - 2023-03-06T091119.855

A casual observation says that Atlanta has been closer to the actual mark (black). Goldman Sachs just increased its Q1 GDP +2.0%. Its domestic final sales forecast is at +2.3%.

The blowout 517,000 jump in January payrolls caught everyone by surprise, coming in 200,000 higher than even the most optimistic forecasts out there. The unemployment was also better than predicted, falling to a 53-year low of 3.4%. The issue was it didn’t tally with any of the business surveys so to try to explain we looked at one-off factors that could have boosted the numbers.

The most obvious case is the 74,000 jump in government workers led by state and local government education workers. This was due to the ending of strike action by University of California Academics. This merely reverses job losses seen in November and December and means February will experience a return to much lower growth.

This does nothing to explain the strength in private payrolls though, which rose 443,000, so we looked at the raw data. The table below charts what has happened in each month for the past seven years (excluding 2020 where the pandemic disrupted the usual seasonal patterns).

Non-seasonally adjusted employment changes by months and year (millions of jobs)Source: Macrobond, ING

Source: Macrobond, ING

This first thing to say is that the US economy certainly didn’t add 517,000 jobs in January. January is a month where millions of people lose their jobs. This is partly down to the end of the holiday season with people spending less on retail, leisure and hospitality with businesses typically laying off staff at this time. Then there is the weather impacting with winter temperatures and snow limiting the ability of people to work outside – so the likes of construction gets hit along with mining and oil and gas drilling.

According to the National Oceanic and Atmospheric Administration, January 2023 was the sixth warmest on record and was the warmest on record for the most North Easterly states with fewer snow days than the average over the past 20 years. This meant construction, mining and drilling has been less disrupted and people were out and about more, spending money.

Typically, 2.7-3.1mn jobs are shed in January. This year there were only 2.5mn jobs lost in January, so fewer lay-offs, but not massively so. It is therefore likely that labour hoarding in the form of reduced seasonal layoffs post the holiday season was responsible for the strength, but ‘generous’ seasonal adjustment factors appear to have provided an additional boost to generate the seasonally adjusted 517,000 gain.

What about the February jobs report?

So far we have only had the ISM reports with the manufacturing index falling into contraction territory while the service index jumped four points to its highest level since December 2021. Nonetheless, the relationship month to month with payrolls has been poor. On Wednesday we will get the ADP private sector report, which the market expects to rise to 200,000, but remember that the 106,000 outcome for January gave very misleading signals. We will also get the job vacancy data from the JOLTS report for January, which is forecast to drop by more than 400k. This would still leave it pointing to far more job vacancies than there are Americans to fill them.

Given the mixed messaging we have pencilled in a 200,000 jobs gain for February but we have little confidence in that forecast given the seasonal adjustment factors and unusual weather patterns. The consensus remains tight with a range of 100,000-325,000 so there is the risk of another big miss, both to the upside and the downside.

High five Note that February was also warmer than normal, in the top 10% warmest Februarys on record.

With over 199 million LinkedIn members in the United States, we have unique insight into the real-time dynamics of Americans starting new jobs and moving to new cities. This month’s LinkedIn Workforce Report looks at our latest national data on hiring and migration trends through February 2023.

  • Largest hiring declines seen since April 2020: Nationally, across all industries, hiring decreased 6.5% in February compared to January. This is the largest month-over-month decrease we’ve seen since April 2020, though we don’t expect declines of this magnitude to occur on a regular basis going forward. Year-over-year hiring decreased 27.9% – and hiring has now declined for 10 consecutive months. Additionally, our Workforce Confidence Index data from February showed worker confidence in finding and holding a job declined to its lowest level since 2021, consistent with the decline we’re currently seeing in the LinkedIn Hiring Rate.
  • Hiring in Government Administration, Consumer Services, Education continue to show resilience: Hiring increased month-over-month in 4 of 20 industries – this is a decrease from the 9 industries that saw hiring gains in January. The industries which saw the biggest month-over-month gains were in Real Estate (+3.7%), Education (+2.1%), and Accommodation (+1.3%). The biggest month-over-month declines were in Manufacturing (-10.7%), Technology, Information and Media (-9.6%), and Construction (-9.2%). Since the hiring slowdowns that began last Spring – April 2022 – the industries that have continued to show the most resilience are Government Administration (-10.1%), Consumer Services (-11.5%), Education (-12.8%). Education was the only industry where hiring remains above pre-pandemic levels. And the Technology, Information and Media industry continues to see declines – with hiring in the sector now just 3.8% above its pandemic low in May 2020.

  • Hiring across all metros below pre-pandemic levels: Hiring increased month-over-month in 4 of 20 metro areas we track; this is a decline from the seven metros that saw gains in January. While we saw hiring increases month-over-month in select cities, none of the metros had hiring above pre-pandemic levels. (…)

Image

Housing Market Momentum Stalls as Spring Approaches Rising interest rates are again squeezing affordability and driving mortgage applications to their lowest levels in decades.

Chinese Exports Pull Back Again, Hampering Post-Covid Recovery The export engine that propelled China’s recovery through much of the Covid-19 pandemic sputtered to start the year.

Exports from the world’s second largest economy fell 6.8% during the first two months of 2023 from a year earlier, extending a string of year-over-year declines stretching back to October, data from China’s customs bureau showed Tuesday. (…)

The decline in exports for January and February, which China releases together to smooth out irregularities tied to the Lunar New Year holiday, was less than the 9.9% decline in December and better than the 9% pullback expected by economists surveyed by The Wall Street Journal.

The better-than-expected result likely reflects what appears to have been a one-off boost from the lifting of pandemic restrictions, according to economists from Capital Economics, who say that the outlook for exports could deteriorate again, with foreign demand still in the dumps.

Chinese imports, meanwhile, fell by a larger-than-expected 10.2% in the January to February period, worse than December’s 7.5% year-over-year decline and the 5.1% pullback forecast by surveyed economists. That indicates China’s reopening hasn’t translated into increased infrastructure investment, at least for now.

As a result, China’s trade surplus swelled to $116.88 billion, larger than the $78.01 billion surplus in December. (…)

During the first two months of the year, Chinese exports to Southeast Asia rose 9% from a year earlier, according to Chinese customs data, while shipments to the European Union and the U.S.—China’s second and third-largest trading partners—fell 12.2% and 21.8%, respectively. (…)

In South Korea, a bellwether for global trade, exports shrank for a fifth straight month in February, partly because demand from China remained weak. Outbound shipments from South Korea fell 7.5% last month from a year earlier, though the decline wasn’t as bad as January’s 16.6% drop. Exports of semiconductors plunged 42.5% as global demand for electronics continued to falter. (…)

Image

Last week’s PMIs confirm weak demand for goods from most areas but South-East Asia:

  • USA: A further drop in new order inflows contributed to the continued overall decline in manufacturing sector health in February. The rate of contraction was little-changed from that seen in January and was strong overall. Foreign demand conditions also weakened further, with new export orders falling for the ninth month running. The pace of decrease quickened from January and was solid overall.
  • Eurozone: New orders fell for a tenth successive month as client destocking, inflation and general economic uncertainty weighed on sales performances.
    A notable and stronger drag on demand came from international markets, as evidenced by a quicker decline in new export orders during February.
  • Japan: New sales fell for the eighth month running, and at the fastest pace since July 2020. Firms commented that orders were dampened by weaknesses in domestic and global economic conditions. Export orders also fell at a steeper rate that was the fastest for 31 months, and meant that foreign demand for Japanese manufactured goods had fallen consistently for a year.
  • ASEAN: New order inflows rose for the second consecutive month, and at a quickened pace.
  • China: Total new business expanded for the first time in seven months, and at the quickest rate since May 2021.
    Companies noted an improvement in foreign demand for Chinese manufactured goods, with new export orders rising for the first time since July 2022.

The bigger story from China is the 10.2% drop in imports after -7.5% in December. Domestic demand remains weak.

DIVERSIFY?

I am no Warren Buffett but I also believe that if you have done your research thoroughly and have properly assessed managements and your margins of safety (valuations), portfolio concentration actually decreases risk. He said:

Risk comes from not knowing what you are doing so wide diversification is only required when investors are ignorant.

You only have to do a very few things in your life so long as you don’t do too many things wrong.

In his latest comments to shareholders, he admits that most of his capital allocation decisions have been ‘no better than so-so’, and that his outstanding results were because of a few ‘truly good decisions’. And few terrible ones, thanks to his focus on valuations (margin of safety), I would add.

May be an image of 1 person and text that says 'WARREN BUFFETT'S PORTFOLIO Other 13% VISA Apple Inc 39% Kroger ACTIVISION BILARD MOODY'S Moody's 2.3% Occidental Petroleum 4.1% Kraft Heinz Kraf'Heinz 4.4% AMERICAN ANGERCN EXPRESS American Express Coca-Cola 7.5% Chevron Bank of America 11% Coca-Cola 8.5% Leverage Shares Chevron 9.8% rkshire Hathaway 2022 Capital risk.'Leverage Shares

China’s Xi Jinping Takes Rare Direct Aim at U.S. in Speech Leader blames Washington-led ‘containment, encirclement and suppression’ for challenges at home

Chinese leader Xi Jinping issued an unusually blunt rebuke of U.S. policy on Monday, blaming what he termed a Washington-led campaign to suppress China for recent challenges facing his country.

“Western countries—led by the U.S.—have implemented all-round containment, encirclement and suppression against us, bringing unprecedentedly severe challenges to our country’s development,” Mr. Xi was quoted by state media as saying on Monday. (…)

The accusation of U.S. suppression of China’s development over the past five years comes as Mr. Xi faces charges from investors that China’s economy has been damaged by his policies, including the emphasis on national security. (…)

The English-language version of Mr. Xi’s speech reported by Xinhua didn’t refer to containment or the U.S. Instead, it quoted him telling fellow officials to “have the courage to fight as the country faces profound and complex changes in both the domestic and international landscape.” (…)

The accusations by Mr. Xi against the U.S., delivered to an audience that includes politically connected businesspeople, appeared in part to be an effort by Mr. Xi to shift blame away from his own policymaking, including tough Covid controls that have weakened the economy and pressure on technology companies that cost the industry some of its dynamism. (…)

“In the coming period of time, the risks and challenges that we face will only increase and intensify ever more,” Mr. Xi was quoted as saying by Xinhua.

Chinese officials have long warned the U.S. against what they call Cold War thinking, and Mr. Xi appeared to make a similar point in his November summit with President Biden, according to China’s official summary of the meeting. (…)

(…) “If the United States does not hit the brakes but continues to speed down the wrong path, no amount of guardrails can prevent derailing and there will surely be conflict and confrontation,” said Mr. Qin, who was named foreign minister in late December after serving as China’s ambassador to the U.S. “Who will bear the consequences? Such competition is a reckless gamble.”

It isn’t the first time China has warned the U.S. about the risk of conflict if the countries’ relationship isn’t handled well, although Chinese officials have tended to speak more elliptically about the risk of conflict. (…)

“China and Russia have found a path of major country relations featuring strategic trust and good neighborliness, setting a good example for international relations,” Mr. Qin said. “The more unstable the world becomes, the more imperative it is for China and Russia to steadily advance their relations.” (…)

(…) India wants more protection from China, and freer trade with everyone else. That’s a lot like the U.S., except India starts with high barriers and is lowering them for friends while the U.S. starts with low barriers and is raising them on China. It is a more selective model of free trade than the universal model idealized since the early 1990s. (…)

  • Canada’s PM Justin Trudeau ordered a review of allegations China interfered in Canada’s elections, appointing a special investigator. The issue will also be studied by a group of lawmakers cleared to see top-secret intelligence.
KEEP UP WITH THE ACRONYMS

The TINA — “there is no alternative” to stocks — trade is giving way to TARA, TAPAS and even TIARA, according to Goldman Sachs, Deutsche Bank and Insight Investment, respectively. Translations: there are reasonable alternatives, there are plenty of alternatives, and there is a realistic alternative, Axios’ Hope writes.

THE DAILY EDGE: 6 MARCH 2023

U.S. SERVICES PMIs

S&P Global’s: Selling price inflation accelerates amid renewed upturn in output in February

  • PMI rose from 46.8 to 50.6, signalling “only a marginal uptick in business activity, but an end to a seven-month sequence of contraction.”
  • New business across the service sector continued to decrease during February, albeit at a softer rate. The impact of higher interest rates and inflationary pressures
    remained a drag on customer spending, according to survey respondents. Some reports of improving demand conditions led new orders to fall at the slowest pace since last October, however.
  • New export orders declined for the ninth month running midway through the first quarter, the pace of contraction was solid overall.
  • The rate of job creation was the quickest since September 2022, despite being only marginal overall. Some companies noted that greater availability of candidates
    supported the upturn.
  • Meanwhile, service sector firms registered a marked rise in cost burdens midway through the first quarter. The uptick in input prices was driven by supplier price hikes, higher wage bills and increased expenses following interest rate changes. Nonetheless, the pace of cost inflation lost momentum and was the second-slowest since October 2020.
  • Despite a softer increase in cost burdens, service providers raised their selling prices at a sharper pace in February. The rate of charge inflation was the quickest since October 2022 and strong overall. Survey respondents commonly noted that higher output charges were due to the pass-through of greater costs to clients.

image

image

The ISM:

  • imageEconomic activity in the services sector expanded in February for the second consecutive month as the Services PMI® registered 55.1 percent vs 55.2.
  • New orders: 62.6 vs 60.4.
  • Employment Index registered 54 percent, up 4 percentage points from the January figure of 50 percent. “Increase in applications resulting in more new hires”

New Orders                                   Employment

 image image

WHAT RESPONDENTS ARE SAYING
  • “Sales activity is generally strong, despite economic headwinds.” [Accommodation & Food Services]
  • “Activity is steady. Costs continue to escalate, eliminating any profit we had hoped for in the first and second quarters.” [Construction]
  • “There is some slight improvement in availability and delivery turns.” [Educational Services]
  • “Upward pricing pressures have eased slightly but are still elevated.” [Finance & Insurance]
  • “Inflation, though somewhat eased from the peaks of the past six months, continues to drive higher-pricing demands from suppliers.” [Health Care & Social Assistance]
  • “The current dynamics in the marketplace are such that it is getting harder to reduce costs. Most industries are being pinched by inflation and more expensive labor markets. Before, cost reduction was the goal; it’s now cost avoidance. That said, since we’re not able to reduce cost to maintain margins, we have to reduce the employee base more aggressively to achieve margins.” [Information]
  • “Seeing a slow decline in activity, but not a collapse like in 2009.” [Management of Companies & Support Services]
  • “Generally flat activity level.” [Mining]
  • “Starting the new business cycle with a noticeable uptick in demand.” [Professional, Scientific & Technical Services]
  • “Continual effort to right-size inventory to match lower sales forecasts for the coming year.” [Retail Trade]
  • “Customers now are very cost conscious and looking for lower-priced product options.” [Wholesale Trade]

The discrepancies between the two surveys narrowed but remain, particularly on new orders.

Powell preview

In testimony to lawmakers this week, Fed Chair Jerome Powell is expected to echo fellow central bankers in suggesting interest rates will go higher than policymakers anticipated just weeks ago if economic data continue to come in hot. Traders are betting the Fed will hike rates beyond the 5.1% level officials estimated in December. A hawkish tone from Powell, when he appears before a Senate panel on Tuesday and a House committee Wednesday, will likely prompt pushback from progressives warning the Fed not to inflict undue pain on the labor market. (Bloomberg)

Larry Summers Urges Fed’s Powell to Open Door to 50 Basis Points in March

(…) Six recent jolts have hurt the possibility of the soft landing that the Fed has sought, according to Summers:

  • Seasonal revisions to the consumer price index that took the downward trend of inflation out of the data for the last several months of 2022.
  • The CPI for January showed an acceleration in inflation.
  • The personal consumption expenditures price index also picked up.
  • January economic indicators “read strong.”
  • Wage figures “no longer show the kind of reductions that we had been expecting.”
  • The jump in Treasury yields, with 10-year rates climbing past 4%

Not to mention February’s uptick in rentflation (Oups! Rents Are Rising!).

Retailers Fear High-Flying US Consumers Are Falling Back to Earth After the highest inflation in a generation, an increasing group of shoppers — including wealthy ones — are bargain hunting.

(…) Rising prices not only make paychecks seem smaller, but they’ve also papered over the fact that a lot of the sales growth in the consumer sector has been from inflation, not shoppers buying more stuff.

Home Depot Inc. has been one of the biggest beneficiaries of the pandemic because increased time at home led Americans to spend more on sprucing up their houses. It has boosted revenue by $47 billion, a 43% gain, since Covid-19 hit the US in early 2020.

But in the fourth quarter, which ran through January, the chain’s sales gained just 0.3% — its worst quarterly performance when excluding the initial hit from the pandemic in almost a decade. That came as transactions fell by 24 million, or 6%. Its results were saved by inflation as the average purchase rose by 5.8%. (…)

Inflation can create an illusion of growth. Business sales and sales expectations have converged to nominal GDP’s final sales to private domestic purchasers (solid black)which slowed from 12.5% YoY growth in Q4’21 to 7.2% in Q4’22, likely on its way to the 4.5% range indicated by February’s business expectations.

But growth in real demand has slowed to less than 1.0% in Q4’22, its weakest reading (ex-pandemic) since 2007…

fredgraph - 2023-03-04T064249.242

… Actually, since 1968, real domestic demand has never been below 1.0% YoY other than in a recession.

fredgraph - 2023-03-04T065658.881

(…) A manufacturing downturn could be a sign of trouble in the broader U.S. economy. Although manufacturing accounts for a relatively small share of gross domestic product, about 11%, it has historically been an early indicator of recession. (…)

Sun Lightning Rainbow Hard, soft, or no landing? The Motley Fool’s recent roundtable with Liz Ann Sonders, Ed Yardeni and Jurrien Timmer covers them all, and a lot more. Pretty good in its entirety.

Global output and new orders expand for first time seven months in February

The February PMIs provide a convincing signal that the global expansion is gathering steam early in the year. The global composite output PMI rose 2.4-pt to an eight-month high of 52.1 in February, consistent with global GDP growing at its potential pace. The new orders PMI also took an encouraging step up in February. This performance uplift is filtering through to the labor market and business confidence.

With reduced recession risks, improving supply chains, and the reopening of the Chinese economy likely to boost demand in the immediate future, further gains in output are expected in the coming months.

 image image

China Sets Lowest Economic Growth Target in Decades Officials aim for around 5% GDP growth this year, the lowest target in a quarter-century
Toronto Home Prices Increase for First Time in Almost a Year

The price of a home in Canada’s largest city rose 1.1% to C$1.09 million ($803,000), in February on a non-seasonally adjusted basis, according to data released Friday by the Toronto Regional Real Estate Board. February’s gain is the first month-over-month price increase since the central bank started raising borrowing costs in March 2022. (…)

Even after February’s bump, benchmark prices in Toronto are still down nearly 19% from their peak last year.

There were some signs of buyer interest returning last month, with the number of sales in February rising 8.5% from a month earlier to 5,224 transactions on a seasonally adjusted basis. That’s the highest number since August, although it’s still only about half of the transactions in February 2022.

New listings, meanwhile, were down 41% from the same month a year earlier, the real estate board data show. (…)

image

(NBF)

EARNINGS WATCH

Through Mar. 3, 493 companies in the S&P 500 Index have reported earnings for Q4 2022. Of these companies, 67.7% reported earnings above analyst expectations and 27.2% reported earnings below analyst expectations. In a typical quarter (since 1994), 66% of companies beat estimates and 20% miss estimates. Over the past four quarters, 76% of companies beat the estimates and 21% missed estimates.

In aggregate, companies are reporting earnings that are 1.0% above estimates, which compares to a long-term (since 1994) average surprise factor of 4.1% and the average surprise factor over the prior four quarters of 5.3%.

Of these companies, 67.5% reported revenue above analyst expectations and 32.5% reported revenue below analyst expectations. In a typical quarter (since 2002), 62% of companies beat estimates and 38% miss estimates. Over the past four quarters, 73% of companies beat the estimates and 27% missed estimates.

In aggregate, companies are reporting revenues that are 1.7% above estimates, which compares to a long-term (since 2002) average surprise factor of 1.3% and the average surprise factor over the prior four quarters of 2.5%.

The estimated earnings growth rate for the S&P 500 for 22Q4 is -3.2% [-2.7% on Feb. 3]. If the energy sector is excluded, the growth rate declines to -7.4% [-7.0%].

The estimated revenue growth rate for the S&P 500 for 22Q4 is 5.8% [4.6%]. If the energy sector is excluded, the growth rate declines to 5.0% [3.7%].

The estimated earnings growth rate for the S&P 500 for 23Q1 is -4.5% [-2.5%]. If the energy sector is excluded, the growth rate declines to -6.3% [-4.3%].

After nearly all S&P 500 companies have reported, 68% have beaten expectations, yet, both revenues and earnings have been ratcheted down for both Q4’22 and, more significantly, Q1’23.

 image image

Factset calculates that the Q1 bottom-up EPS estimate decreased by 5.7%, much more than usual. “Analysts usually reduce annual earnings estimates modestly during the first two months of the year”. Their estimates in January and February declined 1.6% on average during the past 5 years and the reduction never exceeded 1.7% in the last 20 years.

02-sp-500-q1-2023-bottom-up-eps-december-31-to-february-28

Earnings growth is seen bottoming out in Q1 with Ex-Energy earnings growth returning positive in Q2 and reaching +13.3% in Q4’23. Analysts are thus expecting a nice improvement in margins this year.

As François Trahan illustrates, “The decline in EPS thus far is attributable to weaker margins and nothing more.”

Image

Analysts see revenue growth averaging 3.0% in 2023, reaching 4.2% in Q4.

Recall that the S&P 500 Index is a “goods” index. This Yardeni.com chart illustrates the tight correlation between trends in the ISM Manufacturing PMI and S&P companies revenues growth.

image

At its current level, the ISM PMI suggests that revenue growth will turn negative in 2023. Not in analysts’ models yet.

My sense is that analysts are just as puzzled as everybody else on the economy and inflation and that their aggregate individual forecasts must look like camels.

I put more weight on corporate guidance:

Compared with the same period during Q4’22, fifteen more companies have pre-announced, all negative, bringing the total negatives to 78, 47% more than at the same time last quarter.

image

Trailing earnings are now $221.71. Full year 2023: $221.64, potentially reaching $248.27 in 2024.

Here’s the hopeful trends by sector:

image

The Hidden Message in Credit Spreads

Today’s John Authers’ Bloomberg column debates about the apparent complacency of credit markets:

The credit market is trying to tell us something. But what, exactly? Look at it almost any way, and credit is available at rates that imply no particular risk of default, and very little risk of recession. In both the euro zone and the US, high-yield bonds are looking misnamed. After a brief and sharp rise last year, their spreads over equivalent five-year government bonds are right back to a level that suggests all is quiet:

The pattern continues in investment-grade credit. And if we compare it with cash in the form of the yield on six-month Treasury bills, the reward for risking an investment in corporate credit is historically low. The spread is less than 1%, and at one point dipped below the low set in the spring of 2007, just as the Global Financial Crisis was about to break out:

This flies in the face of other important indicators. The Federal Reserve’s survey of senior lending officers measures whether banks are tightening or loosening their lending standards, and at present shows a sharp tightening. As demonstrated in the chart by Andrew Lapthorne, chief quantitative strategist at Societe Generale SA, tighter bank standards generally imply higher credit spreads, at least for junk bonds. But not now:

(…) All of this looks very strange. Even with cash offering a guaranteed return over six months that is close to the yield of corporate credit, there doesn’t yet appear to be any great concern. The parallels with the GFC, which began in 2007 as credit markets that had long been absurdly overvaluing corporate and mortgage-backed credit began to crack, are obvious. The fact that corporate credit is now trading at a spread over six-month Treasury bills only previously seen in the spring of 2007 is disquieting to say the least. (…)

So the credit market could be telling us that we are back in the realm of irrational equanimity, brewing perfect conditions for a crisis. But there’s another way to look at it, which is that the credit market might just conceivably have it right. Memories of the GFC are still fresh. People keep making the same mistakes, but it’s rare to repeat a mistake quite this big quite this quickly.

And while the credit market looks alarmingly tight given the environment of rising rates and fears of recession, there are other ways in which this is very different from 2007. The critical one is that consumers’ balance sheets are in much better shape, in part thanks to learning the lessons of the GFC, and in part because households received so much government largesse to tide them through the pandemic. (…)

While households and corporations can still service their debts as easily as they can at present, there is no risk of a repetition of the GFC. The problem is that it might not be possible to beat inflation without the kind of genuine tightening that comes when businesses are driven to the wall.

For a revealing insight on this, listen to this podcast in which my colleague Vildana Hajric asked Alan Blinder, now a professor at Princeton, about an anecdote he tells about Paul Volcker.

As a young academic, he once asked the man now lauded as the slayer of inflation just how monetary policy could bring inflation down. Volcker’s reply: through bankruptcies. Tighter rates, in his view, worked by pushing some businesses to the wall and squeezing the life out of inflationary pressures.

Assuming Volcker was right about this, then perhaps the credit market does have a message for us. Rates will have to rise further, until they force defaults (and bring down corporate profits), before inflation can be beaten.

SNL Image

FYI:
TECHNICALS WATCH
  • The S&P 500 Large Cap Index – 13/34–Week EMA Trend is trying to turn bullish but high volatility warrants a question mark.

image

(TradingView)

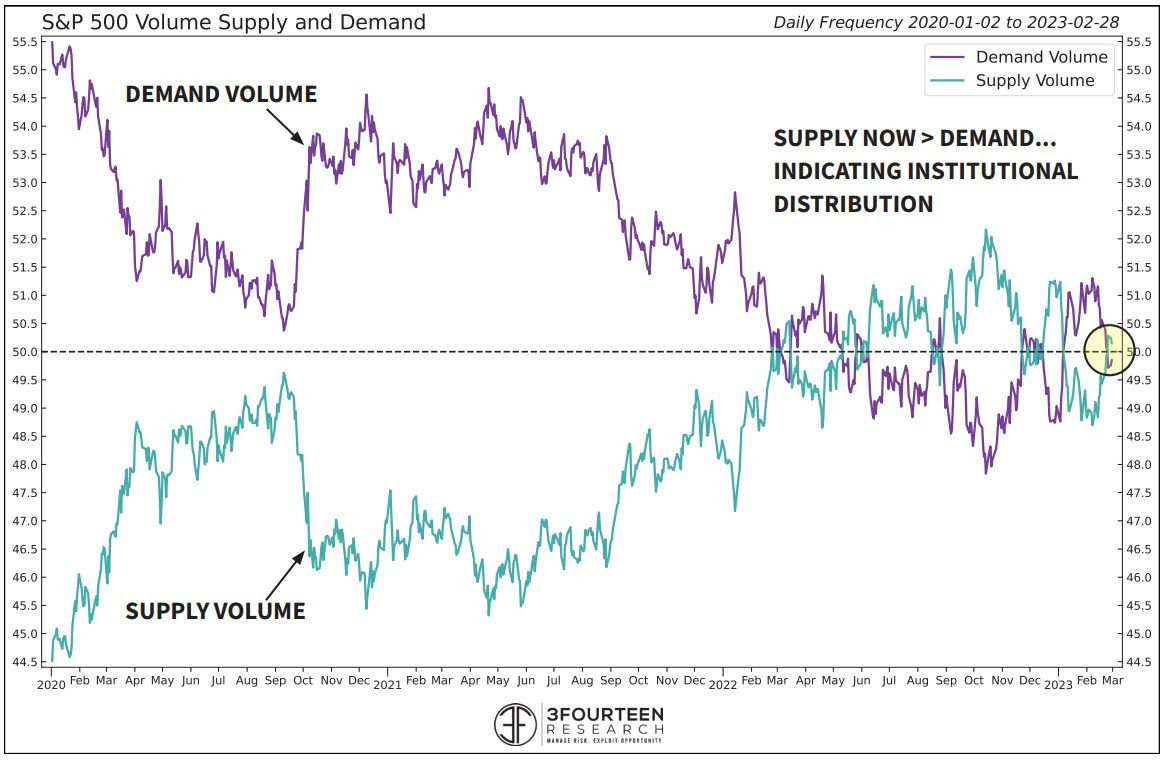
  • Volume Battleground:  The bull-bear-battle is also playing out in volumes — this chart shows the volume on up days vs down days (how technicians gauge the relative flows in terms of demand and supply in the market). Normally in a bull market demand/up volume would dominate, and certainly after a major/decisive bottom in the market you would expect to see “accumulation“ (more demand volume). So arguably another piece of evidence against the new bull thesis.

Source:  @3F_Research (via Chartstorm)

Morgan Stanley’s Michael Wilson pivoted on the short-term outlook for US stocks, saying the rally may have room to run before earnings headwinds increase. (…) He noted that the S&P 500 stayed above its 200-day moving average, and could see further upside if the dollar and interest rates continue to recede after last Friday’s drop.

While Wilson sees the next resistance for the S&P 500 at 4,150 points — about 2.5% higher than Friday’s close — he views it as a short-term pivot. Markets have further to fall in the medium term, as fundamentals continue to deteriorate, especially on the earnings front, he wrote. 

Despite the rally, “we believe it does not refute the very poor risk reward currently offered by many stocks given valuations and earnings forecasts that remain way too high, in our view,” Wilson said, expecting margins to disappoint the current consensus “by a large amount.”

Wilson noted the gap between reported earnings and cash flow is the widest in 25 years, driven by excess inventory and capitalized costs that have yet to be reflected. (…)

Note that the 200dma is still falling.

image

(TradingView)

  • Cash ain’t trash. Rather than a drag on portfolios, investors say cash may be a winning strategy this year.

Crypto Companies Behind Tether Used Falsified Documents and Shell Companies to Get Bank Accounts Tether Holdings and related crypto broker obscured identities, documents show

In late 2018, the companies behind the most widely traded cryptocurrency were struggling to maintain their access to the global banking system. Some of their backers turned to shadowy intermediaries, falsified documents and shell companies to get back in, documents show. (…)

Tether runs tether, the $71 billion stablecoin that is the most widely traded cryptocurrency, and a sister company runs Bitfinex, one of the world’s largest crypto exchanges. Losing access to the banking system was “an existential threat” to their business, the companies said in a lawsuit.

A cache of emails and documents reviewed by the Journal show a long-running effort to stay connected to the financial system. The companies often hid their identities behind other businesses or individuals. Using third parties occasionally caused problems, including hundreds of millions of dollars of seized assets and connections to a designated terrorist organization.

In a statement after this article was published online, Tether said the Journal’s report was “wholly inaccurate and misleading” and said that Tether and Bitfinex have “world-class compliance programs” and adhere to legal requirements. (…)

The WSJ is finding its way into the crypto web, unearthing myriads of dubious interlinks underpinning an apparent house of cards that traditional financial institutions refuse to support. Now, finally, authorities are stepping in.

Silvergate bet big on the crypto market, focusing on crypto firms as a way to distinguish itself from other regional banks by becoming a conduit for turning dollars into digital currency. It grew along with the rest of the market during crypto’s rise but has fallen fast. On Wednesday, Silvergate said that it was at risk of being “less than well-capitalized” and was evaluating its ability to continue doing business.

On Thursday, the crypto firms Coinbase Global Inc., Circle Internet Financial, Paxos Trust Co. and Galaxy Digital Holdings Ltd. all announced plans to stop banking with Silvergate. (…)

While the crypto industry likes to pitch itself as an alternative to the traditional financial system, crypto firms rely heavily on regulated banks. Without banks, crypto companies struggle to fulfill basic functions, such as moving money on behalf of customers or paying employees.

“This is a very important part of crypto infrastructure,” said Ilan Solot, co-head of digital assets at the London-based financial firm Marex. “It’s going to be evermore difficult for the U.S. crypto industry to connect with the financial system.” (…)

The three major banking regulators warned banks in January that they were concerned about their crypto ties. They cited “significant safety and soundness concerns” and questioned if the industry could be safely banked. That shift made many banks re-evaluate their exposure to the crypto industry, even if serving the industry was just a small part of their business. (…)

New York’s Metropolitan Commercial Bank said in January that it was closing its crypto business, citing material changes in the regulatory environment.

In February, Signature Bank cut ties with the international business of Binance, the biggest crypto exchange. (…)