Fed Minutes Show Most Officials Favored Quarter-Point Rate Rise Stronger economic conditions have boosted investors’ expectations for higher rates this year
(…) a few officials favored or would have also agreed to support a half-point increase.
(…) “A number of participants observed that a policy stance that proved to be insufficiently restrictive could halt recent progress in moderating inflationary pressures,” said the minutes of the Jan. 31-Feb. 1 meeting, released Wednesday. (…)
But the minutes suggest a high bar for the Fed to resume half-point rate rises, analysts said Wednesday. (…)
- Via Bloomberg:
(…) “Participants observed that a restrictive policy stance would need to be maintained until the incoming data provided confidence that inflation was on a sustained downward path to 2%, which was likely to take some time,” according to the minutes of the Jan. 31-Feb. 1 gathering released in Washington on Wednesday. (…)
“Participants generally noted that upside risks to the inflation outlook remained a key factor shaping the policy outlook, and that maintaining a restrictive policy stance until inflation is clearly on a path toward 2% is appropriate from a risk-management perspective,” the minutes said. (…)
Following the release of the minutes, swaps traders kept steady their conviction that the Fed will keep pushing rates higher, with the market indicating that 25 basis-point hikes are likely coming at the March, May and June meetings. Investors lifted expectations for where rates will peak to around 5.36%. (…)
But the FOMC met before employment, CPI, PPI and retail sales data changed the picture.
The big repricing in financial markets started with a very strong US employment report for January, which sent interest rate expectations towards the sky. Most US data releases for January have been strong, even suggesting that instead of heading towards a recession, US growth might actually be accelerating.
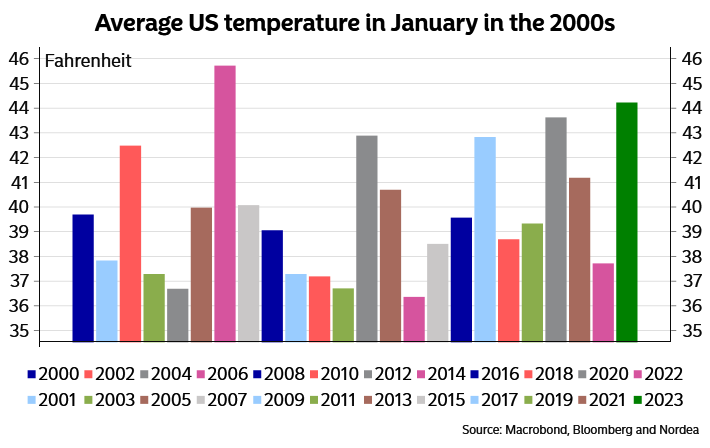
We would refrain from making overly strong conclusions based on only one month of data. For example, the payrolls report is very volatile from month to month, and we know January was an exceptionally warm month. More data are thus needed to draw firmer conclusions. That said, the message we do take from the US January data releases is that despite the weak state of many leading indicators, the US economy is not on the verge of another recession at this point, underlying inflation is not quickly coming down to be in line with the Fed’s target and the case for the Fed to continue to hike rates remains strong.
Financial conditions simply remain too easy compared to the Fed’s attempts to cool the labour market and constrain inflation pressures. Instead of tightening, the higher equity prices, the fall in long rates from their highs last year and the narrower credit spreads mean that financial conditions have eased from their peaks last year, not tightened further.
Given the resilience of the economy to higher rates, we now think short rates will have to rise rather to around 6% than around 5%. Though the risk of 50bp hikes has risen, we think the Fed will prefer to stay on the course of 25bp rate hikes and continue on that path until the September meeting when the target for the fed funds rate will hit 5.75% to 6%.
Our new rate forecast is clearly above current market pricing, and we do not expect the market to quickly price in our rate path. It is quite normal for market pricing to lag in a rate hiking cycle (and in a cutting cycle as well), and the priced-in peak in rates usually moves higher gradually as the central bank hikes rates. This has certainly been the case in this cycle, but it has also been seen many times in previous rate hiking cycles.
January in the US was exceptionally warm, which may have boosted US data releases …
… but financial conditions remain much too easy to rein in inflation (…)
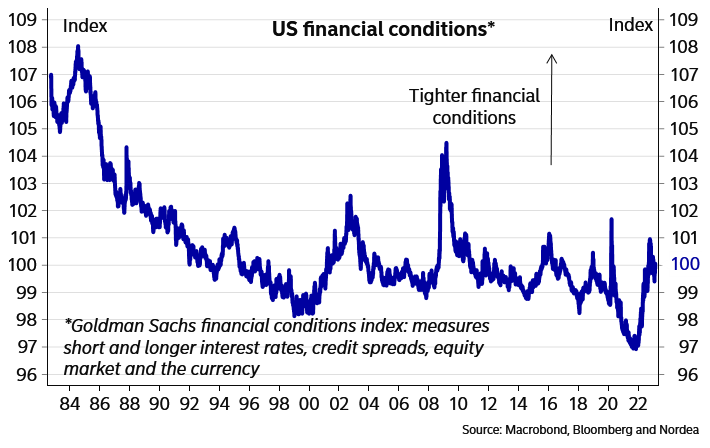
But estimates of financial conditions vary considerably:

NY Fed’s John Williams yesterday:
“At the end of the day our job is clear,” Williams said Wednesday at a conference held at the New York Fed. “Our job is to make sure that we restore price stability which is truly the foundation of a strong economy.” (…)
Williams said strong demand in the US economy continues to exceed supply, pointing to persistent price pressures in the services sector, excluding food, energy and shelter. He also said continued demand for goods, as well as ongoing supply-chain issues in the global economy, may keep prices from falling as quickly as some have expected. (Bloomberg)
 The Fed’s staff yesterday released a paper linking the recent jump in inflation to the sharp increase in goods consumption after the government flooded Americans with Covid dollars.
The COVID-19 pandemic has led to a large, abrupt, and unprecedented increase in the demand for goods relative to services in the United States, interrupting a secular decline in the share of spending on goods. A popular narrative is that this sudden reallocation of demand has strained supply chains, leading to bottlenecks and labor shortages in a number of key sectors, thus contributing to a buildup of inflationary forces. (…)
The share of consumption expenditures on goods rose from 31 percent in the last quarter of 2019 to more than 35 percent by the middle of 2021, and has remained high thereafter. Personal Consumption Expenditures inflation reached almost six percent by the end of 2021, primarily driven by a surge in goods inflation, while services inflation has been more muted. Finally, employment collapsed and rebounded, remaining significantly below the pre-pandemic trend by the end of the sample, driven by a decline in labor market participation. (…)
We find that the demand reallocation shock is able to explain a large portion—3.5 percentage points—of the increase in U.S. inflation post-pandemic. (…)
We then examine the two supply shocks. The first, sectoral productivity shocks, is motivated by the increase in the dispersion of sector-level variables shown in Figure 2. Additionally, some sectors, such as the metals or oil industry, have experienced both significant declines in production and increases in prices, which cannot be explained by demand reallocation alone.
To account for this, we measure the evolution of total factor productivity at the industry level between 2019:Q4 and 2021:Q4, and feed the estimated shocks into our multi-sector model. We find that sectoral productivity shocks dramatically improve the model’s cross-sectional fit, but dampen aggregate inflation, as aggregate productivity rose above trend over this period.
The second shock we consider is a reduction in aggregate labor supply, motivated by the prolonged decline in employment shown in Figure 1. We estimate the magnitude of this shock and find that it explains approximately two-thirds of the post-pandemic decline in employment. However, its effect on inflation is relatively limited: on its own, it would only increase inflation by around 1.5 percentage points, which is less than half the impact of the demand reallocation shock.
When we consider the effect of all three shocks simultaneously, the estimated model can explain the majority of the rise in U.S. inflation between the end of 2019 and the end of 2021, largely driven by the demand reallocation shock. The model also explains a large proportion of the cross-sectional dynamics of prices and quantities: both the demand reallocation shock and the sectoral productivity shocks are important for this finding. The labor supply shock is important for explaining the persistent decline in aggregate employment, but plays a smaller role in explaining aggregate inflation and no role in accounting for the model’s cross-sectional fit. (…)

Tuesday, I posted this chart showing how profit margins, which were “normalizing” after their post GFC spike, jumped along with prices in 2021-22:

Simply stated, the U.S. government’s wide open money spigot during Covid induced a “sudden reallocation of demand”, responsible for 3.5% inflation, at the same time that Covid suddenly reduced the supply of labor, responsible for 1.5% inflation. Higher productivity has contributed to “dampen aggregate inflation” but, in reality, it mainly boosted corporate margins by 50%. Sustainable?

(Societe Generale)
Somebody could build a case for higher corporate income taxes…
While on goods demand:
You may recall the news last week of a blockbuster 3% surge in January’s retail sales, which rippled across global markets. But that report actually showed retailers had $121 billion less in January sales than they did in December — a 16% drop.
The difference is a result of the seasonal adjustment process that is applied to most major data — and right now, it may be sending misleading signals about how the economy is doing at the start of 2023.
A series of hot reads on growth and inflation have sent markets reeling this month. But at least part of that heat appears to come from shifts in seasonal patterns, making this winter’s numbers look gaudier than they are.
There’s little doubt that the economy has gained momentum so far this year, but it’s less clear how much of that is real.
If 2020-21’s pandemic supply shortages caused people to start their holiday shopping earlier than usual, the seasonal adjustment would exaggerate the strength of October’s retail sales number and depress November and December.
It would also make January’s figures look much stronger than the reality, because the falloff in spending from December to January would be less pronounced than seasonal models predict.
That looks to be exactly what happened in last week’s retail data, which after seasonal adjustments was negative in November and December, and then sharply positive in January.
Weather can compound seasonal distortions. In a normal January, frigid temperatures and snowstorms disrupt economic activity in large parts of the country. Seasonal adjustments account for that.
But this has been an uncommonly warm winter, which means seasonal adjustments increase reported activity above and beyond the true underlying trend.
A San Francisco Fed model that adjusts reported jobs numbers for weather effects found the nation would have added around 390,000 jobs in January — not the 517,000 the Labor Department reported — had it not been a warm winter.
“Right now, it’s difficult to ascertain whether COVID-induced consumer behavior changes and business practices are altering seasonal data adjustments, or if the real underlying economic activity is as strong as some recent economic indicators suggest,” said Doug Duncan, chief economist at Fannie Mae. (Axios)

INTO THIN AIR
U.S. Stock Market Climbs to Risky Heights (Morgan Stanley’s Mike Wilson)
Jon Krakauer’s book “Into Thin Air” chronicles one of the deadliest years on Mount Everest, when 12 mountaineers died trying to reach the summit without proper regard for the risks. Everest’s peak is 3,000 feet above the start of the “death zone,” the altitude at which oxygen pressure is insufficient to sustain human life for an extended period. Many fatalities in high-altitude mountaineering occur in the death zone, either directly through loss of vital functions, or indirectly from bad decisions made under stress.
This is a good analogy for where equity investors find themselves today, and where they’ve been many times over the past decade. Either by choice or out of necessity, investors have followed stock prices to dizzying heights as liquidity (the market equivalent of bottled oxygen) allows them to keep climbing. But the oxygen eventually runs out and those who ignore the risks get hurt. Developments over the last few months show how the market got here, and what could be coming next.
This most recent ascent began in October from a much safer place of lower valuations: a price/earnings ratio of 15x, compared to today’s 18.6x, and an equity risk premium of 270 basis points above U.S. Treasuries, compared to today’s 155. The ascent was based on a reasonable narrative that China’s long-awaited reopening was finally about to begin and could provide an offset to the slowing U.S. economy. As a result, this rally was led by more economically sensitive stocks like global industrials, financials and China equities, and it made sense to go along for that stage of the climb.
By December, however, the air started to get thin again with the P/E back to 18x and the equity risk premium down to 225 basis points—indicating that it was time to head back to base camp, by positioning portfolios more defensively.
With the turn of the new year, many investors decided to make another summit attempt, taking an even more dangerous route with the most speculative stocks leading the way. This time, the narrative was that the Fed was finally going to pause its rate hikes at its early February meeting, and even begin cutting rates by the second half of the year as inflation continued to decline.
It was like a shot of oxygen. Investors began to move more quickly and energetically, talking more confidently about a soft landing for the U.S. economy. As stock prices have reached even higher levels, there is now talk of a “no landing” scenario, in which the U.S. economy never slows down. These are the tricks that the death zone plays — we have now reached a P/E ratio and equity risk premium that put us in the thinnest air of the entire liquidity-driven secular bull market that began back in 2009.
Meanwhile, interest rates are likely to keep increasing, with inflation turning back up and a Fed pause now off the table. In fact, additional rate hikes have been priced into market expectations, with the terminal rate expected to reach 5.25%.
Bottom line: The bear market rally that began in October from reasonable prices and low expectations has gone too far, based on an anticipated Fed pause and pivot that aren’t coming anytime soon. Moreover, despite the economic improvements indicated by a strong labor market and resilient consumer spending, the earnings recession has a long way to go.
As the Fed is tightening, financial conditions are continuing to loosen thanks to the liquidity provided by other central banks, China’s reopening and a weaker U.S. dollar. Since October, the global money supply has increased by a staggering $6 trillion, providing the supplemental oxygen investors need to survive in the death zone, and tricking them into thinking they are safer than they really are.
As famous mountaineer Ed Viesturs once said, “getting to the summit is optional, getting down is mandatory.”
Crypto Still Draws Investors Hoping to Strike It Rich
And now the AI craze as ADG relates:
Meanwhile, the recent frenzy surrounding artificial intelligence has duly made its way to the cryptocurrency realm. CoinDesk reports today that “nefarious market participants are attempting to cash in on the ongoing ChatGPT craze in tech circles by issuing fake tokens branded after the AI chatbot despite having no official association with the tool.” Nearly 200 such freshly issued coins are circulating on decentralized exchanges such as Uniswap, digital data firm DEXTools finds.
To wit: one ducat issued on the Ethereum network, which sports some 300 unique holders and $185,000 in trading volumes over the past 24 hours, has rallied some 300% since Sunday to push its market value north of $300 million. “Trading volumes on such fake tokens – and scams in some cases – are a glimpse of the crypto punting dream being alive and well,” CoinDesk concludes.


 Sales of previously owned homes, which make up most of the housing market, fell 0.7% in January from the prior month to a seasonally adjusted annual rate of 4 million, the slowest since October 2010, the National Association of Realtors said Tuesday. January sales fell 36.9% from a year earlier.
 (CalculatedRisk)

