The enemy of knowledge is not ignorance, it’s the illusion of knowledge (Stephen Hawking)

It ain’t what you don’t know that gets you into trouble. It’s what you know for sure that just ain’t so (Mark Twain)

Invest with smart knowledge and objective odds

THE DAILY EDGE: 7 NOVEMBER 2022

Job Market Remains Strong, but Shows Signs of Cooling The October labor report points to an economy that is gradually losing momentum following a torrid stretch of growth last year and earlier this year. The jobless rate rose to 3.7%. Labor-force participation rate fell slightly.

Employers added a seasonally adjusted 261,000 jobs in October, a robust number but the fewest since December 2020, and the unemployment rate rose to 3.7%, the Labor Department said Friday. Wage gains in October ticked up from the previous month. On an annual basis, however, wage increases have eased, a possible sign of loosening in the labor market. (…)

Over the past three months, employers added an average 289,000 jobs a month, down from 539,000 during the same period a year ago. But that is still far more than before the pandemic. In 2019, job gains averaged 164,000 a month. (…)

Average hourly earnings rose 0.4% in October from the previous month, up from 0.3% in September, the Labor Department said. But they slowed on an annual basis, rising 4.7% in October, down from 5% in September. Annual wage gains have been softening steadily since peaking at 5.6% in March but they remain well above where they were before the pandemic. (…)

The share of adults holding or seeking jobs—the labor-force participation rate—fell slightly last month to 62.2% from 62.3%, which could keep the labor market tight. Notably, participation of prime-aged workers, those between the ages of 25 and 54, has fallen for two straight months. (…)

(…) Warehousing and storage companies added more than 400,000 jobs in two years through the end of 2021. (…) It was the fourth straight monthly pullback in payrolls and the largest since the sector lost 75,000 jobs in April 2020 as pandemic lockdowns took hold. (…) “We certainly did not expect that the market was going to come down as rapidly as it did.” (…) Employment in the warehousing and storage sector has fallen by nearly 50,000 jobs since June, according to the BLS data. (…)

There are two separate measures of employment: the Current Population Survey (CPS), also known as the household survey, and the Current Employment Statistics (CES) survey, also known as the payroll or establishment survey. The BLS says that “Both surveys are needed for a complete picture of the labor market”, yet Fed members, and the media, rarely mention the household survey.

The payroll survey estimates the nation’s employment based on responses from a sample of about 400,000 business establishments, which account for about one-third of total nonfarm payroll employment. The payroll survey counts the number of jobs.

The household survey, in contrast, estimates the nation’s employment based on responses from interviews with approximately 60,000 households; the BLS then inflates the survey data by the most recent estimates of the population. The household survey counts the number of employed individuals.

The surveys may differ over short periods but they converge over the longer term.

Since March 2022, however, the readings vary considerably: payroll employment is up 1.6% while household employment is up only 0.1%. Full time employment (from the household survey) is actually down 0.3% during the same period.

fredgraph - 2022-11-07T063744.547

Is this like the recent discrepancies between Gross Domestic Product and initially faster growing Gross Domestic Income which was eventually revised down to reveal an actually slower economy than originally measured by GDI?

Last month, the household survey was much weaker than the payroll survey with a 328k decline in household employment driven by a 489k decline in the important prime-age employment. The BLS household employment measure adjusted to reflect nonfarm payrolls methodology showed an even larger employment decline (-741k).

How useful is that when trying to navigate treacherous waters?

Job Cuts Highest Since February 2021, Up 13% Over September, 48% Over October 2021

U.S.-based employers announced 33,843 job cuts in October a 13% increase from the 29,989 cuts in September. It is 48% higher than the 22,822 cuts announced in the same month last year, according to a report released Thursday from global outplacement and business and executive coaching firm Challenger, Gray & Christmas, Inc.

October saw the highest number of job cuts announced in a single month since February 2021 when 34,531 job cuts were recorded. It is the sixth time this year that cuts were higher in 2022 than in the corresponding month a year earlier. (…)

Announced U.S. Job Cuts data from Challenger, Gray & Christmas Inc. 2021 through November 2022

That said,

  • recent job cut announcements remain substantially lower than in pre-pandemic years.
  • On the other hand, announced hiring plans totalled 659k in the 3 months to October, down from 1085k in 2021.
  • The 12 companies having announced seasonal hiring plans will hire 189k (-25%) fewer workers this year.

Other facts from the NFP report:

  • Growth in aggregate weekly payrolls (employment x hours x wages) averaged 6.4% a.r. in the last 3 months, down from 7.4% and 8.3% in the 2 previous 3-month periods respectively. A clear slowdown. On a YoY basis, real labor income growth is now close to zero (the Oct. CPI is out Thursday).

fredgraph - 2022-11-05T072335.214

  • Employers have not cut hours since June. Average weekly hours are stable in the middle of their normal 2012-2019 range.
  • Employment growth (blue bar) is an ever diminishing contributor to payrolls growth: +2.3% a.r. in the last 3 months following +3.2% and +4.0% in the 2 previous 3-month periods respectively.
  • But wages are not taking off, quite the opposite actually: average hourly earnings (black bar) grew 3.8% a.r. in the last 3 months, after +5.2% in the 3 months previous.

fredgraph - 2022-11-04T145246.689

  • The wage slowdown is visible on this chart:

fredgraph - 2022-11-05T074900.095

Averaging the last 2 months, hourly earnings rose 4.0% a.r., indicative of restraint on the part of business leaders. Indeed, this table of the last 2-month annualized wage growth rates far from suggests we are near a wage/price spiral (number on left is % of total employment, right brackets are YoY):

  •   0.4% Mining & Logging: ……………………….0.2% (3.6%)
  • 10.4% Retail Trade ……………………………… 3.1% (4.2%)
  • 16.1% Education & Health Services: …………. 1.9% (4.4%)
  • 14.7% Professional & Business Services: ……. 4.0% (5.0%)
  •   8.4% Manufacturing: …………………………… 3.7% (3.6%)
  • 10.4% Leisure & Hospitality : …………………… 4.7% (6.5%)
  •   3.7% Other Services: ………………………….. 6.9% (2.7%)
  •   5.0% Construction: …………………………….. 6.2% (5.6%)
  •   4.2% Transportation & Warehousing: ………… 5.1% (6.3%)
  •   5.9% Financial Activities: ……………………… 4.2% (3.8%)
  •   2.0% Information: ……………………………… 2.0% (6.4%)

Seven of the 11 sectors (58% of employment) are growing annualized wages at a slower rate than their YoY trend.

Total Private service-providing employee wages are up 4.8% YoY but 3.9% a.r. in the last 2 months.

But what is good or bad news today? Faster wage growth to offset inflation and keep consumer spending or slower wage growth risking a consumer strike?

The Fed, or at least Mr. Powell, are clearly in the second camp. They (he) might be getting it sooner than later…

What about those large excess savings expected to keep consumers buoyant?

Judging by the recent surge in credit card borrowing, +18.2% YoY at the end of October, many Americans are struggling to pay their bills:

fredgraph - 2022-11-07T054943.912

Holiday spending is expected to be healthy even with recent inflationary challenges, as the National Retail Federation today forecast that holiday retail sales during November and December will grow between 6% and 8% over 2021 to between $942.6 billion and $960.4 billion. Last year’s holiday sales grew 13.5% over 2020 and totaled $889.3 billion, shattering previous records. Holiday retail sales have averaged an increase of 4.9% over the past 10 years, with pandemic spending in recent years accounting for considerable gains.

FYI, CPI-Durable Goods was up 7.6% YoY in Q3. CalculatedRisk uses retail hiring in October to assess Q4 sales: current forecast: +2.75% YoY in Q4.

Summers Sees Risk Fed Needs to Hike Past 6% to Curb Inflation

Real world anecdote:

It feels like the economy is heading off a cliff right now. In our larger portfolio of companies I can see the trajectory. After Q1 board meetings 1/3 were missing their numbers and it felt like the ones missing were related to these specific companies, not a macro trend. After Q2 board meetings 2/3 were missing and after Q3 board meetings, like now, the entire portfolio is re-forecasting. Even the best companies are seeing major headwinds. This is an economy wide-slowdown. (VC investor David Sachs quoted by The Market Ear)

Frackers Say Oil Production Slowing in the Shale Patch U.S. oil-and-gas companies offer little relief for tight global markets

(…) In the contiguous U.S., oil production through August has increased only 3% since December, up 288,000 barrels a day to 9.77 million, according to the Energy Information Administration. It had earlier expected total U.S. oil output—including Alaska and the Gulf of Mexico—to hit 12.64 million by December, growing more than 1 million barrels a day compared with the same month last year. It has since lowered its projection almost 500,000 barrels a day. (…)

Growth forecasts may fall further because many drillers have relied on wells they had previously drilled but left offline for future production, so-called drilled but uncompleted wells, or DUCs. The EIA said companies have tapped most of their best DUCs, after they used the wells to save money on drilling as the pandemic led to a historic oil-price collapse. That trend, combined with a gas-pipeline bottleneck in the Permian, is expected to further constrain U.S. oil production growth, the EIA said. (…)

Canada Rate-Hike Pressure Grows With Wages Up 5% for Fifth Month Average hourly wages rose 5.6% annually in October as the economy added 108,000 jobs, more than 10 times the consensus forecast. Workers in construction, professional services, accommodation and food saw even bigger gains than that.
China’s Exports Drop Sharply as Global Economy Slows The pullback in demand for its goods abroad removes a key prop for China’s growth as its economy is pressured by the government’s zero-Covid strategy and a severe real-estate slump.

(…) Exports from China declined 0.3% last month compared with a year earlier, China’s General Administration of Customs said Monday, the weakest pace of growth since May 2020, when trade was hobbled by countries’ early efforts to contain a worsening global pandemic. That was well below the expectations of economists polled by The Wall Street Journal, who had expected exports to increase 4% year over year.

Monday’s data showed exports to the U.S. fell 13% on the year in October, the third month of decline, while sales to the European Union fell 9%.

The data showed big falls in exports of products including home appliances and medical supplies, and weakening growth in exports of mobile phones and automobiles.

Other bellwether exporters in Asia, such as South Korea and Taiwan, have also reported faltering overseas sales, pointing to a broad slowdown in trade as the global economy loses momentum.

South Korea’s trade ministry said Nov. 1 that exports fell 5.7% in October compared with a year earlier, led by sinking exports of memory chips, petrochemicals and computers. (…)

China’s imports from the rest of the world dropped 0.7% in October from a year earlier, underscoring weak domestic spending in China’s economy. (…)

Will China pivot on Covid-19 lockdowns, given the weakening economy?

That would be untimely just before winter and given these trends (as of Nov. 6):

Image

EARNINGS WATCH

From Refinitiv/IBES:

Through Nov. 4, 428 companies in the S&P 500 Index have reported earnings for Q3 2022. Of these companies, 71.3% reported earnings above analyst expectations and 24.1% reported earnings below analyst expectations. In a typical quarter (since 1994), 66% of companies beat estimates and 20% miss estimates. Over the past four quarters, 78% of companies beat the estimates and 18% missed estimates.

In aggregate, companies are reporting earnings that are 3.5% above estimates, which compares to a long-term (since 1994) average surprise factor of 4.1% and the average surprise factor over the prior four quarters of 7.0%.

Of these companies, 69.6% reported revenue above analyst expectations and 30.4% reported revenue below analyst expectations. In a typical quarter (since 2002), 62% of companies beat estimates and 38% miss estimates. Over the past four quarters, 74% of companies beat the estimates and 26% missed estimates.

In aggregate, companies are reporting revenues that are 1.9% above estimates, which compares to a long-term (since 2002) average surprise factor of 1.2% and the average surprise factor over the prior four quarters of 2.7%.

The estimated earnings growth rate for the S&P 500 for 22Q3 is 4.3% [4.1% on Oct. 7]. If the energy sector is excluded, the growth rate declines to -3.4% [-2.6%].

The estimated revenue growth rate for the S&P 500 for 22Q3 is 11.0% [9.7%]. If the energy sector is excluded, the growth rate declines to 7.7% [6.4%].

The estimated earnings growth rate for the S&P 500 for 22Q4 is 0.4% [5.2%]. If the energy sector is excluded, the growth rate declines to -4.1% [1.3%].

The estimated revenue growth rate for the S&P 500 for 22Q4 is 5.1% [6.9%]. If the energy sector is excluded, the growth rate declines to 3.9% [5.1%].

Ed Yardeni’s data reveal that, as of Nov. 2, 58.1% of S&P 500 companies having reported (344) are showing positive YoY growth, and 39.0% negative YoY growth (worst since Q3’20).

More pre-announcements, all negative, so far vs at the same time last quarter.

image

Interestingly, the number of estimate revisions jumped 50% in the last 2 weeks vs the previous 2 but ups vs downs were about equal…

image

image

…however, the cumulative number of downward revisions is high:

image

In terms of actual YoY growth, the pretty good correlation with the Manufacturing PMI suggests near stagnation for now. In November 2021, S&P 500 EPS were $196. Current trailing EPS: $223.37. Full year 2022: $220.91e (+6.1%). Forward EPS: $227.72e. Full year 2023: $232.64e (+5.3%).

image

Senior White House Official, Putin Aides Involved in Talks on Avoiding Wider War Jake Sullivan has had confidential discussions with Russian counterparts amid concerns over escalation and nuclear threats.

THE DAILY EDGE: 4 NOVEMBER 2022

USA: Service sector output decline gathers pace amid renewed drop in new business

Service sector firms in the US registered a sharper contraction in business activity at the start of the fourth quarter, according to the latest PMI™ data. The fall in output quickened amid a renewed decrease in new orders and weaker client demand. The impact of inflation and dollar strength also dampened foreign demand conditions further.

Companies saw a solid fall in backlogs of work amid a reduction in new business, which in turn drove cost cutting efforts and the near-stagnation of employment at service providers. Weak demand conditions also weighed on business expectations which slumped to the lowest for over two years.

Amid reports of some input costs falling and in an effort to drive new orders, the rate of charge inflation eased to the slowest since December 2020.

The seasonally adjusted final S&P Global US Services PMI Business Activity Index registered 47.8 in October, down from 49.3 in September but higher than the earlier released ‘flash’ estimate of 46.6. The latest data signalled a modest contraction in business activity across the service sector. The decrease in output was commonly linked to lower new orders, with panellists attributing weak client demand to the impact of inflation and interest rates on increased client hesitancy and more frequent order postponements.

image

New business fell back into contraction during October, thereby signalling the third decline in new orders over the last five months. The drop in client demand was only marginal, but was often attributed to postponements or delays in order placement as customers were impacted by higher interest rates and inflation.

With regard to exports, service sector firms recorded a fifth successive decline in new business from abroad. The rate of contraction accelerated to the second-fastest since May 2020 amid weak global demand conditions.

In line with lower new orders and reduced business S&P Global US Services PMI™ requirements, service providers indicated broadly unchanged employment levels at the start of the fourth quarter. A near-stagnation in workforce numbers brought to an end a 27-month sequence of expansion in staffing levels. Although some firms noted efforts to fill previously held vacancies, others stated that voluntary leavers were not replaced.

Despite little change in employment, lower new business inflows and sufficient capacity allowed firms to work through their backlogs during October. The level of outstanding business fell for the fourth time in five months, and at a solid pace.

Meanwhile, cost pressures softened slightly in October. The rate of input price inflation was faster than the series trend, but eased to the slowest since January 2021. Hikes in fuel, supplier and wage costs were linked to the further uptick in expenses, but reports of lower prices for some inputs were behind the slower rise.

In turn, and in an effort to drive new orders, service providers recorded a softer increase in output charges. Although firms continued to note the pass-through of higher costs to clients, some mentioned concessions made to customers. The pace of charge inflation eased for the sixth month running to the slowest since December 2020.

Business confidence across the service sector weakened in October. The outlook for output over the coming year was dampened by concerns regarding inflation and greater customer hesitancy.The degree of optimism remained below the series average and was the lowest since September 2020.

The S&P Global US Composite PMI Output Index posted 48.2 in October, down from 49.5 in September. The fall in business activity was driven by a sharper decline in service sector output, but only modest overall as manufacturing output rose marginally.

image

Driving the decrease in activity was a renewed drop in new business during October. The fall in client demand was broad based, as manufacturers and service providers noted contractions. Dollar strength and inflation weighed on new export orders which fell further.

Rates of input cost and output charge inflation eased across the private sector in October. Reports of reductions in some material costs which were passed through to customers via concessions were cited as factors behind softer inflationary pressures.

Weaker output expectations for the year ahead, alongside a solid fall in backlogs of work, led to a subdued increase in private sector employment. Although manufacturers saw a marginal uptick in workforce numbers, service providers kept staffing levels broadly unchanged.

  • The ISM services index decreased by 2.3pt to 54.4 in October, below expectations for a more moderate decline. The underlying composition was weak, as the business activity (-3.4pt to 55.7), new orders (-4.1pt to 56.5), and employment (-3.9pt to 49.1) components all fell. Unlike in Tuesday’s ISM manufacturing report, price pressures rebounded sequentially in the ISM services report: the supplier deliveries component increased by 2.3pt to 56.2 (nsa) and the prices paid component increased by 2.0pt to 70.7 (sa). The new export orders index dropped by 17.4pt to 47.7 (nsa), the largest decline on record. (GS)
  • Financials category signals sharpest fall in business activity since April 2020

Four out of seven US sectors monitored by S&P Global PMI data recorded lower business activity during October. Financials again posted by far the steepest reduction in activity (index at 35.2), with the downturn accelerating to its fastest since April 2020. Financials has been the worst performing category in each month since June.

image

Consumer Services (index at 47.5) was the second-weakest performing sector in October. Business activity has now fallen for four months in a row, although the latest reduction was the least marked since July. Survey respondents typically commented on falling consumer spending on non-essential services due to intense cost-of-living pressures.

Producers of Consumer Goods also returned to contraction territory in October, although the rate of decline was only fractional and much softer than seen for Consumer Services.

October data indicated a sustained reduction in output across the Basic Materials category, driven by softer demand for manufacturing inputs. The latest fall in production volumes was the steepest since June 2020.

Marginal rates of output expansion were recorded in the Industrials and Healthcare sectors during October, with the latter signalling an increase in activity for the first time since April.

Finally, the Technology sector was the fastest-growing area monitored by the survey during October. Business activity expanded at the quickest pace since May, which continued the turnaround from the downturn seen in August.

Pre-Twitter announcement:

  • Stripe to Cut 14% of Jobs
  • Alphabet said last week that its hires in the fourth quarter would be less than half those of the third quarter.
  • Meta said it would hold its headcount flat at current levels through 2023.
  • Apple has paused hiring for many jobs outside R&D. (Bloomberg)
  • Lyft, the ride-hailing company, is laying off 13% of its staff.
  • Chime, a fintech that relies heavily on spending by millennials, told CNBC that it planned to cut 12% of its 1,300-person workforce.
  • Opendoor slashed 18% of its headcount.
  • Layoffs Hit Tech as Amazon, Lyft Warn of Downturn The outlook for tech industry jobs worsened with ride-hailing company Lyft and payments company Stripe both announcing major layoffs and Amazon saying it will freeze corporate hiring for months.

The outlook for tech industry jobs worsened on Thursday, with ride-hailing company Lyft Inc. LYFT -2.00%decrease; red down pointing triangle and payments company Stripe Inc. both announcing major layoffs and Amazon.com Inc. AMZN -3.06%decrease; red down pointing triangle saying it will freeze corporate hiring for months. (…)

“We’re facing an unusual macroeconomic environment, and want to balance our hiring and investments with being thoughtful about this economy,” Beth Galetti, senior vice president of people experience and technology at Amazon, said in a memo to employees this week. The memo notified them of Amazon’s plan to pause hiring across its corporate workforce, which includes employees in high-profile teams such as Prime Video and grocery. (…)

“Negative productivity can be hidden when everything is going great,” said Mark Stoeckle, chief executive of investment firm Adams Funds. “It is easier to protect your margins when revenues are going up, but when they are stopping or going up slower, then you have to look at where you are spending your money.” (…)

Brian Olsavsky, Amazon’s chief financial officer, last week said company executives have seen signs that consumers are tightening their budgets and that inflation remains high. (…)

U.S. Productivity Rebounded in Q3 But Still Subpar

Nonfarm business sector productivity edged up 0.3% q/q saar (-1.4% y/y) following quarterly declines of 4.1% (not revised) and 5.9% (revised up from -7.4%) in Q2 and Q1, respectively. The Action Economics Forecast Survey had expected a 0.5% quarterly gain. This is the third consecutive decline from a year ago, the first time this has occurred since 1982.

The modest rebound in productivity reflected a 2.8% q/q saar increase in nonfarm business output in Q3 (+1.9% y/y) after a 1.2% decline in Q2. Hours worked rose 2.4% q/q (+3.4% y/y) in Q3 after a 2.9% rise in Q2.

Hourly compensation growth slowed to 3.8% q/q saar (+4.7% y/y) in Q3 from 4.5% in Q2. A historically tight labor market (with openings still well in excess of the number unemployed) continues to put upward pressure on wages. A 3.6% increase has been expected in the Action Economics survey. Despite the elevated growth in compensation, it has failed to keep up with the acceleration in inflation with real compensation per hour falling 1.7% q/q in Q3, though this was an improvement from a 5.5% q/q decline in Q2.

With the slight rebound in productivity and the slowdown in compensation growth, unit labor costs (labor cost per unit of output) also slowed. Unit labor costs increased 3.5% q/q in Q3, down from an 8.9% quarterly surge in Q2. However, the 6.1% y/y increase was still the third highest in the past 40 years, though down markedly from 7.6% on Q2. The Action Economics survey had expected a 4.1% q/q saar gain.

In the manufacturing sector, output per hour fell 1.3% q/q saar in Q3 after having risen 2.9% in Q2 as a 1.9% q/q increase in output was exceeded by a 3.3% rise in hours worked. Hourly compensation increased 2.4%, leading to a 3.8% rise in manufacturing unit labor costs.

fredgraph - 2022-11-04T063345.312

Through October 29, the Chase Card Spending Tracker points to a -0.7% MoM decline in (nominal $) Control Sales.

image

Central banks tightening from all sides (BlacRock)

Rate hikes have consumed the market’s attention this year. And rightly so. Central banks are taking a “whatever it takes” approach to pushing inflation back down to their targets, in our view. (…) Most major central banks aren’t fully acknowledging that hiking enough to tame inflation will cause recessions, as we see it.

There’s another specter looming over markets: balance sheet reductions, or quantitative tightening (QT). Balance sheets have already started to dip this year. Central banks selling or ceasing to buy government bonds could increase the risk of financial dislocations from yield spikes sparking risk asset selloffs.

Bond yields have already jumped markedly this year. U.S., euro area and UK 10-year bond yields have each surged nearly 250 basis points since the start of the year. That’s primarily because markets are expecting higher policy rates. And investors aren’t yet demanding significantly higher compensation, or term premium, for the risk of holding long -term bonds, as we’ve said before.

QT could push up term premium, boosting the structural increase we see ahead as markets price in inflation risk and rate volatility in this new regime.

The process, timing and effects of QT will play out differently across central banks. The Fed trims its balance sheet by letting bonds run off, or reach their maturity date without replacing them, rather than selling them. That process started in June. It’s unclear how long it will continue for, but the trimming of the $9 trillion balance sheet increases the risk of overtightening policy as the Fed keeps up aggressive rate hikes.

A $2.2 trillion drop in the balance sheet over three years would hit bond markets the same as a roughly 30-basis-point hike in a normal scenario – and an 80-basis-point hike in times of crisis, Atlanta Fed research shows.

The U.S. Treasury is looking at potential disruptions to trading liquidity, asking primary bond dealers if it should buy back some less-traded bonds to reduce volatility as liquidity, or the ability to trade, has deteriorated.

Kicking off its QT, the ECB said that in November it would start incentivizing banks to hand back the emergency cash they borrowed and no longer need. Bond runoffs may be in store for next year. QT could widen the differences between the yields for member countries’ bonds. That’s particularly a concern for Italy, given its current account deficit and heavy debt load. The ECB’s anti-fragmentation tool and continued reinvestment of maturing bonds during its pandemic program may stave off some widening of peripheral yield spreads.

This week, the Bank of England (BoE) will become the first major central bank to sell bonds as part of QT, temporarily delayed during the turmoil of the long-term gilt selloff that prompted renewed purchases. The UK episode shows how financial dislocations can cause a delay or pause in QT programs. That may feed perceptions of financial dominance – that central banks have no choice but to keep buying bonds due to market strains.

Our bottom line: We think further, if slower, rate hikes are coming along with QT. QT may add to market strains and reasons why investors start demanding term premium, driving long-term bond yields higher, so we stay underweight DM bonds.

Within an underweight to Treasuries, we prefer short-dated bonds given better returns and less duration risk. We stay underweight DM stocks whose valuations don’t reflect the recession we expect to hit corporate earnings.

BofA Says Rush to Cash Is Now at Fastest Pace Since Pandemic

The asset class had inflows of $62.1 billion in the week through Nov. 2, according to a note from the bank citing EPFR Global data. That’s contributed to $194 billion of inflows into cash since the start of October — the fastest start to a quarter the pandemic roiled markets in the second quarter of 2020. (…)

Among other asset classes, global equity funds saw $6.3 billion of inflows in the week, while nearly $4 billion was pulled from bonds, according to the EPFR data. (…)

Bank of America’s custom bull-and-bear indicator remained at its “extreme bearish” level for a seventh consecutive week, the longest period since the global financial crisis in 2008-2009. The maximum bearish level is often regarded as a contrarian buy signal. (…)

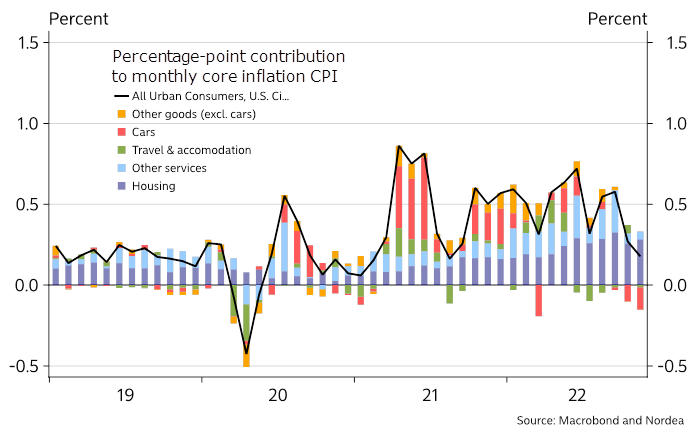
FYI, 2Yr Treasuries are yielding 4.74% this morning, up from 3.2% 3 months ago. Last 6 months: Core CPI: +6.5% annualized but Core PCE inflation: +4.5% annualized.

The Investors Intelligence and the AAII charts on bulls and bears courtesy of Ed Yardeni:

image

image

And this also important chart from the ever useful and generous Ed Yardeni. Note that the 200dma is falling…

image