U.S. Services PMIs
S&P Global: Business activity declines at slower pace amid renewed rise inclient demand
Despite easing, inflationary pressures in terms of firms’ costs and average selling prices for goods and services remain elevated. With companies also reporting staffing issues and rising wages due to very tight labor market conditions, persistent inflation remains a concern at the same time that the economy appears to be struggling to regain momentum.
US service providers signalled a much slower contraction in business activity during September, according to the latest PMI™ data. The fall in output was only marginal overall, as firms noted that improved demand conditions led to a weaker decline. New orders returned to growth, with domestic sales supporting the upturn, as new export business fell further. The rate of job creation softened to the slowest in 2022 to date, however, as challenges finding and retaining staff persisted. Labor and input shortages sparked a renewed rise in backlogs of work. Hopes of greater client demand, a peaking of inflation and investment in new products drove business expectations for the year-ahead to the highest for four months.
Meanwhile, cost pressures eased for the fourth month running amid reports of some reductions in input prices. Softer increases in operating expenses were mirrored in selling prices, which rose at the slowest pace since the end of 2020.
The seasonally adjusted final S&P Global US Services PMI Business Activity Index registered 49.3 in September,up from 43.7 in August, and broadly in line with the earlier released ‘flash’ estimate of 49.2. The latest data indicated only a slight contraction in US service sector business activity, and the slowest in the current three-month sequence of decline. That said, September data rounded off the second-worst performing quarter for the sector since data collection began in 2009.
Supporting the softer fall in output was a renewed rise in new business at the end of the third quarter. Although only slight and below the series average, the upturn was linked to the acquisition of new customers and greater demand from existing clients.
That said, foreign client demand weighed on the overall rise in total sales as new export orders declined for the fourth month running in September. The fall in new orders from abroad was linked to inflation, the strong dollar and challenging economic conditions in key export markets.
At the same time, firms registered slower increases in input costs and output charges during September. Although still historically elevated and linked to greater material, energy and wage expenses, the overall rate of cost inflation was the softest since January 2021. Companies highlighted lower prices for some inputs, especially imported items.
Reflecting efforts to drive new sales and pass on slower increases in input costs, selling prices rose at the weakest pace since December 2020. Despite firms passing on higher costs to clients, a number noted concessions and discounts made to customers to secure orders.
September data indicated only a modest rise in employment at service providers. The rate of job creation was the slowest since December 2021, as firms stated that challenges hiring new staff and difficulties offering high wages to retain certain employees hampered efforts to expand workforce numbers.
Subsequently, service sector firms recorded a renewed increase in backlogs of work. The expansion in the level of outstanding business was the first for four months, albeit only marginal.
Business expectations at service providers strengthened in September, with the degree of confidence in the outlook for activity in the year ahead reaching the highest since May. Hope of greater client demand and reports of investment in new product lines supported optimism.


The ISM:
In September, the Services PMI registered 56.7 percent, 0.2 percentage point lower than August’s reading of 56.9 percent. The Business Activity Index registered 59.1 percent, a decrease of 1.8 percentage points compared to the reading of 60.9 percent in August. The New Orders Index figure of 60.6 percent is 1.2 percentage points lower than the August reading of 61.8 percent. (…)
The Prices Index decreased for the fifth consecutive month in September, down 2.8 percentage points to 68.7 percent. (…)
WHAT RESPONDENTS ARE SAYING
- “Sales at our restaurants seasonally trend down from August to October, and this year seems to be more severe compared to before the pandemic. General inflation concerns and consumer uncertainty are the likely causes, expressed by industry peers as well.” [Accommodation & Food Services]
- “General slowdown in sales. We believe high commodity prices and inflation have impacted consumers’ desire for fertilizer from our turf and ornamental division. Farmers have already cut back on consumption due to pricing and weather-related issues.” [Agriculture, Forestry, Fishing & Hunting]
- “September is one of our slowest months of the year. We are gearing up to have a very busy fourth quarter and are seeing some signs of relief in our supply chain.” [Arts, Entertainment & Recreation]
- “Sales have slowed significantly. Very challenging market. Trying to build through backlog. Manufacturers, distributors and installation trades are still busy and passing on price increases, while we are discounting homes to stimulate sales. Margins are compressing.” [Construction]
- “Due to supply chain issues and inflation, we continue to limit purchases and/or start orders sooner than normal. In the higher education sector, the outlook is good for larger schools.” [Educational Services]
- “Labor pressures continue to depress business activity, as insufficient staffing levels are not allowing the hospital system to operate at capacity. Back orders remain unchanged from a month ago as shortages of raw materials — especially surgical grade Tyvek (synthetic polyethylene fiber), foam and plastics — persist and do not appear to be improving. Logistical lead times have decreased, but the impact on supply chains is limited amid product shortages.” [Health Care & Social Assistance]
- “Hiring continues to be a challenge across most industry sectors. There are far more open roles than candidates to fill them. Due to inflationary concerns, companies are being cautious about hiring direct employees and are attempting to utilize contingent labor. The lack of candidates willing to fill temporary positions is making this strategy difficult to execute.” [Professional, Scientific & Technical Services]
- “Chip shortage shows no signs of abating.” [Retail Trade]
- “Prices of fuel are leveling off (or) dropping in small increments. Still facing supply/demand issues with certain products — food, beverages, some raw construction material and semiconductor chips. Big concern is (China’s) zero-tolerance policy for COVID-19 cases. A lot of companies rely on products from China, and cities keep shutting down due to the policy. This greatly affects the orders outstanding and creates lead time uncertainty.” [Transportation & Warehousing]
- “Business activity has improved over last month but is still trending flat to slightly down versus the same period last year. Inventory levels are starting to fall from record highs, but overstocked items are still a problem. We expect lower demand and inventory rebalancing to impact business activity through the end of the calendar year.” [Wholesale Trade]
 As far as I can remember, this is the first time this cycle that “the strong dollar” is mentioned by survey participants.
ADP Employment Report: Private Sector Employment Increased by 208,000 Jobs in September; Annual Pay was Up 7.8%
Private sector employment increased by 208,000 jobs in September and annual pay was up 7.8% year-over-year, according to the September ADP® National Employment ReportTM produced by the ADP Research Institute® in collaboration with the Stanford Digital Economy Lab (“Stanford Lab”).
- Goods-producing: -29,000
- Service-providing: +237,000
- Median Change in Annual Pay (ADP matched person sample)
Job-Stayers 7.8%
Job-Changers 15.7% - Goods-producing: 7.0-8.0%
- Service-providing: 6.9-11.9%
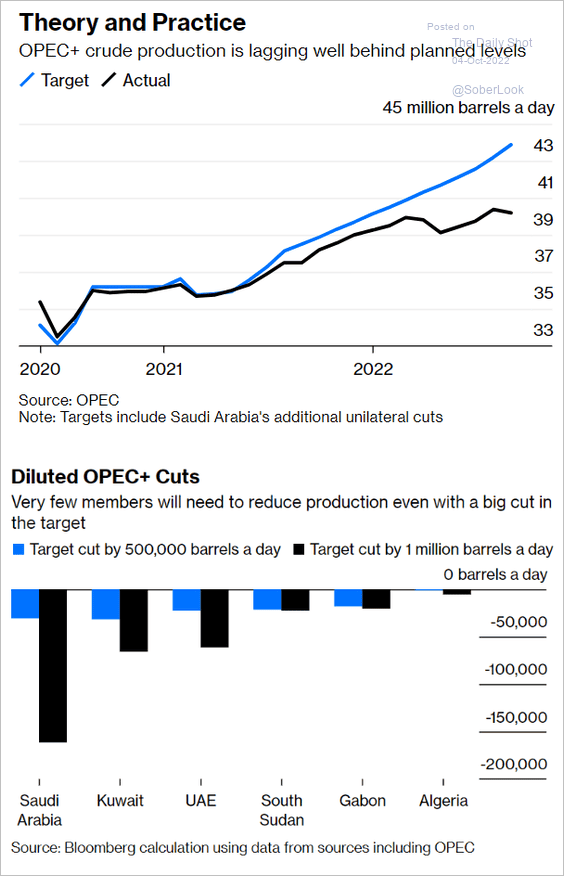
OPEC+ Agrees to Biggest Oil Cut Since Start of Pandemic The move to curb output will likely push up already-high global energy prices and help oil-exporting Russia pay for its war in Ukraine.
(…) OPEC+ delegates said the cut would amount to about 600,000 barrels a day less than what producers are actually pumping now. Energy Aspects, a London research consulting firm, said it could amount to a cut of about 1 million barrels from the group’s daily output, an estimate the Saudi energy minister also gave.
“If we have to do more, we will do more,” said Suhail Al Mazrouei, the energy minister of the United Arab Emirates. (…)
Commercial oil stocks in industrialized nations were down 148 million barrels this summer compared with a year ago and 279 million barrels lower than the latest five-year average, OPEC said in its latest report. The group expects demand for its crude to rise by 900,000 barrels a day next year compared with 2022. (…)
In response, the president directed the release of 10 million barrels of oil from the U.S.’s Strategic Petroleum Reserve, the White House said, a move analysts said would have little impact on prices. Administration officials also said they would consult with Congress on ways to rein in OPEC+’s power over energy prices, which analysts interpreted as a potential sign of support for legislation allowing antitrust action against foreign state-owned oil companies. (…)
The OPEC+ production cut will limit Russia’s loss of market share, said delegates, who acknowledged it represented an unprecedented effort by the world’s biggest oil producers to collectively help Russia with the political and economic problems caused by the war in Ukraine. OPEC states, like many countries of the “Global South,” have remained neutral or silent on Russia’s war, as they weigh competing interests that include Russia’s stature as a global grain exporter and a top armaments supplier.
Speaking to Bloomberg television after the meeting, Russian Deputy Prime Minister Alexander Novak said the cuts were needed to “balance the market out.” He said Russia wouldn’t sell oil to countries that adopt the price cap, predicting an oil-supply deficit this year. (…)
- While the oil cartel has often cut production in the face of weakening demand, it has never implemented a cut in such a tight market. This outcome is therefore surprisingly bullish. Utilizing our framing from Monday October 3, a 2 mb/d headline cut would be an effective 1.2 mb/d cut from our Nov-22 expectations from our 27-Sep-22 balances, and an even larger 1.4 mb/d vs our forward balances, if sustained through 2023. (…) the oil market’s buffers (stocks and spare capacity) remain critically low (…). For now, we raise our 4Q22-1Q22 forecasts conservatively by $10/bbl, to $110/$115 respectively, but acknowledge price risks are skewed potentially even higher. (Goldman Sachs)
- U.S. Looks to Ease Venezuela Sanctions, Enabling Chevron to Pump Oil
(…) Venezuela was once a major oil producer, pumping more than 3.2 million barrels a day during the 1990s, but the state-run industry has collapsed over the past decade because of underinvestment, corruption and mismanagement. (…) Any shift in U.S. policy that brings back Western oil companies would send a psychological signal to the market that more supply is on the way, the people said. (…)
The country is now exporting about 450,000 barrels a day and could double that figure in a matter of months, say people who are familiar with Venezuela’s oil industry and are bullish about its prospects. (…) the country could reach 1.5 million barrels a day of output in two years if Chevron and other companies can work freely. (…)
EARNINGS WATCH
The net percentage of S&P 500 companies that have reduced their sales and EPS guidance is in the 90th percentile (so, many more than usual) but has stabilized recently, said Dennis DeBusschere, founder of 22V Research. Using a natural-language processing tool, earnings sentiment is near recession levels, he said, which is key because how investor emotion shifts as companies post results may help determine the “depth of the slowdown and the risk of a near-term recession.” (22v Research via John Authers)

 Truist Advisory Services via The Daily Shot
Double thrusts have never failed
Yes, there has been a massive thrust over the last couple of days; yes, it has never erred in preceding higher returns.
As we saw in March 2020, the last two days have witnessed overwhelming buying interest. On the NYSE, five times more securities advanced than declined, and ten times more volume flowed into advancing than declining securities.
Even going back to 1928, this is a rare occurrence. We have less confidence in breadth metrics before 1962, especially before 1950, so we’ll limit the lookback to then.
When five times as many securities rose as declined on consecutive sessions, the S&P 500 never suffered a negative one-year return. Even over the next six months, there was only a single small loss. The maximum decline even up to a year later was minuscule on average, though five of them suffered drawdowns larger than -5%. Every signal saw a maximum gain of more than +15% within the following year.
When more than ten times as much volume flowed into advancing versus declining securities, returns were even more consistently positive.
If we combine both studies, the last couple of days has only a few precedents.
Breadth thrusts have been one of the most consistently reliable market developments for decades. Unfortunately, in 2022, we’ve seen several of them fail when they haven’t really before. That’s enough to be a bit suspect of ones triggering now. The last two days have surpassed prior thrusts this year and from a significantly lower level, so perhaps that will be enough to trigger more short-covering initially, then FOMO buying interest. It would be typical for stocks to back off over the next week, but we should not see materially lower prices if this thrust is going to hold.


I don’t mind being the party pooper when there seem to be good reasons to warn people. Of the 10 listed occurrences before 2016 (before QE was in full swing), 8 were when equity valuations were very attractive (average P/E of 9.7 and average Rule of 20 P/E of 14.2 or 29% below fair value). In the other 2 instances (1971 and 1987), valuations were fair (16.9 and 20.3) but inflation was going down and profits were rising.
David Rosenberg seeks to totally crash the party, noting that we have had 26 sessions with +2% advances or more this year.
We had 32 of these in 2008. We had 16 of them in 2001. Nine in 1990 and 12 in 1980. We had 19 of these whippy sessions in 1974, which was one of the worst years ever for the equity market — the year when thousands of brokers left Wall Street to drive a cab. In normal bull markets, we don’t tend to get many of these types of moves, which are purely short-covering rallies and little else. For example, we had the grand total of 3 such sessions in 2021 and just 2 of them in 2019 and both were fantastic years for the equity market. The number of times we have seen such dramatic rebounds in the context of recurring drawdowns to oversold levels is consistent with outright bear markets.
COVID State of Affairs: Oct 5 Here we go again.
The start of a new wave. Eyes are on Western Europe, as hospitalizations are uniformly increasing. As we’ve seen throughout the pandemic, some are hospitalized “with COVID19,” but it’s important to note that the Germany’s numbers are reported purely as “for COVID19.” In other words, not only are infections increasing, but so is severe disease.
Figure by Jean Fisch
Interestingly, no new subvariant is driving this wave, as the majority of cases are still the “old” BA.5 subvariant. This means changing weather, waning immunity, and/or changing behaviors are the culprit. (…)
This is concerning because subvariants are brewing. They only make up a small percentage of cases for now, but they are gaining ground; historically, we feel their impact when they make up ~30-50% of cases. These subvariants will eventually add fuel to the fire.
Currently, we have a “subvariant soup” on the horizon—a mix of many different Omicrons trying to dominate the space. Each subvariant has ~10% growth advantage over BA.5, meaning it has the ability to create a wave, but not a tsunami. (As a comparison, Alpha had a growth advantage of 7%/day; the first Omicron BA.1 had a growth advantage of 25%/day). (…)
Given the U.S. has mirrored European trends throughout the pandemic, a wave in the U.S. is likely coming.
Source: Pandem-ic
On a national level, SARS-CoV-2 wastewater has been decreasing the past two weeks, but that deceleration has started to level off. If we zoom in to specific jurisdictions, like Boston, there are concerning signals with sudden increases in viral wastewater levels. Wastewater will continue to be a huge asset moving forward as an early indicator of transmission in communities. (…)
If we combine five of the top new subvariant leaders in the U.S. (referred to as “Pentagon”), it’s clear that case acceleration is brewing below the surface. Given the current growth, we will likely see an impact on national metrics in mid-November.
The height of a U.S. wave is partially dependent on the number of people who get a fall booster. Unfortunately, it looks like the majority of Americans will be going into the winter ill-prepared. A new Kaiser Family Foundation survey found 40% of Americans are unsure if the booster is recommended for them, including about half of fully vaccinated rural residents (54%), Hispanic adults (51%), and those without a college degree (49%). There is clearly a failure of communication and outreach. This must be a priority as vaccines continue to protect against death, severe disease, transmission, cases, and long COVID-19. So far only 7.6 million Americans have received their fall booster.
We may be in for a bumpy ride this winter. SARS-CoV-2 is already gaining ground thanks to weather and behavior change. We expect growth to accelerate with subvariants on the horizon. There’s a lot you can do, but the lowest hanging fruit is to get your fall booster. Also, if you’re older and test positive, remember Paxlovid.


BTW:

-
Long COVID reality (Axios)
Nearly 24 million U.S. adults have long COVID, and more than 80% of them have some trouble carrying out daily activities, the CDC says.
- Nearly 30% of adults previously infected with COVID reported having long COVID at some point.
- Up to 4 million people are estimated to be out of work because of long COVID symptoms, according to a Brookings report in August.
Nearly three years into a pandemic that has left millions newly disabled, medical researchers remain flummoxed about treating scary lingering symptoms, Axios’ Sabrina Moreno writes.
Long COVID symptoms can include shortness of breath, cognitive difficulties and symptoms that worsen even with minimal physical or mental effort — a primary indicator of chronic fatigue syndrome.
Long COVID is classified as a disability. But qualifying for Social Security benefits requires proof the condition has or will last a year — even though there’s no test to diagnose long COVID.
In a census survey last month, more than one in four adults with long COVID reported significant limitations on day-to-day activities.
The number jumps closer to 40% for respondents who are Black, Latino or disabled — three groups that shouldered outsized burdens throughout the pandemic.
The report confirms that people are developing long COVID symptoms regardless of age, race, gender or previous disability.
As winter months near, an expected rise in cases coupled with fewer COVID protections could mean millions more will get long COVID.

After Mar-a-Lago Search, Talk of ‘Civil War’ Is Flaring Online
Soon after the F.B.I. searched Donald J. Trump’s home in Florida for classified documents, online researchers zeroed in on a worrying trend.
Posts on Twitter that mentioned “civil war” had soared nearly 3,000 percent in just a few hours as Mr. Trump’s supporters blasted the action as a provocation. Similar spikes followed, including on Facebook, Reddit, Telegram, Parler, Gab and Truth Social, Mr. Trump’s social media platform. Mentions of the phrase more than doubled on radio programs and podcasts, as measured by Critical Mention, a media-tracking firm. (…)
While in many cases the term is used only loosely — shorthand for the nation’s intensifying partisan divisions — observers note that the phrase, for some, is far more than a metaphor.
Polling, social media studies and a rise in threats suggest that a growing number of Americans are anticipating, or even welcoming, the possibility of sustained political violence, researchers studying extremism say. What was once the subject of serious discussion only on the political periphery has migrated closer to the mainstream.
But while that trend is clear, there is far less agreement among experts about what it means. (…)
At a Trump rally in Michigan on Saturday night, Representative Marjorie Taylor Greene, a Republican from Georgia, said that “Democrats want Republicans dead,” adding that “Joe Biden has declared every freedom-loving American an enemy of the state.” At a recent fund-raiser, Michael T. Flynn, who briefly served as Mr. Trump’s national security adviser, said that governors had the power to declare war and that “we’re probably going to see that.” (…)
Experts say the steady pattern of bellicose talk has helped normalize the expectation of political violence. (…)


 Amazon Freezes Hiring in Retail Division