FOMC members are preparing markets for a very soft August CPI:
Fed Officials Back Another Large Rate Increase More U.S. central bankers appeared to support raising rates by another 0.75-percentage point later this month to combat inflation, firming up expectations of a third consecutive increase of that size.
In a speech Friday, Fed governor Christopher Waller didn’t specifically say whether he would back a 0.5-point or 0.75-point rate increase, but his remarks strongly suggested he favored the larger one. (…)
“Based on all of the data that we have received since the [Fed’s] last meeting, I believe the policy decision at our next meeting will be straightforward.” (…)
Mr. Waller’s remarks explained why a slowdown in August inflation wouldn’t meaningfully change his near-term outlook. The Labor Department is set to release the consumer-price index for August next week.
He pointed to how a short-term deceleration in inflationary pressures last year, including for so-called core prices that exclude food and energy items, led the central bank to delay plans to withdraw stimulus. Inflation subsequently accelerated.
“The consequences of being fooled by a temporary softening in inflation could be even greater now if another misjudgment damages the Fed’s credibility,” said Mr. Waller. “So until I see a meaningful and persistent moderation of the rise in core prices, I will support taking significant further steps to tighten monetary policy.”
While many forecasters now expect the CPI to show that overall inflation declined last month due to falling fuel prices, [Cleveland Fed’s] Ms. Mester said she was putting less weight on any decline in energy prices because she is concerned prices could turn up again later this year amid a standoff between Russia and Europe. Instead, she said she wanted to see signs that service-sector price pressures, which could more broadly reflect rising wages, were moderating.
“I would welcome a good report on inflation, but I don’t think that one report is going to change my view that we’re just really at a high inflation level, and the risks are that it stays high,” she said. (…)
- San Fran Fed on Sept. 8:
(…) consumption of services is steadily rising back to levels more in line with the pre-pandemic trend. The increase in services consumption has contributed to services price inflation at a rate greater than that during the recovery from the Great Recession or the preceding period in the 2000s. Part of the increase in services inflation is due to the large increase in house prices since the onset of the pandemic, which, as our earlier research shows, spilled over to rent inflation, an important component of the services price index, with a lag. While house price growth has moderated recently, house prices, as of June, are still rising more than 15% year-on-year, which should keep rent inflation high over the medium run, given that the spillovers from house price increases to rent inflation tend to be persistent.
(…) the decline in inflation is expected to be gradual, reflecting the typical persistence in services inflation and lags in the effects of monetary policy. Overall, we expect inflation to be back at 2% by the beginning of 2025.
- From the same San Fran Fed on Sept. 6:
The figure shows that, while inflation expectations (red bars) mattered before the pandemic, they now play a much more prominent role in explaining current wage growth. We estimate that inflation expectations in the earlier period had about a 12% pass-through to wage inflation on average. Since the pandemic, we estimate the average pass-through to be 100%. (…)
Our findings show that, since the pandemic, inflation expectations have been playing a more prominent role in wage-setting dynamics than in the past. Moreover, the influence of inflation expectations is being felt over a longer period of time. The longer inflation and inflation expectations remain elevated, the higher and longer-lasting the pressures on wage growth are likely to be.
The railroads began notifying customers about the service cuts, which are taking place ahead of a possible strike on Sept. 17, Journal of Commerce said, citing a customer advisory from Norfolk Southern Corp. The Association of American Railroads confirmed in a statement Friday that six Class I freight railroads will begin to take steps to “manage and secure” shipments of some hazardous or sensitive materials from Monday.
The railroads began notifying customers about the service cuts, which are taking place ahead of a possible strike on Sept. 17, Journal of Commerce said, citing a customer advisory from Norfolk Southern Corp. The Association of American Railroads confirmed in a statement Friday that six Class I freight railroads will begin to take steps to “manage and secure” shipments of some hazardous or sensitive materials from Monday. (…)
- Inflation Showed Signs of Easing in Several Industries in August Prices fell for gasoline, airfares and lodging, though food and other costs kept climbing
Looking ahead to a government inflation report to be released on Tuesday, many Wall Street analysts estimate the Labor Department’s overall consumer-price index was unchanged or dropped in August from July. If so, it would mark the second straight month of slower inflation since annual inflation surged to a four-decade high in June.
“We are experiencing a slowdown driven by the decline in fuel prices, but there is still significant upward pressure in such important categories as food, household items and healthcare products,” said Alberto Cavallo, a Harvard Business School professor who in 2008 created a “billion price” index that tracked dollar amounts of online consumer transactions. “We are not out of the woods yet.”
Called PriceStats, the price index—which is managed by State Street Global Markets and generally tracks the CPI—fell in August. (…)
Igor Popov, chief economist at Apartment List, which tracks 5.5 million listings around the country, said that the cost of rental housing stabilized in August after surging in earlier months. (…) Mr. Popov said that the slowing surge in household formation is diminishing the demand for rental housing.
“We are past peak rent growth,” he said, although he added it could take time before the stabilization he finds in his measures shows up in national statistics. Moreover, people taking on new leases for the month of August will still experience sticker shock given earlier rent increases, Mr. Popov said. (…)
- U.S. Heat Wave Hits Supermarkets’ Produce Sections Record-high heat in the Western states is hitting the produce industry, damaging crops, shrinking shipments and leaving fewer leafy greens and fruits on supermarket shelves.
US Household Net Worth Falls Most on Record on Slump in Stocks
Household net worth decreased by $6.1 trillion in the April-June period, or 4.1%, after falling about $147 billion in the first quarter, a Fed report showed Friday. The back-to-back quarterly declines pushed the the total down to $143.8 trillion, the lowest in a year. (…)
The Fed’s report also showed household checkable deposits, or the money Americans have in checking, savings and money market accounts, soared to a fresh record of nearly $4.9 trillion. (…)
Consumer credit not including mortgages grew at an 8.51% annual rate in the second quarter, the fastest pace since the end of 2001. Business debt outstanding rose an annualized 7.67%.
Federal debt grew 5.56%, about half the pace of the prior quarter.

- Amazon Sellers See ‘Scary’ Holiday Season as Consumers Pull Back For first time US online sales growth will be in single digits
Many merchants, who sell more than half of the goods on Amazon’s web store, fear they’ll be forced to cut prices to move a mountain of unsold inventory. It’s an abrupt change from the previous two years when sellers scrambled to get enough products into Amazon warehouses to meet pandemic-fueled demand even as chronic shortages let them jack up prices.
This year US online sales will rise just 9.4% to $1 trillion, the first time growth has slipped into the single digits, according to Insider Intelligence, which in June lowered its earlier annual forecast. Spending on Amazon will hit $400 billion, up 9% and slower than the overall industry, the research firm says.
“Consumers don’t seem to be spending much on anything beyond basic necessities, so sellers have to offer discounts and coupons and aggressive marketing, which can be expensive,” said Lesley Hensell, a co-founder of Riverbend Consulting, which advises Amazon sellers. “The fourth quarter looks scary this year.” (…)
Seth Broman, chief revenue officer of Swiftline, which offers loans to online merchants, is turning down more loan applications this year. Rising costs and slower growth has simply made lending sellers money too risky, he said.
“A lot of customers are over-leveraged, and their sales are off,” Broman said. (…)
Canada Sheds Jobs for Third Month, Unemployment Rate Jumps to 5.4%
The economy shed 39,700 jobs last month, Statistics Canada reported on Friday in Ottawa, a surprise negative reading compared to the 15,000 gain anticipated by economists in a Bloomberg survey. (…)
August’s employment drop brought cumulative declines since May to 114,000, suggesting that hiring activities may be moderating. (…)
The average hourly wage rate was up 5.4% from a year ago, compared with 5.2% in both June and July. That’s the fastest increase in records dating to 1997, outside of the pandemic.
Hours worked were unchanged in August, following a decline of 0.5% in July.
Labor force participation rates rose 0.1 percentage points to 64.8%, while the number of Canadians in the labor force grew by 66,000 in August. (…)
-
The details of the report were firmer because a 50k drop in education services employment—which may be related to seasonal distortions—fully explained the decline in employment, and because sequential wage growth was strong. (GS)
European Governments Back Energy-Market Interventions Energy ministers, looking to tamp down soaring electricity and gas prices, supported a plan to cap revenue from non-gas power generation.
At an emergency meeting Friday, ministers asked the European Commission, the European Union’s executive arm, to draft plans to cap the revenue earned by nuclear, renewable and other non-gas producers of electricity, and to redistribute the money to businesses and consumers.
The ministers also want a plan for clawing back some of the profits made by oil-and-gas companies. (…)
Some EU countries want the bloc to cap the price of all gas, but commission officials warn that doing so could jeopardize efforts to secure supplies beyond Russia.
Other measures the ministers supported include help for utilities that are facing a cash crunch and a plan to reduce the bloc’s electricity demand. The commission is expected to present proposals next week. (…)
Europe’s energy market treats electricity like other commodities: The most costly supply needed to meet demand sets the price received by all producers. Gas is now Europe’s most expensive generation fuel and thus sets the price of electricity. European governments want to weaken that link, allowing consumers to pay a price that better reflects lower cost generation from nuclear plants, hydropower, wind turbines and solar panels. (…)
The European Commission, the EU’s executive arm, has floated a cap of €200 a megawatt hour, equivalent to around $200, well under current prices in Western Europe which can rise above €400 a megawatt hour during peak times of use. Officials said the level of the cap and its details would be part of the discussions on Friday and the following weeks.
A French official said it might be better to have different caps on electricity depending on the technology used to generate it. (…)
Another concern is who will decide how the money is used. In some cases, it might not be clear which country’s government should be capturing the additional revenue, or which citizens and businesses should benefit from it.
The commission has been careful to avoid referring to the windfall-revenue plan as a tax because a change in tax policy would require unanimous agreement from countries, according to EU officials and diplomats. Officials believe that the way they have framed the plan would allow it to pass with a qualified majority, which requires the support of 15 of the bloc’s 27 member states representing at least 65% of the total EU population.
EU countries also backed a plan to limit demand for electricity, particularly during peak hours of use, when prices are highest. One draft document describing the proposal, which was produced by the commission and seen by The Wall Street Journal, suggested that each country should work to reduce its overall electricity consumption by at least 10%. Governments should also identify a set of peak price hours and reduce electricity use by an average of at least 5% during those hours, the document said. (…)
(…) Power-market reform is likely necessary in the long run, but embarking on such a complex task to fix this winter’s crunch is risky. The EU’s firefighting response to the eurozone crisis over a decade ago, which failed to deliver a true banking union, is an awkward precedent. (…)
But EU-level action requires national leaders to trust their neighbors and do some things that, while good for the bloc overall, may be unpopular at home—such as keeping Germany’s nuclear power plants open or pumping more gas from Groningen in the Netherlands. Lights may need to go out before European leaders reach the full crisis mode necessary for sweeping changes, and developing good long-term policy during a blackout will be tough.
- European Manufacturers Reel From Russian Gas Shutoff The energy crisis has shut down factories, cooled furnaces and left few businesses untouched. Some factories might never reopen.
Sliding Earnings Estimates Pose Next Test for Markets Analysts have cut earnings growth estimates by the most since the second quarter of 2020.
Analysts have cut their estimates for third-quarter earnings growth by 5.5 percentage points since June 30, according to John Butters, senior earnings analyst at FactSet. (…) S&P 500 companies are still expected to post earnings growth of 3.7% for the third quarter, according to FactSet. That would mark the slowest pace of growth since the third quarter of 2020.
Curiously, Factset’s own chart shows a decline of 6.1% since June 30.

Seven sectors are predicted to report a year-over-year decline in earnings, led by the Communication Services and Financials sectors.
The number of S&P 500 companies that have issued negative EPS guidance for Q3 2022 is lower compared to the last few quarters but higher than the 5-year average. At this point in time, 103 companies in the index have issued EPS guidance for Q3 2022, Of these 103 companies, 63 have issued negative EPS guidance and 40 have issued positive EPS guidance. The number of S&P 500 companies issuing negative EPS guidance for Q3 2022 (63) is lower than the numbers for Q1 2022 (68) and Q2 2022 (72), but higher than the 5-year average (58).
At this point in time, 247 companies in the index have issued EPS guidance for the current fiscal year (FY 2022 or FY 2023). Of these 247 companies, 135 have issued negative EPS guidance and 112 have issued positive EPS guidance. The percentage of companies issuing negative EPS guidance is 55% (135 out of 247).
THE RULE OF 20
“Since 1960, P/Es have trended lower when #inflation is higher. With YoY core PCE now at 4.6% and S&P500 trading at ~19x, we should see stocks fall another 20% by mid-October…if historical seasonals mean anything.” @ScottMinerd
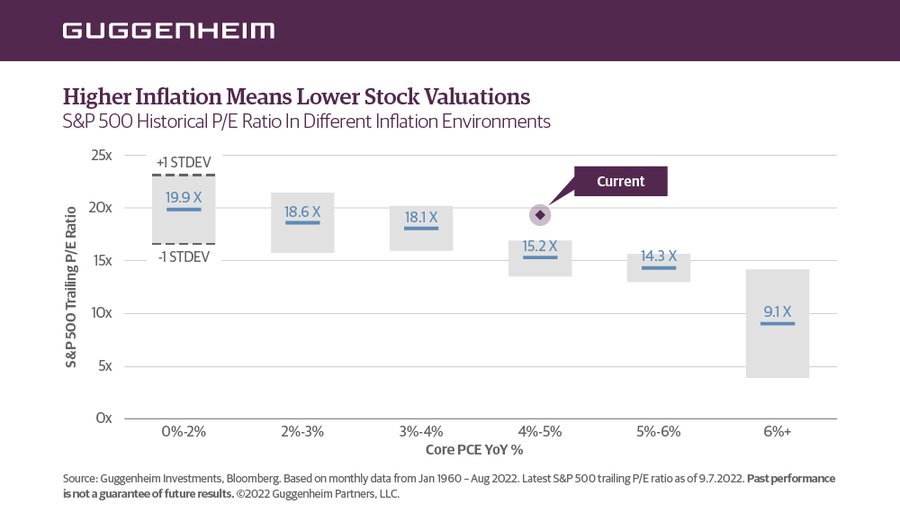
Here’s an easier way to visualize the same:

BofA Says ‘Appalling’ Mood Fuels $11 Billion US Stocks Exodus
The nation’s stock funds had outflows of $10.9 billion in the week to Sept. 7, according to EPFR Global data cited by the bank. The biggest exodus in 11 weeks was led by technology stocks, which saw withdrawals of $1.8 billion. Global equity funds had outflows of $14.5 billion, while $6.1 billion was poured into government and Treasury bonds, the data show. (…)
While equities are still holding up relative to bonds, there have been no monthly flows into stocks over the past half-year, the BofA strategists said. “Bonds hate inflation, equities hate recession” and risk sentiment is “appalling,” they wrote. (…)
BofA’s custom bull-and-bear indicator fell to the zero mark, or “maximum bearish” level, which is often seen as a contrarian buy signal.
In Europe, the exodus of flows continued for a 30th straight week. In terms of equity flows by style factors, US small caps, value, growth and large cap saw redemptions.
- Outflows were concentrated in DM equities, as net selling of US and Western European equities accelerated; global EM benchmarks also saw net selling, though flows into China-dedicated funds remained positive. Most sectors saw net outflows, though they were largest (in dollar terms) in technology, financials, and energy.
-
Flows into global fixed income funds were also negative for a third consecutive week (-$2bn vs -$5bn in the prior week). The net selling was fairly broad-based across categories, though flows into government-only funds remained strong. EM-dedicated fixed income funds continued to see net selling across hard, blend, and local currency funds. Money market fund assets declined by -$4bn.
-
Cross-border FX flows were net negative across regions. Over the past four weeks in G10, AUD and SEK have seen the greatest pullback in flows in z-score terms. (Goldman Sachs)
JPMorgan puts sell sign on emerging market government debt The lender, viewed as one of the world’s most influential investment banks, said the premiums investors demand to hold EM debt rather than ultra-safe U.S. Treasuries could soon balloon out again having improved somewhat recently.
LIQUIDITY MATTERS
CrossBorder Capital focusses on monitoring credit, liquidity conditions & capital flows across the world economies.
- A #liquidity projection from Central Bank statements…

- Same bleak message from #liquidity changes and Goldman FCI @policytensor Watch out?

- From John Burns Real Estate Consulting: While housing starts have been steadily declining since February, our recent survey of more than 500 remodelers shows a slight remodeling decline ahead too. This means that building material demand will almost certainly decline next year at the same time that supply is finally catching up to demand, resulting in building material price stabilization
and labor availability among trades that work in both the new home and remodeling industries. - “A customer who pre-qualified to finance a $160K kitchen project at a lower rate early in the year was turned down when interest rates rose.”
- “Our company relies on clients doing HELOCs [home equity lines of credit]. This has dried up!”
- “Lead volume is decreasing as clients are finding it harder to finance via home equity.”
- “Some customers who had planned on financing or refinancing their homes to pay for jobs, are delaying until they can either save up cash or wait for interest rates to lower.”
- “Cash-out refinances or HELOCs to fund projects have taken a significant hit.”
Here are comments from some of the many remodelers whose large backlogs are starting to thin out.

- Historically most bear markets needed rate cuts to sustainably bottom (and in at least a few instances needed a lot of rate cuts). Something to be mindful of when you consider that the Fed is still talking up further rate hikes, and is likely still a long way off pausing let alone pivoting to cuts.

@Marlin_Capital via Callum Thomas
Zoltan Pozsar Sees a New Dollar Regime. His Longtime Collaborator Disagrees
In Pozsar’s view, the world is fracturing. Deglobalization is already happening. Sanctions have cut Russia off from the dollar-based financial system. Europe no longer has access to cheap gas. The US and its western allies have been pursuing restrictions on technology transfer to China. And in this new period, what matters more than access to dollars is access to commodities and actual things, which Pozsar sees as increasingly being priced in currencies other than the US dollar. As such the dollar “project” (as he characterizes it) is entering a new and rockier phase.
Mehrling’s perspective is that, sure, we’re seeing all kinds of supply chain and commodity dislocations, particularly since the start of the pandemic. But, as he puts it, “I just don’t think they have any implications for the future of the dollar.” (…)
In practice, says Mehrling, the dollar seems to cement its dominance further with each period of extreme stress. (…)
- The dollar is extremely overvalued, similar to 1985. (BCA)
 BCA Research via The Daily Shot
Is a U.S. Civil War on the Horizon?
In a recent response to the FBI’s recovering of classified documents from Donald Trump’s Mar-a-Lago residence, South Carolina senator Lindsey Graham predicted “riots in the streets” if the former president is indicted over his retention of the materials after leaving the White House. There have been rumblings of warning signs from some observers for some time that the U.S. could get dragged into a civil war if it continues on its route of growing political and social division – concerns only amplified in the wake of the January 6 storming of the Capitol.
By now, the impression that a civil war could be brewing has spread to the general public, and as a new Gallup poll indicates, to a large extent. When looking at all adult U.S. citizens responding to the survey, 43 percent said they think that a civil war is at least somewhat likely in their country in the coming decade. As our chart shows, those identifying as ‘strong Democrats’ were slightly more optimistic overall, but 40 percent still held this position. A majority of ‘strong Republicans’ on the other hand said they think civil war is coming – 54 percent.

- In the March 8 WaPo: ‘They are preparing for war’: An expert on civil wars discusses where political extremists are taking this country
Barbara F. Walter, 57, is a political science professor at the University of California at San Diego and the author of “How Civil Wars Start: And How to Stop Them,” which was released in January. (…)
So we actually know a lot about civil wars — how they start, how long they last, why they’re so hard to resolve, how you end them. And we know a lot because since 1946, there have been over 200 major armed conflicts. And for the last 30 years, people have been collecting a lot of data, analyzing the data, looking at patterns. I’ve been one of those people. (…)
And what we saw is that there are lots of patterns at the macro level.
In 1994, the U.S. government put together this Political Instability Task Force. They were interested in trying to predict what countries around the world were going to become unstable, potentially fall apart, experience political violence and civil war.
That was done through the CIA. And the task force was a mix of academics, experts on conflict, and data analysts. And basically what they wanted was: In all of your research, tell us what you think seems to be important. What should we be considering when we’re thinking about the lead-up to civil wars? (…)
And what scholars found was that this anocracy variable was really predictive of a risk for civil war. That full democracies almost never have civil wars. Full autocracies rarely have civil wars. All of the instability and violence is happening in this middle zone. And there’s all sorts of theories why this middle zone is unstable, but one of the big ones is that these governments tend to be weaker.
They’re transitioning to either actually becoming more democratic, and so some of the authoritarian features are loosening up. The military is giving up control. And so it’s easier to organize a challenge. Or, these are democracies that are backsliding, and there’s a sense that these governments are not that legitimate, people are unhappy with these governments. There’s infighting. There’s jockeying for power. And so they’re weak in their own ways. Anyway, that turned out to be highly predictive.
And then the second factor was whether populations in these partial democracies began to organize politically, not around ideology — so, not based on whether you’re a communist or not a communist, or you’re a liberal or a conservative — but where the parties themselves were based almost exclusively around identity: ethnic, religious or racial identity. (…)
The CIA also has a manual on insurgency. (…) And the manual talks about three stages. And the first stage is pre-insurgency. And that’s when you start to have groups beginning to mobilize around a particular grievance. And it’s oftentimes just a handful of individuals who are just deeply unhappy about something. And they begin to articulate those grievances. And they begin to try to grow their membership.
The second stage is called the incipient conflict stage. And that’s when these groups begin to build a military arm. Usually a militia. And they’d start to obtain weapons, and they’d start to get training. And they’ll start to recruit from the ex-military or military and from law enforcement. Or they’ll actually — if there’s a volunteer army, they’ll have members of theirs join the military in order to get not just the training, but also to gather intelligence.
And, again, when the CIA put together this manual, it’s about what they have observed in their experience in the field in other countries. And as you’re reading this, it’s just shocking the parallels. And the second stage, you start to have a few isolated attacks. And in the manual, it says, really the danger in this stage is that governments and citizens aren’t aware that this is happening. And so when an attack occurs, it’s usually just dismissed as an isolated incident, and people are not connecting the dots yet. And because they’re not connecting the dots, the movement is allowed to grow until you have open insurgency, when you start to have a series of consistent attacks, and it becomes impossible to ignore.
And so, again, this is part of the process you see across the board, where the organizers of insurgencies understand that they need to gain experienced soldiers relatively quickly. And one way to do that is to recruit. Here in the United States, because we had a series of long wars in Afghanistan and Iraq and Syria, and now that we’ve withdrawn from them, we’ve had more than 20 years of returning soldiers with experience. And so this creates a ready-made subset of the population that you can recruit from.
(…) the reality is, if we don’t talk about it, [violent extremists] are going to continue to organize, and they’re going to continue to train. There are definitely lots of groups on the far right who want war. They are preparing for war. And not talking about it does not make us safer.
What we’re heading toward is an insurgency, which is a form of a civil war. That is the 21st-century version of a civil war, especially in countries with powerful governments and powerful militaries, which is what the United States is. And it makes sense. An insurgency tends to be much more decentralized, often fought by multiple groups. Sometimes they’re actually competing with each other. Sometimes they coordinate their behavior. They use unconventional tactics. They target infrastructure. They target civilians. They use domestic terror and guerrilla warfare. Hit-and-run raids and bombs.
We’ve already seen this in other countries with powerful militaries, right? The IRA took on the British government. Hamas has taken on the Israeli government. These are two of the most powerful militaries in the world. And they fought for decades. And in the case of Hamas I think we could see a third intifada. And they pursue a similar strategy.
Here it’s called leaderless resistance. And that method of how to defeat a powerful government like the United States is outlined in what people are calling the bible of the far right: “The Turner Diaries,” which is this fictitious account of a civil war against the U.S. government. It lays out how you do this. And one of the things it says is, Do not engage the U.S. military. You know, avoid it at all costs. Go directly to targets around the country that are difficult to defend and disperse yourselves so it’s hard for the government to identify you and infiltrate you and eliminate you entirely. (…)
I think it’s really important for people to understand that countries that have these two factors, who get put on this watch list, have a little bit less than a 4 percent annual risk of civil war. That seems really small, but it’s not. It means that, every year that those two factors continue, the risk increases. (…)
We know the warning signs. And we know that if we strengthen our democracy, and if the Republican Party decides it’s no longer going to be an ethnic faction that’s trying to exclude everybody else, then our risk of civil war will disappear. We know that. And we have time to do it. But you have to know those warning signs in order to feel an impetus to change them.
- Fifty percent (50%) of voters have a favorable impression of the FBI, including 26% who have a Very Favorable view of the bureau. Forty-six percent (46%) now view the FBI unfavorably, including 29% who have a Very Unfavorable impression of the bureau. (Rasmussen Reports)


 The sudden and massive hedging activity of some of the market’s largest traders is unsettling. They have sometimes shown an uncanny ability to buy or sell ahead of significant events in a very short time frame. But the data is too limited to suggest that something is necessarily coming down the pike in the next week or two. More compelling evidence suggests the record put buying is a sign of panic, which has a good track record of preceding rising stock prices over the medium- to long-term.
 Jianzhi Education Technology Group (ticker: JZ) debuted on the Nasdaq Aug. 26 at $126 and traded as high as $186, briefly valuing the outfit north of $11 billion. Less than a fortnight later, JZ settled at $3.99. Earlier in August, investors rolled out the red carpet for the IPO of Hong Kong-based Magic Empire Global Ltd., (ticker: MEGL). After pricing at $4, shares opened at $50 and quickly zipped to $236 to confer a short-lived $4.7 billion market capitalization on the advisory and underwriting firm. The stock now changes hands at $5.11. (ADG)