CONSUMER WATCH
U.K.: “New figures from the Office for National Statistics revealed that 43pc of families are cutting back on their weekly food shop in the face of surging prices, up from 8pc in September 2021. Half of households are reducing their electricity and gas usage and 45pc are reducing their non-essential car journeys.
The deepening cost of living crisis was blamed by statisticians for a 1.6pc month-on-month slide in food sales in May. Overall retail sales dropped 0.5pc last month, while volumes slumped 4.7pc compared to 12 months ago. It was the second monthly fall in a row.” (The Telegraph)
The Telegraph forgot to mention that the gain in April was revised down from +1.4% to +0.4%. Small detail…

In the USA, the Chase card spending tracker reveals that spending at gas stations is up 22% since February 24 while non-recurring spending is flat in nominal terms. Chase’s control sales tracker is down 3.6% MoM through June 18, probably overstating the weakness but weak nonetheless.


This won’t help:
U.S. New Home Sales Rise Unexpectedly in May
Earlier weakness in new home sales stabilized last month, as the job market remained firm. New single-family home sales during May increased 10.7% (-5.9% y/y) to 696,000 units (SAAR) following a 12.0% decline in April to 629,000, revised from 591,000. The increase occurred despite a rise in the average rate on 30-year fixed-rate mortgage loans to 5.23% from 4.98% in April. The Action Economics Forecast Survey expected 592,000 sales in May.
Sales improvement was scattered across the country. Sales in the West surged 39.3% (0.5% y/y) to 202,000 last month following a 20.8% April decline. It was the highest level since January. Sales in the South rose 12.8% (1.5% y/y) to 413,000, the highest level in three months, after falling 7.3% during April. Offsetting these increases, sales in the Northeast declined 51.1% (-42.5% y/y) to 23,000, the lowest level since April 2020. Sales in the Midwest were off 18.3% (-37.0% y/y) to 58,000, the lowest level in six months.
Lower prices helped fuel home sales last month. The median price of a new home in May weakened 1.3% (+15.0% y/y) to $449,000 following a rise to a record $454,000 in April. The average sales price of a new home declined 10.2% (+14.8% y/y) to $511,400 from April’s record $569,500. These sales price data are not seasonally adjusted.
The decline in sales left the market better stocked. The number of unsold new homes increased 1.6% (35.4% y/y) to 444,000, the most since May 2008 and up by roughly one-third y/y. However, the seasonally adjusted months’ supply of new homes for sale fell to 7.7 in May from 8.3 in April. It remained up from a record low of 3.3 months in August 2020. The median number of months a new home stayed on the market fell to a record of 2.4 months. These figures date back to January 1975.


New home sales have been declining for 2 years and are back to pre-pandemic levels. Completions (black) have remained steady but units under construction (red) keep rising and are now 300k units (+55%) higher than in early 2020 and above units sold. Sounds like lower prices ahead.

Harvard U’s “The State of the Nation’s Housing” report for 2022 is just out.
(…) Together with rising interest rates, the strong pipeline of new housing should help to slow the rise in home rices and rents. Even so, new construction adds supply primarily at the upper end of the market. In just the past two years, the share of new homes that sold for at least $400,000 increased from a third of all homes to more than half (56 percent). Meanwhile, the typical asking rent for new multifamily units stood at $1,740 per month in 2021, well above the $1,080 affordable to the median renter.
The investor share of homes sold averaged 28 percent per month in the first quarter of 2022, up from 19 percent a year earlier and well above the 16 percent share averaged in 2017–2019. Investors with large portfolios (at least 100 properties) drove much of this growth, nearly doubling their share of investor purchases from 14 percent in September 2020 to 26 percent in September 2021. (…)
By buying up single-family homes, investors have reduced the already limited supply available to potential owner-occupants, particularly first-time and moderate-income buyers. Indeed, investors are more likely to target lower-priced properties. In September 2021, investors bought 29 percent of the homes sold that were in the bottom third by metro area sales price, compared with 23 percent of homes sold in the top third.


 From John Burns Real Estate Consulting:
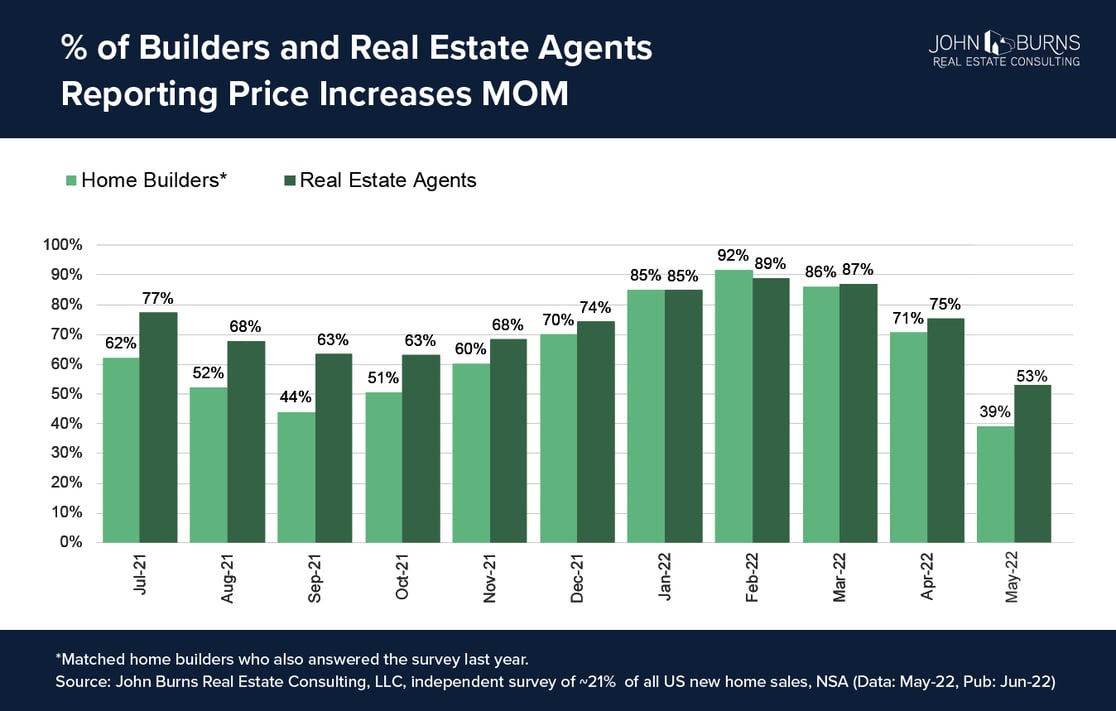
In May, just 39% of home builders expected Good sales in the next six months versus 68% Good ratings in January. Similarly, 46% of resale agents expected Good sales in May vs. 81% Good in January. (…)
In contrast, single-family rental (SFR) operators maintain much more optimism for leasing activity over the next six months. We expect housing demand will shift to renting as households seek relative affordability and flexibility.
74% of the SFR operators surveyed in 1Q22 reported Strong to Very Strong expected leasing in the next six months. Their optimism—paired with strong current leasing ratings, record high occupancy, and rapid lease-up times—point to strength and stability in the single-family rental market, outperforming for-sale demand. The monthly cost of owning a typical 3-bedroom entry home currently exceeds the rental cost for a similar home in most markets by a wider than normal margin.
A flood of capital is waiting to acquire rental homes. While the media sounds the alarm for another 2007/2008 scale housing correction, our thesis is more positive. Plenty of single-family rental capital prepared to buy available new or resale home inventory should limit the extent of home price declines and expand the supply of highly desirable living spaces for renters. Additional single-family rental homes can deliver the space and privacy so many households crave but currently cannot afford through homeownership.
 Bidding Wars Are Coming for Renters Real-estate agents from New York to Chicago and Atlanta say they see more people than ever making offers above asking to lease homes and apartments that they will never own.
(…) Large rental landlords also report having more business than they can handle. “In any given week, we get over 13,000 leads for only 200 homes available,” said Gary Berman, chief executive of Tricon Residential, during a May earnings call.
The median U.S. asking rent passed $2,000 for the first time in May, according to real-estate company Redfin, and it has risen 15% over the past 12 months. If more high-income people enter hot rental markets, and the supply of new homes for them to rent or buy doesn’t substantially increase, rents are poised to keep rising, housing analysts say. (…)
In Chicago, the website Brixbid.com facilitates an influx of people bidding on rent. Landlords start the bidding with a suggested price. Renters then have the choice to lowball them or bid even higher. Some apartments now go 10% to 15% over ask on Brixbid, said company co-founder James Peterson. (…)
US Layoffs, Hiring Freezes Are Tip of Labor Market Slowdown
In the past few weeks, companies have announced tens of thousands of job cuts and plans to freeze hiring. The bulk has come from technology, cryptocurrency and real estate firms big and small, which have laid off at least 37,000 workers since May, according to tech job-listings website TrueUp. Brokerages and banks including JPMorgan Chase & Co. are reducing headcount as the housing market cools.
(…) The country’s second-largest aluminum producer, Century Aluminum Co., said it was laying off about 600 workers. (…)
Manufacturing overtime hours have declined for three months in a row, the longest downward streak since 2015. The four-week average of jobless claims, which is less volatile than the weekly figures, climbed to the highest level since January as more people filed for benefits. And wage growth across the country is cooling. (…)
One nonfinancial-service firm told the Richmond Fed that its plans for hiring and spending are on hold because clients are capping or cutting budgets. Another services company told the Kansas City Fed it too instituted a hiring freeze after sales dropped, adding it’s looking to cut costs. (…)
Copper price at 16-month low as slowdown fears hit industrial metals
 (CMG Wealth)
Central Banks Should Raise Rates Sharply or Risk High-Inflation Era, BIS Warns The Bank for International Settlements cautions that the steps necessary to get inflation under control could raise global economic costs.
The world’s central banks must raise interest rates sharply, even if it significantly hurts growth, the institution known as the central banks’ central bank warned on Sunday. If they don’t, the world risks a 1970s-style inflationary spiral, the Bank for International Settlements said in its annual report. Even if they do, the global economy could face a toxic combination of low or negative growth and high inflation, known as stagflation, it said. (…)
“Gradually raising policy rates at a pace that falls short of inflation increases means falling real interest rates. This is hard to reconcile with the need to keep inflation risks in check,” the BIS said. “Given the extent of the inflationary pressure unleashed over the past year, real policy rates will need to increase significantly in order to moderate demand.” (…)
The Switzerland-based BIS, which acts as a bank and think tank for central banks, drew uncomfortable parallels with the 1970s. Then as now, real policy rates fell far below zero, meaning central banks were stimulating rather than slowing economic activity as inflation surged. (…)
“A modest slowdown may not be enough. Lowering inflation could involve significant output costs, as after the ‘Great Inflation’ of the 1970s,” the BIS wrote. (…)
There are differences to the 1970s, too. Recent commodity-price rises are proportionally smaller, though spread across a broader range of goods, and commodity supply has so far held up better, the BIS said. Major central banks are now independent of governments and have a clear mandate to keep inflation at 2%, neither of which was true in the 1970s. Back then, Fed Chairman Arthur Burns was late to raise interest rates after coming under pressure from President Richard Nixon to keep unemployment low ahead of the 1972 presidential election.
Even so, the path of real rates in advanced economies over the past 12 months bears a striking resemblance to the 1970s, with large declines ahead of an oil-price shock, the BIS said. In most advanced economies, real rates are between 1 and 6 percentage points below their historical range over the past three decades, it said. (…)
The European Central Bank has signaled a gradual series of interest-rate increases from the current level of minus 0.5%. Speaking to European lawmakers this month, ECB President Christine Lagarde said the bank planned to increase interest rates to more normal levels, but not higher. “We certainly are not tightening monetary policy,” Ms. Lagarde said. (…)
In the U.S., wages are rising at an annual rate of about 6.1%, according to the Federal Reserve Bank of Atlanta. In Europe, wages are likely to be rising at an annual rate of 5% by the end of this year, a pace that could be sustained through the end of 2023, according to economists at Deutsche Bank.
“We may be reaching a tipping point, beyond which an inflationary psychology spreads and becomes entrenched,” the BIS wrote. “This would mean a major paradigm shift.”
 Stephanie Pomboy (@spomboy): “The only way for the Fed to avoid the complete deflation of the bubble (it created) and the devastating blowback to the economy that would result is to cut rates aggressively now. That’s not an endorsement. It’s an observation.”
Recession fears are rising and many think we may actually be in recession. The Fed could thus be making a very bad policy mistake tightening aggressively now.
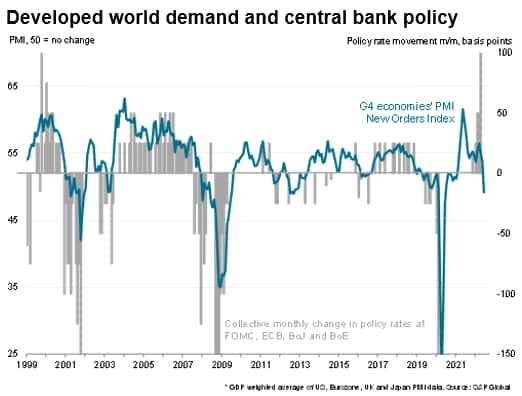
We are in unchartered territory as far as central bank policy is concerned, according to S&P Global’s PMI survey data. The provisional flash PMI data for June covering the US, Eurozone, UK and Japan showed business activity growth slowing sharply as a result of a severe worsening of demand conditions.
New orders in fact fell on aggregate across these major developed economies for the first time since the initial pandemic lockdowns in the second quarter of 2020. However, demand is now falling not because of COVID-19 containment measures, but because the soaring cost of living is hitting just as the economic boost from the reopening of economies from the Omicron wave is starting to fade.
Historical analysis of the surveys’ leading indicators, such as manufacturing orders-to-inventory ratios and companies’ future output expectations, are now consistent with economic contractions in the US and Europe in the third quarter, absent a sudden revival in demand. This, as our chart shows, would be an unprecedented demand environment in which to be hiking interest rates.
But this Fed has made it clear that it is fighting inflation, even at the risk of creating economic pain. And it has decided to act on actual data, facts, which are generally late and lagging indicators.
The weakening PMI data come at a time when central banks have been ratcheting-up their hawkish stances, most notably at the FOMC and ECB and to a lesser extent the Bank of England. Already, the PMIs and their forward-looking components are signalling a high likelihood of third quarter GDP contractions in the US, eurozone and UK. Clearly any further dampening of demand which could result from further policy tightening now runs an increased risk of the slowdown turning into an even steeper economic contraction. (…)
In the U.K. and the Eurozone
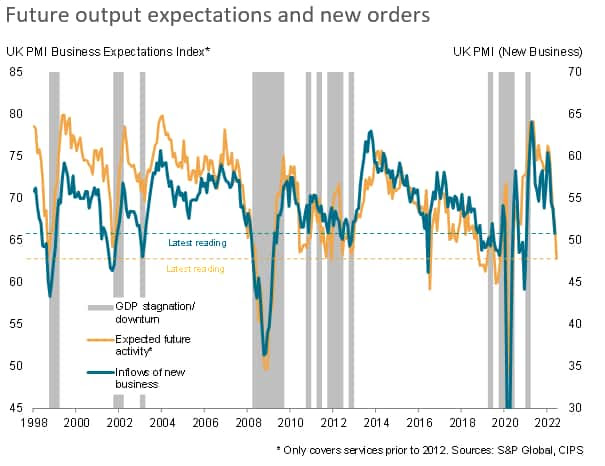
Other forward-looking indicators also point to worsening growth in coming months. In addition to the dearth of new orders, business expectations regarding output in the coming year fell to a degree exceeded only twice in the past decade of survey history. Only the start of the pandemic and the 2016 EU referendum saw bigger falls in sentiment. The latest decline takes business confidence to the lowest since May 2020.
Business prospects darkened amid reports of growing concerns over the cost-of-living crisis, and notably soaring energy costs, as well as higher interest rates, Brexit and slower economic growth both at home and abroad.
Both the new orders and future business expectations survey gauges are now down to levels which have in the past typically heralded an economic contraction, with the future expectations index looking especially low, signalling a heightened risk of imminent recession.

Federal Reserve Bank of St. Louis President James Bullard said fears of a US recession are overblown, as consumers are flush with cash built up during the Covid-19 pandemic and the expansion is in an early stage.
“I actually think we will be fine,” Bullard said in a speech in Zurich Friday. “It is a little early to have this debate about recession probabilities in the US.”
Bullard repeated his call for further “front-loading” of rate hikes to contain inflation. The Federal Open Market Committee raised interest rates by 75 basis points last week and Fed Chair Jerome Powell indicated that either another move of that size, or of half a percentage point, will be on the table when policy makers meet again in late July.
While a growing number of economists have started to predict a US recession, Bullard said “this is in the early stages of the US recovery — or US expansion, we are beyond recovery. It would be unusual to go back into recession at this stage.“
“Interest-rate increases will slow down the economy but will probably slow down to more of a trend pace of growth as opposed to going below trend,” he added in the panel discussion hosted by UBS. “I don’t think this is a huge slowing. I think it is a moderate slowing in the economy.” (…)
“Households seem to be in great position to spend going forward,” he said. “They are flush. They have still $3.5 trillion of kind of Covid aid that is more or less unspent” which is “something on the order of 10% of GDP still sitting in people’s bank accounts.”
The labor market “is very strong,” with about two job openings for every unemployed worker, Bullard said, and nonfarm payrolls are running at a pace higher than normal. “It just doesn’t seem from the household side like you’d be in imminent stages of households pulling back meaningfully.” (…)
Fed leaders seem to be lining up in favor of 75 basis points, with Fed Governor Michelle Bowman Thursday saying she backed raising rates by 75 basis points next month and continuing with hikes of at least 50 basis points after that until price pressures cooled. Governor Christopher Waller on Saturday said that he would support another 75 basis point move in July. (…)
Meanwhile:
- AT&T, Verizon Raise Prices and Test Consumer Budgets Wireless companies have spent the past month boosting fees and raising the cost of some older and midrange wireless plans. Industry executives say that consumers already numbed to surging prices for other necessities might absorb slightly higher rates instead of switching providers or dropping service.
- Tesla, Ford and GM Raise EV Prices as Costs, Demand Grow Auto makers are marking up electric vehicles to offset rising battery-material costs and capitalize on the interest caused by higher gas prices.
- “…inflation is not stopping. It is decelerating on our business, but it is still meaningful in terms of its quarterly rhythm of inflation increasing every quarter. (…) Our ability to pass pricing on to the market as an example, because of inflation, continues to be more challenged, obviously, with consumer demand softening significantly today versus a year ago” – Winnebago Industries (WGO) CEO Michael J. Happe (via The Transcript)
Russian Gas Cuts Threaten World’s Largest Chemicals Hub Dwindling Russian gas supplies are proving a threat to chemicals companies and their disruption would reverberate well beyond the sector, threatening Europe’s economy at a time of high inflation and slowing growth.
(…) The threat isn’t just to BASF and its 39,000 employees in Germany. Because BASF and other chemicals companies sit at the beginning of most industrial supply chains, their disruption would reverberate well beyond the sector, threatening Europe’s economy at a time of high inflation and slowing growth. A throttling of BASF’s ammonia output, a key ingredient in fertilizers, could exacerbate the world’s growing food crisis, analysts say. (…)
U.S. Paying More to Borrow as Fed Raises Rates, Inflation Stays Elevated Interest costs on national debt are up 30% this fiscal year and could increase more.
Government spending on net interest costs in the fiscal year that began last October totaled about $311 billion through May, a nearly 30% increase from the same period a year earlier, according to Treasury Department data. (…)
Treasury officials have said most of the increase in the government’s interest costs so far this fiscal year has been tied to inflation-protected securities, but that further increases will be realized as the average interest rate across government securities rises. The composition of the federal debt over a range of maturities means much of any increase in borrowing costs would unfold gradually, said Phillip Swagel, the CBO’s director. (…)
The U.S. has about $30 trillion in total public debt outstanding. As of late March, about 29% of outstanding marketable Treasury securities were set to mature in one year or less. That debt, when refinanced, would be most affected by increases in interest rates over the short term.
The CBO in May projected that this year, federal spending on net interest costs would reach $399 billion, compared with $352 billion in 2021, and that the yield on the U.S. 10-year note would average 2.4%, up from 1.4% last year.
Interest costs are expected to increase in each fiscal year through 2032 and total roughly $8.1 trillion over the next decade, according to the estimates, which were completed in early March. Since then, Russia’s war in Ukraine has put additional upward pressure on inflation. (…)
According to the CBO’s rules of thumb, if all interest rates, including the average yield on 10-year Treasury notes, are 0.5 percentage point higher this year than in the agency’s baseline projections, spending on net interest costs would be $19 billion higher in fiscal year 2022. If interest rates were 0.5 percentage point higher each year between 2023 and 2032, spending on borrowing costs would be $1.3 trillion higher over the period compared with baseline CBO projections. (…)
EARNINGS WATCH
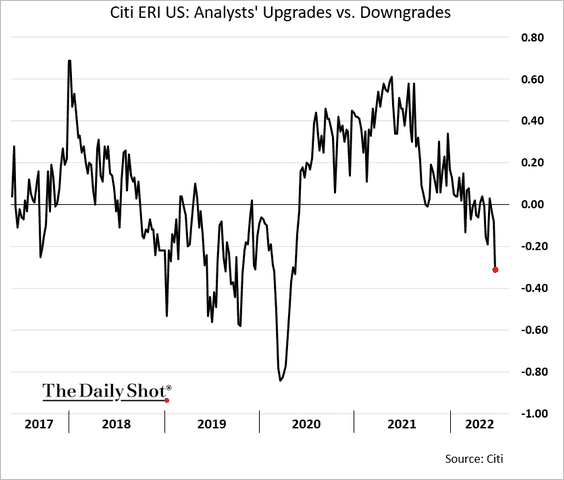
Analysts seem to be getting more concerned…


…but it’s not yet transpiring into aggregate data: Q2 estimates are +5.8% vs +5.6% last week; Q3: +11.4% unchanged, Q4: +11.0% vs +11.2%
Source: The Daily Shot
Wall Street Seen Trapped in a Crushing Bear Market: MLIV Pulse
(…) After succumbing to a bear market, the S&P 500 Index is seen closing 2022 at 3,700. While that’s far lower than the Wall Street consensus, it’s a modest 5% decline from last week’s close — and above the lows already notched this year. Meanwhile, the 10-year Treasury yield is seen edging up to 3.5%. While that would constitute an 11-year high, it’s mercifully lower than the 4% pain threshold set by the likes of Bridgewater Associates. (…)
Headline inflation looks to have peaked, ending the year at 6% even as crude oil stays at multi-year highs, according to respondents. The bad news is that growth may become a more pressing concern than inflation as the year advances. The Pulse poll suggests US unemployment will rise to 4.2% from 3.8% currently.
In survey submissions, respondents were divided on whether a global recession or fresh inflation surprises this year will constitute the most likely shock ahead: Stagflation predictions ranged between 10% and 90%. Several readers also flagged an overly aggressive Fed as a major worry. (…)
The median view of respondents suggests a further 125 basis points of Fed rate hikes is in the cards this year, a full 50 basis points less than market-implied odds last week. While the Bank of England has already raised rates by one percentage point in 2022, respondents expect fresh policy-tightening of that magnitude. The European Central Bank is seen hiking by just 100 bps in total this year. (…)
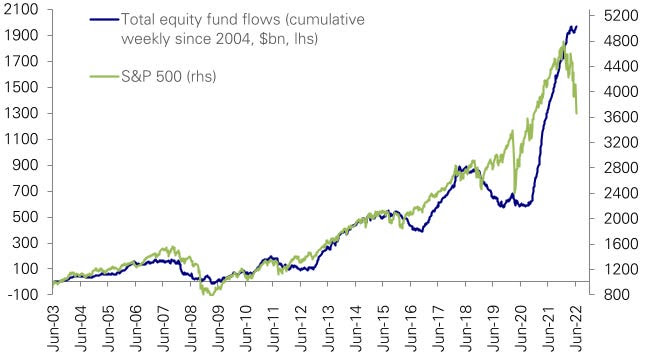
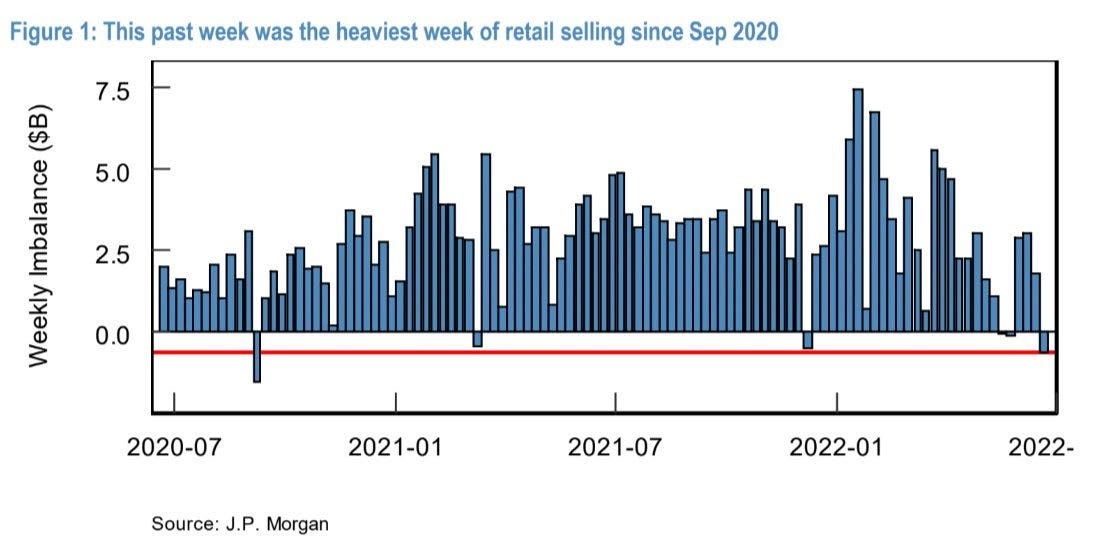
- What Capitulation? But then again, on this metric (cumulative equity fund flows) there doesn’t appear to be much or any capitulation at all… in fact that memeish “DCA“ rallying cry comes to mind.
Source: @GunjanJS
 Source: @SethCL

(GS)
- Bear declines can exceed 40% and include intermediate rallies before reaching a bear market bottom. Michael Kantrowitz, CFA, Chief Investment Strategist at Piper Sandler, shows the bear market rallies of 2000/2002 and 2008/2009 in the below charts. (Horan Capital Advisors)


(CMG Wealth)
A $2 Trillion Free-Fall Rattles Crypto to the Core
(…) What started this year in crypto markets as a “risk-off” bout of selling fueled by a Federal Reserve suddenly determined to rein in excesses has exposed a web of interconnectedness that looks a little like the tangle of derivatives that brought down the global financial system in 2008. As Bitcoin slipped almost 70% from its record high, a panoply of altcoins also plummeted. The collapse of the Terra ecosystem — a much-hyped experiment in decentralized finance — began with its algorithmic stablecoin losing its peg to the US dollar, and ended with a bank run that made $40 billion of tokens virtually worthless. Crypto collateral that seemed valuable enough to support loans one day became deeply discounted or illiquid, putting the fates of a previously invincible hedge fund and several high-profile lenders in doubt.
The seeds that spawned the meltdown — greed, overuse of leverage, a dogmatic belief in “number go up” — aren’t anything new. They’ve been present when virtually every other asset bubble popped. In crypto, though, and particularly at this exact moment, they are landing in a new and still largely unregulated industry all at once, with boundaries blurred and failsafes weakened by a conviction that everyone involved could get rich together. (…)
After crypto’s last two-year hibernation ended in 2020, the sector spiked to around $3 trillion in total assets last November, before plunging to less than $1 trillion. (…)
Celsius Network, Babel Finance and Three Arrows Capital all revealed major troubles as digital-asset prices plunged, triggering a liquidity crunch that ultimately stems from the industry’s interdependence. (…)
“When the Nasdaq bubble burst, our research found that the smart investors got out first and sold as prices went down, whereas individuals bought all the way down and continually lost money. I hope history doesn’t repeat itself, but it often does.” (…)
 California has by far the largest market today, but EV adoption is also growing in some large cities in the Northeast, Florida and Texas. EV ownership remains limited in the Midwest.
- Teslas accounted for 61% of all EVs registered in the U.S. in April, the latest month for which data is available.
- The next closest were Ford (8%), Hyundai (6%) and Kia (6%).

Data: S&P Global Mobility (formerly IHS Markit); Chart: Baidi Wang/Axios
Russia Defaults on Foreign Debt for First Time Since 1918
BioNTech/Pfizer say Omicron-targeting boosters elicit strong immune response
Xi Jinping Is Sending Mixed Messages To Investors If you look at China as a company in distress, the twists and turns in official policy may make more sense.
(…) On Covid-zero, there were two watershed moments. During a trip to Sichuan province in early-June, the president told local officials to “effectively” keep a balance between virus containment and economic stability. He also said he was “very concerned” with young college hopefuls finding work. An estimated record 10.8 million will be graduating into a weak labor market over the next few weeks. At the BRICS Business Forum on Wednesday, the president reiterated the call that China would “strive to meet the economic and social targets for this year.” (…)
On June 14, it was announced that Le Yucheng, a top Russian-speaking diplomat who has frequently stood in for Foreign Minister Wang Yi in recent months, had been appointed deputy director of the National Radio and Television Administration. The decision to remove the pro-Russian Le was seen as a way for Beijing to distance itself from Moscow, whose invasion of Ukraine has been both widely condemned and disastrous for the global economy. (…)
On Wed, President Xi mentioned support for Internet/Platform companies and called for efforts to achieve full year economic targets. National Health Commission announced “Nine Prohibitions“, forbidding local governments to add unauthorized lockdown measures. (…)


 America’s Cash Hoard Could Cushion a Downturn

