Jay Powell warns US recession ‘certainly a possibility’
FLASH PMIs
The U.S. flash PMI is out later this morning. Note how demand for services “slowed sharply” in Europe last month.
Eurozone growth slows sharply to 16-month low in June as demand stalls and price surge continues
The seasonally adjusted S&P Global Eurozone PMI® Composite Output Index fell from 54.8 in May to 51.9 in June, according to the early ‘flash’ reading. While the latest reading indicates an expansion of business activity for the sixteenth straight month, the rate of growth has moderated for two consecutive months to its lowest in the current sequence of expansion.
New orders for goods and services meanwhile stagnated, failing to rise for the first time since the recovery of demand began in March 2021.
Manufacturing led the deterioration, with output falling for the first time in two years. Although only modest in June, the rate of decline of factory output looks set to accelerate in July given a steepening loss of new orders received during the month. New orders for goods have now fallen for two consecutive months, with June seeing the sharpest decline since May 2020.
Growth meanwhile slowed sharply in the service sector, down to its lowest since January to signal a marked deterioration of performance of the sector over the past two months. Inflows of new business in the service sector likewise rose at a much softer pace, with growth down to the second-lowest since the revival of demand began in May of last year.
Looking into further detail within the service sector, June saw the record surge in growth of tourism and recreation enjoyed over April and May falter to a near stand-still. Companies blamed the rising cost of living and a fading of pandemic pent-up demand. The faltering of the consumer rebound in demand for services was accompanied by renewed falls in banking and real estate activity amid tightening financial conditions. Transportation and industrial services growth also slowed, in part reflecting the deteriorating manufacturing environment.
Factory output continued to be constrained by widespread supply shortages, often linked to the Ukraine war and China’s lockdowns, but the overall incidence of delays continued to moderate. Average suppliers’ delivery times consequently lengthened to the least extent since December 2020. However, this easing of supply delays could be in part traced to lower demand for inputs, which stalled in June, contrasting with surging growth seen throughout much of the past two years, in turn linked to the largest build-up of unsold warehouse inventories for over two years.
Overall jobs growth meanwhile moderated to a 13-month low in June as firms in both manufacturing and services scaled back their future expansion plans due to the harsher demand environment and deteriorating outlook.
Business expectations for the year ahead fell to the lowest since October 2020. Manufacturing expectations worsened especially markedly, down to the lowest since May 2020, but future expectations also fell in the service sector to the lowest since October 2020. The gloomier outlook reflected various factors, including headwinds from the rising cost of living, concerns over energy and food supply amid the Ukraine war, tightening financial conditions, ongoing supply chain shortages, often linked to China’s lockdowns, and a broader diminishing of economic growth prospects.
Looking at prices, average charges for goods and services rose sharply again in June. Although the rate of inflation eased further from April’s all-time high to the lowest since February, it remained significantly higher than anything seen prior to the pandemic over the survey’s 25-year history. Rates of selling price inflation cooled in both manufacturing and services.
Input cost inflation also eased slightly, down for a third successive month, yet remained the fourth-highest recorded since comparable data were first available in 1998. Companies again reported upward cost pressures from energy prices, transportation, broad supplier-driven price hikes and rising wage pressures. There was a divergence by sector, however, with manufacturing reporting the weakest input cost rise since March 2021 while the service sector saw the rate of increase accelerate to the steepest since April, in part reflecting the pass-through of prior raw material and energy cost increases to wages.
Looking across the region, Germany reported the slowest expansion, with growth moderating sharply to the weakest since the marginal contraction seen last December, reflecting a renewed downturn of manufacturing output and slower service sector growth. Germany also notably reported a stronger rate of increase of input costs, linked to a record rise in the service sector.
While growth in France outpaced that of Germany, it nevertheless fell sharply to the slowest since January. An especially sharp fall in French manufacturing output was accompanied by much-reduced service sector growth.
Output growth across the rest of the eurozone as a whole meanwhile also slowed further from April’s recent peak, down to the lowest since January, thanks to a near-stalling of manufacturing output growth and the weakest service sector expansion in five months.


|
Chris Williamson, Chief Business Economist at S&P Global Market Intelligence said:
|
(…) Demand conditions remained subdued in June, with new order growth slowing for the fourth month running and to a greater extent than seen during May. (…)
The seasonally adjusted index measuring new order volumes across the UK private sector as a whole dropped from 53.8 in May to 50.8 in June, which signalled only a marginal overall expansion and the weakest rate of growth since the recovery began in March 2021. Manufacturing order books were particularly subdued, with this index slightly below the 50.0 no-change threshold and pointing to the weakest performance for two years. UK private sector firms cited hesitancy among clients and squeezed budgets due to rising inflation as key factors holding back demand. (…)
Strong wage pressures added to cost burdens at private sector companies in June. (…)
Exceptionally strong cost pressures resulted in a steep increase in average prices charged in June. The rate of output charge inflation eased to its lowest since February, but remained higher than at any other time in the past two decades. The need to pass on higher energy, fuel and wage costs to customers was widely reported by manufacturers and service providers alike in June. (…)
Japan: Strongest rise in private sector output in seven months
The headline au Jibun Bank Flash Japan Manufacturing Purchasing Managers’ Index™ (PMI)® eased slightly from 53.3 in May to 52.7 in June, signalling a moderate improvement in operating conditions that was nonetheless the joint-softest since last September. Output rose at the slowest rate in the current four-month sequence of growth while new orders contracted for the first time in nine months. Panel members associated weaker demand to the impact of COVID-19 restrictions in mainland China, which placed additional pressure on supply chains. A further marked lengthening of delivery times exacerbated material shortages and contributed to a sustained, rapid rise in cost burdens that were increasingly passed to clients through a record increase in factory gate prices.
At 54.2 in June, the au Jibun Bank Flash Japan Services Business Activity Index rose from 52.6 in May to indicate the strongest expansion since October 2013 amid the lifting of remaining COVID-19 restrictions on international visitors. At the same time, new business rose at a moderate pace for the second successive month as demand conditions were bolstered by the resumption of activity in the tourism sector. That said, the services sector was not immune to inflationary pressures as businesses recorded a fresh series record increase in input prices. This contributed to an accelerated rise in output prices, which rose at the strongest rate since October 2019.


Germany Warns of Lehman-Like Contagion From Russian Gas Squeeze
(…) With energy suppliers piling up losses by being forced to cover volumes at high prices, there risks a spillover effect for local utilities and their customers, including consumers and businesses, Economy Minister Robert Habeck said Thursday after raising the country’s gas risk level to the second-highest “alarm” phase.
“If this minus gets so big that they can’t carry it anymore, the whole market is in danger of collapsing at some point,” Habeck said at a press conference in Berlin that was called at short notice. “So a Lehman effect in the energy system.” (…)
Habeck said it’s also a signal to Europe to cut energy consumption, talks are planned with partners in the coming days.
The alert stage also gives the government an option of enacting legislation to allow energy companies to pass on cost increases to homes and businesses. Habeck said he was holding off on price adjustments for now to see how the market reacts.
“It will be a rocky road that we have to travel as a country,” he said. “Even if we don’t feel it yet, we are in a gas crisis.” (…)
The crisis has spilled far beyond Germany, with 12 European Union member states affected and 10 issuing an early warning under gas security regulation, Frans Timmermans, the European Union’s climate chief, said in a speech to the European Parliament. (…)
Habeck, who is also vice chancellor, said Russia’s move to cut gas deliveries through the Nord Stream pipeline makes it all but impossible to secure sufficient gas reserves for the winter without additional measures. (…)
(…) The world’s biggest hedge fund firm disclosed short bets against 28 companies that include individual wagers of more than $500 million against ASML Holding NV, TotalEnergies SE, Sanofi and SAP SE, according to data compiled by Bloomberg. The total bet is up from $5.7 billion against 18 firms last week, the data shows. (…)
The current wagers are the highest since the firm built a $14 billion position against European companies in 2020 and before that, a $22 billion bet in 2018. The total may be even greater since hedge funds are only required to disclose their biggest bets.
SURVEY SAYS
From the Conference Board’s C-Suite Outlook midyear survey, conducted between May 10 and 24:
Fifty-eight percent of CEOs and 40% of CFOs see a recession in 2022. In fact, 27% of CEOs and nearly 20% of CFOs say that we are already in recession.


Data: FactSet; Chart: Axios Visuals
Apartment List National Rent Report
Rent growth accelerated slightly again this month, with our national index up by 1.2 percent over the course of May, the largest monthly increase of the year. So far this year, rents are growing more slowly than they did in 2021, but faster than the growth we observed in the years immediately preceding the pandemic. Over the first five months of 2022, rents have increased by a total of 3.9 percent, compared to an increase of 6.1 percent over the same months of 2021. Year-over-year rent growth currently stands at a staggering 15.3 percent, but is down slightly from a peak of 17.8 percent at the start of the year.
On the supply side, our national vacancy index ticked up slightly again this month, continuing a streak of gradual easing dating back to last fall. Our vacancy index now stands at 5 percent, up from a low of 4.1 percent, but remains well below the pre-pandemic norm. Rents increased this month in 96 of the nation’s 100 largest cities, though 70 of these cities have seen slower rent growth in 2022 so far than they did last year, and some of the hottest Sun Belt markets are finally showing signs of plateauing growth.


A city resident needs to make a salary of $110,000 to afford the median asking rent of $2,750 for available apartments, meaning putting no more than 30% of one’s gross income toward housing, according to a recent report by the New York City Department of Housing Preservation and Development. Roughly 23% of full-time workers in New York had six-figure salaries as of 2020. (…)
The median rent in Manhattan soared to an eye-popping $4,000 for new leases on market-rate apartments in May, a 25% year-over-year increase. In addition, there’s a hike coming for residents of New York’s roughly 1 million rent-stabilized apartments. (…)
Nordea:
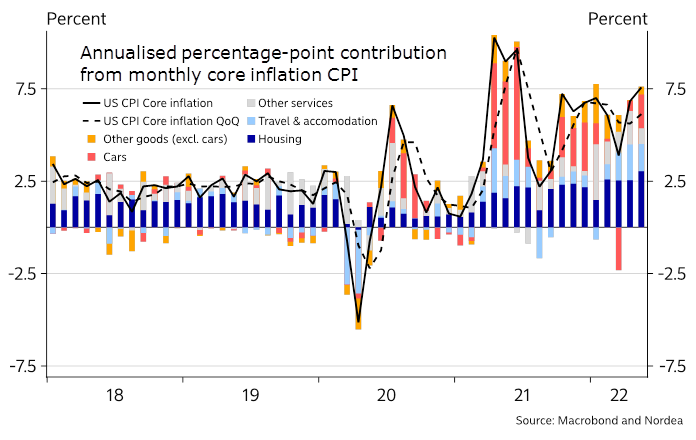
(…) Core inflation is not getting any better either. Today’s inflation problem began as a surge in goods during the pandemic, fuelled by stimulus checks and lockdowns, but it has now turned into sticky and broad-based services inflation. Prices of components related to housing have the largest weight in the index and are currently rising by 0.6% on a monthly basis. The BLS assimilates changes in these components with a lag, which means that we see these components rising to around 0.7% on a monthly basis and keeping inflation elevated for the next many months. Moreover, the reopening of the economy and the shift back to spending on services rather than goods is likely to push overall services inflation higher – particularly services related to travel and leisure.
Core inflation offers no real relief to the Fed
But Nordea remains hopeful on the consumer:
Strong household balance sheets. Households’ balance sheets have changed dramatically. Of particular importance, the low- and middle-income groups have historically high savings to buffer against rising inflation and borrowing costs. In addition, during the pandemic, households have repaid debt and cut down liabilities, while both financial and non-financial assets have soared – even when considering this year’s decline in financial assets. We suspect households will be more resilient to inflation and interest rates than usual as they can dip into these savings.
 Wealth destruction has been massive in this cycle, which is likely to create a drag on consumption.

Source: BCA Research via The Daily Shot

Source: @hedgopia

There is clearly a reverse wealth effect underway…
And fixed income has not been the usual buffer, has it?

BTW: Notice the yellow line:

Data: Morning Consult/Axios Inequality Index; Chart: Axios Visuals
Canada’s Inflation Surge Continues, Boosting Expectations for Big Rate Rise Annual inflation in Canada accelerated in May toward 8%, reaching a nearly four-decade high and all but locking in market expectations that the country’s central bank will raise rates by three quarters of a percentage point in July.
(…) Canada’s consumer-price index in May increased 7.7% from a year ago, Statistics Canada said Wednesday, after a 6.8% gain in the previous month. The May report eclipsed market expectations for a 7.3% rise, according to economists at the Bank of Nova Scotia. A 48% surge in gasoline prices helped drive inflation to its highest level since January 1983, while the cost of groceries and shelter remained elevated. Nearly three quarters of the goods and services tracked by Canada’s CPI rose 3% or higher in May. (…)
Earlier Wednesday, the U.K. reported a four-decade high in inflation for May, as that country’s CPI increased 9.1%.
Even excluding prices for energy and food, which have escalated since the war in Ukraine, annual inflation in Canada remains in the 5% range. For instance, the average of the Bank of Canada’s preferred measures for underlying core inflation in May rose to a record 4.73%, up from a revised 4.43% in the previous month. (…)
On June 1, the Bank of Canada lifted its policy rate by a half-percentage point to 1.5%, the second consecutive half-point increase. Along with its decision, officials signaled it would consider a rate rise bigger than a half point to tame price increases and anchor inflation expectations. Economists and traders started leaning toward a three-quarter-point increase at the Bank of Canada’s next decision date, on July 13, and those views were solidified after the Federal Reserve raised interest rates by 0.75 point last week. (…)
The Bank of Canada judges the neutral rate to be between 2% and 3%.
May’s rise in inflation “is an unwelcome number,” Carolyn Rogers, the Bank of Canada’s No. 2 official, said Wednesday at an event in Toronto. She added that the central bank anticipated inflation would accelerate in the near term.
The inflation data are “keeping us up at night,” Ms. Rogers said, “and that’s why we’re raising interest rates and we’re raising them quite aggressively.” (…)
Canada Posts Fastest First-Quarter Gain in Population Since 1990 The number of people living in Canada rose by 0.3%, or 127,978, to 38.7 million in the first three months of 2022, according to Statistics Canada estimates released Wednesday in Ottawa.
(…) The majority of the gains came from international migration, which remains driver of population and labor growth in Canada. The country welcomed 113,699 immigrants in the first quarter, the highest number in any first quarter since quarterly data became available in 1946. (…)
Prime Minister Justin Trudeau’s government has set an ambitious plan to bring in more than 1.3 million newcomers over the next three years to support the country’s post-pandemic growth. Last year, Canada welcomed more than 405,000 new residents, the largest single-year increase in its history. (…)
Musk Calls Tesla’s Factories ‘Gigantic Money Furnaces’ The electric-car maker’s plants in Germany and Texas are losing billions of dollars, CEO Elon Musk said.
(…) Tesla has faced several setbacks in recent months, including higher supplier and logistics costs amid soaring inflation. Governmental Covid-19 restrictions in China also curtailed output at the company’s plant in Shanghai, which had been its largest by volume.
Tesla this spring launched deliveries of Model Y compact sport-utility vehicles made at its newest plants, but ramping up output from those facilities has proven difficult, Mr. Musk said. He cited battery supply as a key bottleneck.
“Berlin and Austin are losing billions of dollars right now because there’s a ton of expense and hardly any output,” Mr. Musk said. (…)
Given the shift away from goods and excessive goods inventories throughout the system, Western manufacturers could be saying the same shortly.
 Crypto looks like something very nasty happening in slow mo. But like Hemmingway once said, things can “happen gradually, then suddenly”…
Crypto Broker Says Three Arrows Capital Hasn’t Repaid $666 Million in Loans
- Crypto Fund Three Arrows’ Troubles Spill Over to Exchange Other lenders, including Genesis and BlockFi Inc., have sought to quell fear amid concerns over contagion risks from Three Arrows. On Tuesday, BlockFi said it received a $250 million credit line from FTX Trading Ltd.
- Do Kwon’s Crypto Empire Fell in a $40 Billion Crash. He’s Got a New Coin for You. The South Korean entrepreneur’s cryptocurrency empire collapsed last month. Now, despite angry investors and government investigations, he is attempting a comeback.
 DeFi-ning Smart Contract Risk
Interesting Odd Lots piece from Bloomberg’s Joe Weisenthal and Tracy Alloway. Remembering 1987!
(…) DeFi came with a similar promise: the potential to earn big yields by lending money to unknown parties using blockchain-based contracts.
In order to make this happen, DeFi typically depends on vast reams of collateral; asking for extra protection in the form of additional assets is one way to make up for the risk of not knowing who you’re dealing with.
You can see just how much collateral in the below charts from a paper released by the Bank for International Settlements this week. It shows collateralization rates on the biggest Defi platforms typically ranging from 120% to 150%. (By contrast, overcollateralization in traditional banking — like the repo market — is something like 102% for a US Treasury).
“Whereas financial intermediaries have, throughout history, focused on improving information processing, DeFi lending in its current form has reversed this trend and tries to perform intermediation without gathering information,” the BIS says. “Instead, it requires borrowers to post collateral.”
So far from solving the problem of “trust,” lots of blockchain-based Defi protocols simply obscured it through the use of overcollateralization. But perversely, that safety net of extra “security” means that when prices start plunging (as they have been) positions can be strained very quickly.
That’s one reason why blow-ups are coming so thick and so fast, with crypto market participants including Celsius, Three Arrows and Babel all coming under stress just this week. As asset prices go down, the value of the collateral underpinning a web of DeFi transactions declines, and that leads to margin calls, liquidation, and eventually, prices falling even more.
In an environment where prices keep falling, smart contracts on overcollateralized positions can add to the volatility, rather than smooth it.
“When a smart contract acts as the liquidating agent in a volatile deleveraging crisis, the lending protocol is acting somewhat similarly to the portfolio-insurance products that amplified the 1987 crash, but executed automatically and programmatically,” explains Michael Breitenbach, a former director at Bank of America Corp.
Of course, this cycle is extremely familiar to anyone in the traditional finance world. Even the most respected, seemingly “safe” institutions get margin calls, or calls to post more collateral.
One of the pivotal moments in the Great Financial Crisis was in the summer of 2007, over a year before Lehman, when Goldman asked AIG to post more collateral on credit default swaps that it had purchased from AIG Financial Products. It was one of the earliest salvos, wherein we saw more and more established institutions demanding cash from their counterparties. And Lehman’s collapse was ultimately preceded by a massive collateral crunch of subprime securities in the repo market.
But the Great Financial Crisis ultimately ended, thanks to two things. One was the Federal Reserve stepping up in its lender of last resort functions, with its alphabet soup of a programs designed to backstop the market. And then the other thing is that at the end of the day, there were some real assets of value to someone, regardless of the cycle.
A bank with actual clients and branches and a loan book is a real asset that might be of value to someone like Warren Buffett. Houses, even in 2008 and 2009, are assets that have some actual real world value to them, because people need somewhere to live.
This all raises the question of what curbs this decline in crypto? And here we come back to one of crypto’s founding principles. There’s no lender of last resort with an unlimited balance sheet that can backstop the whole thing. The closest the industry has ever had to anything like that are the various megawhales that have come in to do the occasional bail-in, when some protocol would get hacked or whatnot (see Axie Infinity back in April). In the recent rout, we’ve seen more calls for them to step in.
But even the richest private sector players have a finite balance sheet. And of course, the appetite to rescue failing entities diminishes in a bear market, when everything is falling apart at once, and when there isn’t much of an incentive to keep it all going with daily fees.
And then also, in this cycle, there wasn’t much that got built that is of obvious permanent value, the way a house is something of obvious value. That’s not to say there aren’t interesting things having been developed, but even the most novel protocols — like automated market makers or DeFi lending platforms mentioned above — mostly existed to facilitate further speculation, which is the very thing that’s going away in the broad bear market for risk assets (not just crypto). (…)
Between the lack of real innovation, the absence of an emergency lender and few cash flow-producing assets, it’s hard to know what curbs the decline.
And we are now reading that some crypto problems are “solved” by other crypto players stepping in with “investments” or crypto loans in a “saving-me-saves-you” kind of deal… Who’s going to hold the bag at the end of the waterfalls?
BA.4/5 is sweeping the globe
Omicron variant, BA.4/5, is gaining traction, causing case, hospitalization, and death curves to trend upwards in many countries. This variant was first detected in South Africa in early 2022 and caught our attention because it had several mutations on the spike protein. Two mutations in particular, called L452R and F486V, caught our attention because we had seen them on previous variants of concern. Recent lab and epidemiological data show BA.4/5 to be driving this wave, in part due to reinfections and infections after vaccination.
In the lab, we see that Omicron is getting better at escaping our first line of defense—neutralizing antibodies. (…) among recently boosted, BA.4/5 does not fully escape immunity. This means, in the short-term, boosters help prevent infection and thus transmission.
Other lab studies show Omicron escapes infection-induced immunity, too. We are particularly worried about recent BA.1/2 infections (first Omicron waves). Data from South Africa found immune escape more pronounced among unvaccinated compared to vaccinated (not boosted) people (5-fold difference). Another study found BA.1 or BA.2 infection among unvaccinated people induced very low levels of antibodies against BA.4/5. Those who were infected and vaccinated did have meaningful protection, albeit at lower levels than before.
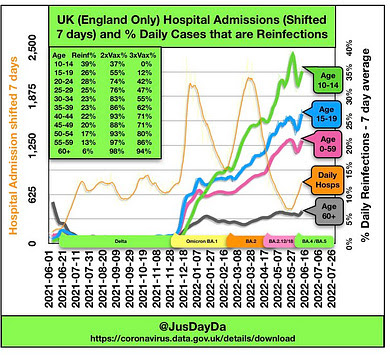
Weakening our first line of defense—neutralizing antibodies— will mean more (re)infections. Lab data compliments what we are seeing in the “real world”. BA.4/5 drove a substantial case wave in South Africa regardless of their high level of immunity. Case waves across Europe are now well on their way, too. In the U.K., reinfections are on the rise, even among 60+ year olds.
We don’t have epidemiological data on duration of booster effectiveness against BA.4/5. Data from the U.K. showed that boosters provided strong initial protection against BA.1 or BA.2 infection but quickly diminished to 0% five months later. We expect BA.4/5 to shorten this timeline even more. I’m not confident that our boosters will be able to keep up in protecting against infection with the rate of Omicron mutating. (…)
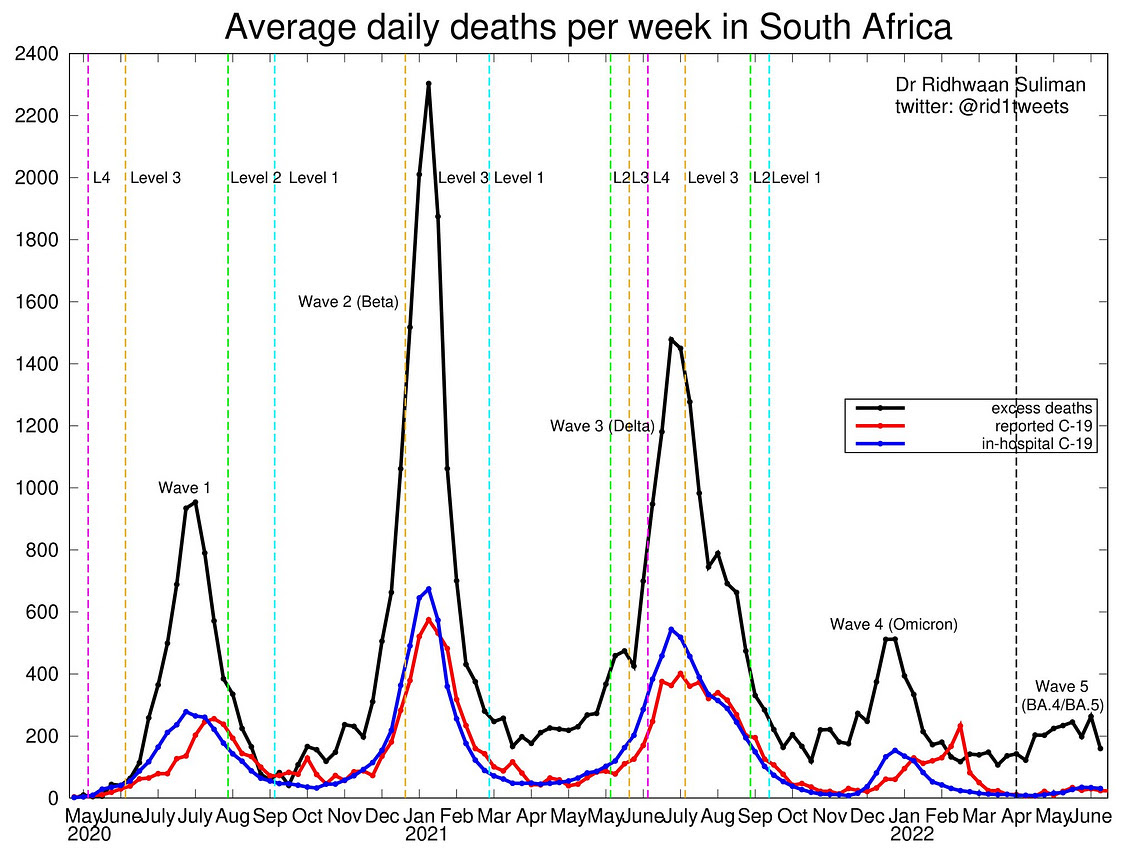
In South Africa, the BA.4/5 wave contributed to excess deaths, but the rate diminishes with every wave since winter 2021.
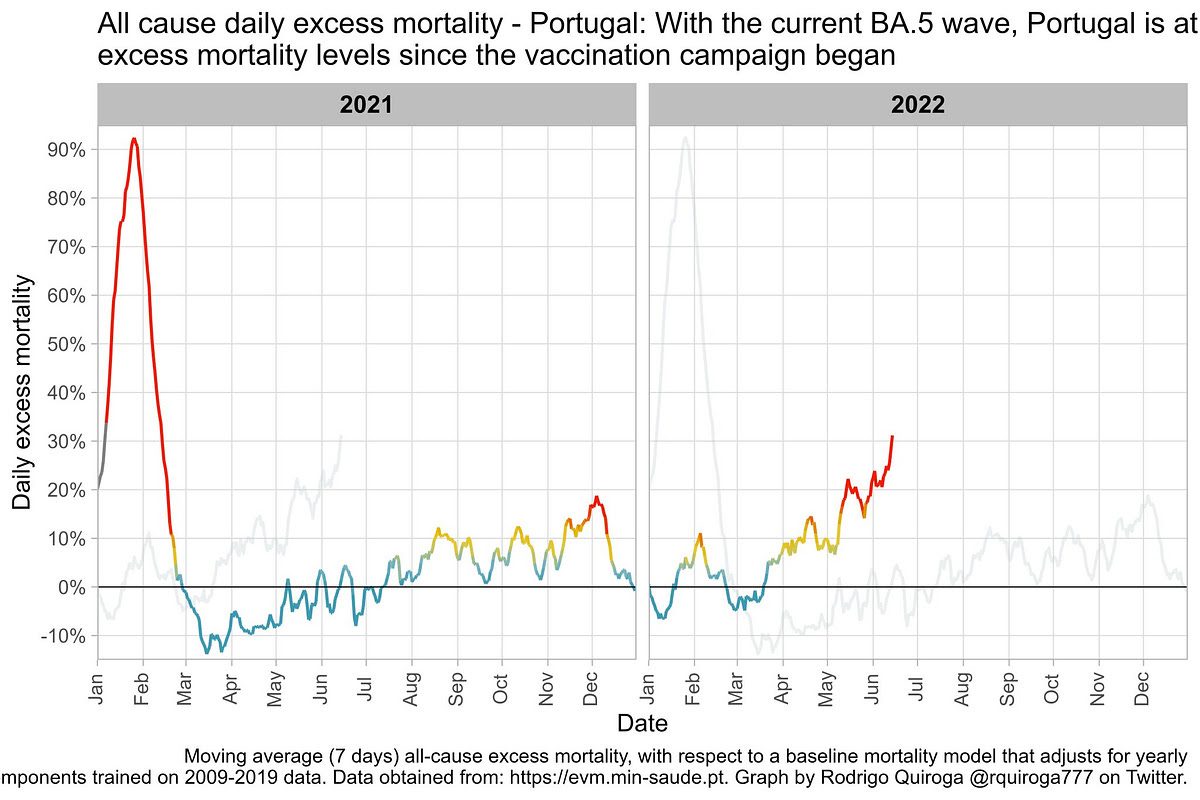
In Europe, Portugal is the BA.4/5 leader, with 70% of COVID-19 cases accounting for this new variant. With one of the highest vaccination rates in the world, they largely escaped death from Delta. However, now, after recently reaching their BA.4/5 case peak, excess mortality hit the highest level since their vaccination campaign began.
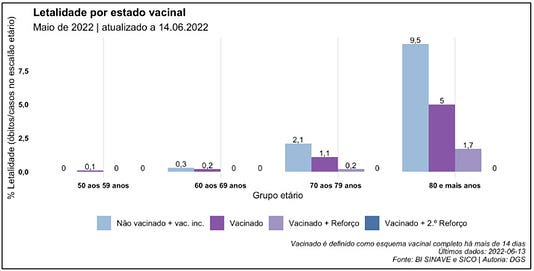
In Portugal, increase in hospitalizations is occurring mainly in people over 60 years old. In fact, in a recent analysis, unvaccinated people over 80 had a case fatality rate (CFR) of 9.5% (see figure below). Among those with only the primary vaccine series, CFR is 5%; among those with a booster, it is 1.7%. (…)
(Source Here)
The verdict is still out as to whether BA.4/5 is more severe. A recent preprint found that BA.4/5 was more severe for hamsters. In fact, their data suggested that BA.4/5 was going into the lungs more. (Initially, Omicron largely moved disease out of the lungs, which helped it become less severe). Importantly, though, this wasn’t the case using human sera. More research is certainly needed.
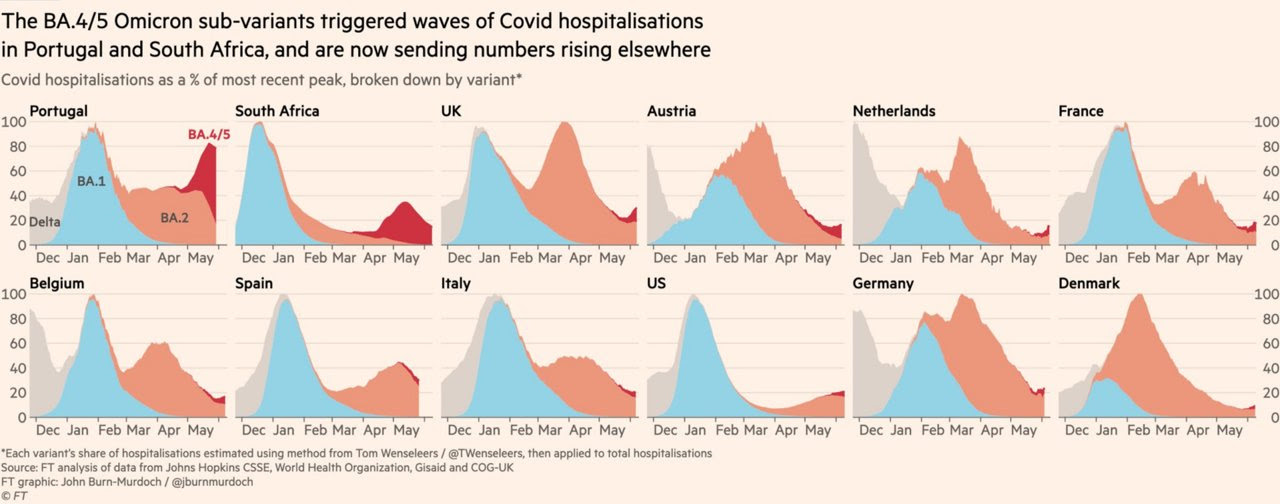
BA.4/5 hospitalizations are now making headway in other European countries. The figure from Financial Times below clearly shows the global upswing in hospitalizations as BA.4/5 entered the scene. But, so far, remains much lower than previous peaks.
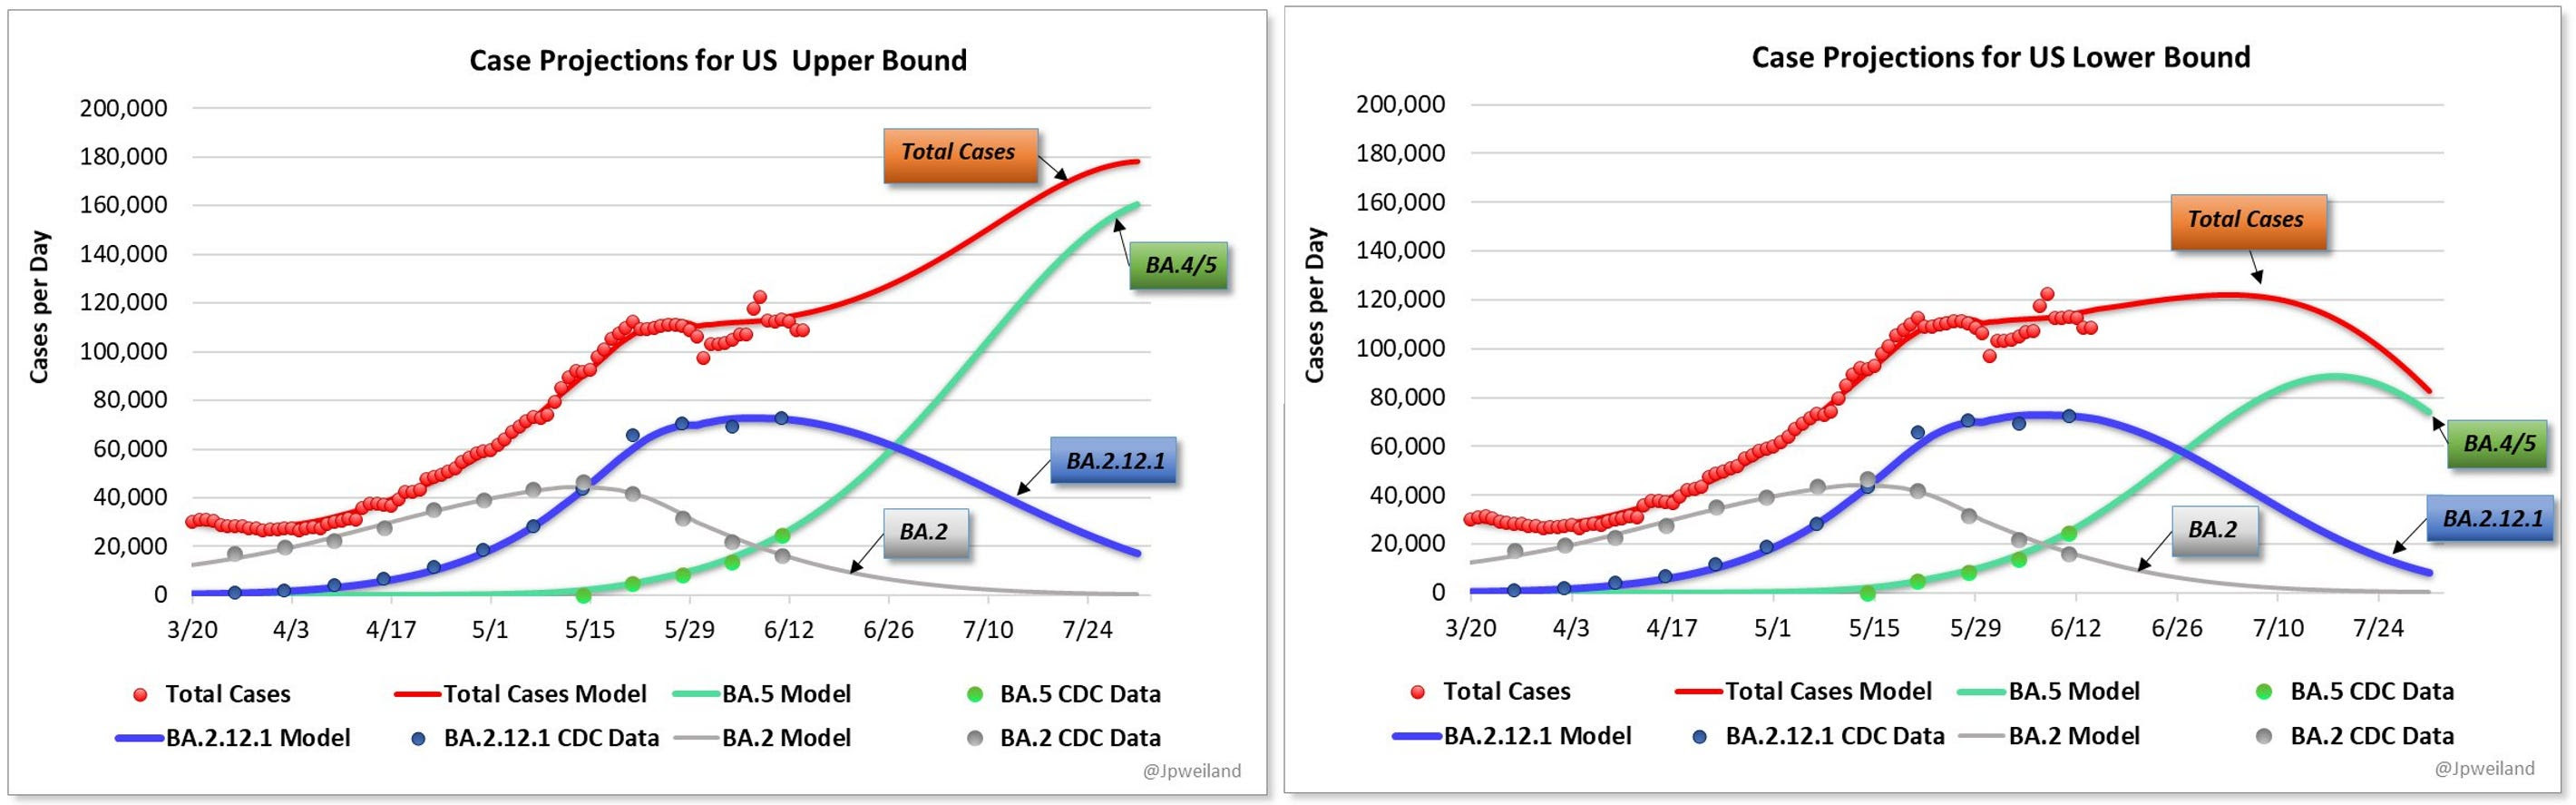
So where does this leave us in the U.S.? BA.4/5 makes up 35% of new infections and is growing quickly. Unfortunately, patterns in South Africa and Europe won’t tell us much about how things will unfold in the U.S. because we just had a very infectious variant moving through (BA.2.12.1). Other countries did not experience this. We know BA.4/5 is more transmissible than BA.2.12.1, but the epidemiological impact of that difference is not yet known. This is why disease modelers are providing case projections for worse case (below left) and best case scenarios (below right) for cases.
(Twitter JP Weiland)
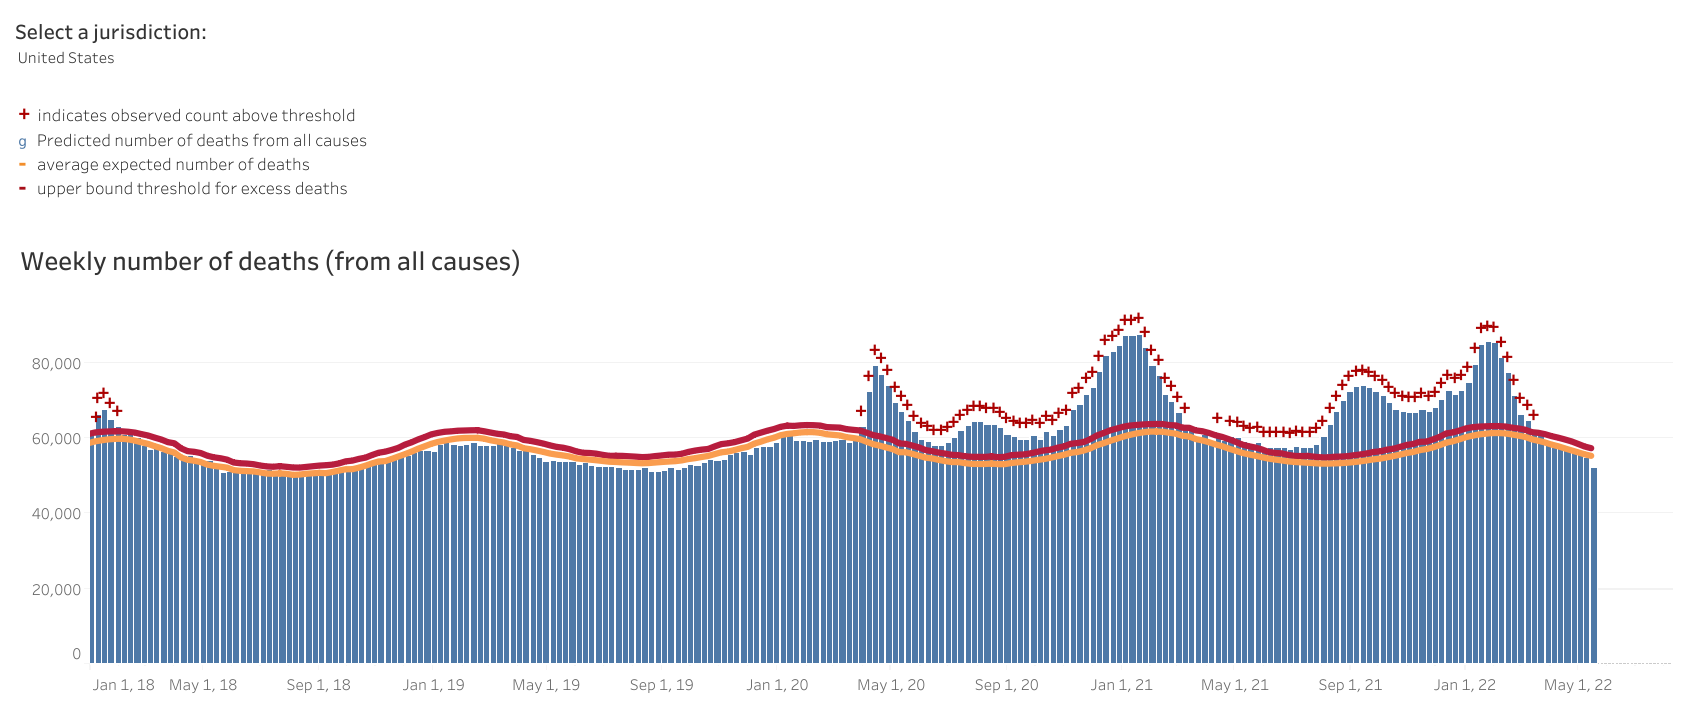
On a population level, we expect our complex history of infection- and vaccination-induced immunity to continue to protect against severe disease. In fact, it’s reassuring that all-cause mortality in the U.S. reached pre-pandemic levels from March-May 2022. Death certificates are lagged, so I’ll be curious to see if and how excess deaths changed in the past two months during our latest wave. It will also be important to track this by age, particularly among elderly, to ensure we don’t leave people behind in the wake of highly transmissible variants.
(CDC)
Bottom line
This virus continues to mutate to escape our first line of defense causing (re)infections. If you don’t want to get sick, it’s time to leverage other layers of protection, like masking. Thankfully, other immune system mechanisms continue to work to reduce severe disease. The transmissibility of the virus is causing upswings of hospitalizations and deaths among the most vulnerable of our populations. We aren’t out of the woods yet but we are inching closer and closer to a manageable virus.
 The World Economics SMI report indicates that US business activity is already in contraction mode (SMI < 50). It appears that companies are now shedding jobs.


