The May CPI report sure got the hawks out:
Inflation Demands Bold Fed Action An increase in rates this week is a good start. The process will be painful, but it’s also necessary.
(…) The Federal Reserve runs the risk of compounding a string of recent errors by being too tentative in raising rates. The Fed needs to act decisively to get a grip on inflation and inflationary expectations.
The situation is serious. Soaring inflation exceeds wage increases and is undercutting American consumers’ real purchasing power. Middle- and lower-income earners have suffered the most. Inflation-related worries have sliced large chunks off stock-and bond-market values, reducing household net worth. The University of Michigan Consumer Sentiment Index has fallen to its lowest measure in 50 years. (…)
The Fed’s credibility has been seriously damaged, and it must take aggressive monetary action to re-establish its inflation-fighting credentials. (…)
While it’s true that accelerating energy and food prices are accentuating inflation, the biggest driver of rising core inflation is prices of services, particularly shelter. Its two components—owner-occupied equivalent rent and direct rental costs—historically have lagged home prices, which have risen more than 20% in the last year, according to the Case-Shiller Home Price Index. Shelter costs are likely to continue accelerating through mid-2023.
The Fed prefers to measure inflation using the Personal Consumption Expenditure Price Index, which includes spending items like healthcare financed by Medicare, Medicaid and employer-financed insurance. But the Consumer Price Index is more heavily weighted toward what Americans pay for things out of their pockets. CPI inflation must be addressed with tough action.
Don’t expect help on the fiscal-policy side. Stimulus money continues to flow into the economy, even as federal budget deficits recede. Federal government spending of earlier budget authorizations continues. State and local governments saved virtually all of the $500 billion they received in federal grants and have begun to spend some of those funds. Strikingly, many are now providing financial subsidies to offset higher gasoline costs, which may buy votes for local elected officials but also contributes to demand for energy and thus to inflation. Also, the American Infrastructure and Jobs Act, enacted in November 2021, authorized an additional $1 trillion in deficit spending. The Biden administration now has a political incentive to hurry up that spending, which will add to economic activity, jobs and wage pressures in the already over-stretched construction sector.
It’s the Fed’s job to fight inflation. (…) the Fed can’t rely on hope. The Fed’s forward guidance is not a substitute for policy action. It must move decisively and reduce inflation to its long-run 2% target. Reducing inflation requires slowing nominal spending growth, which will squeeze business margins and raise unemployment. The short-run costs of rising unemployment may be painful, and the Fed may come under political pressure from Congress and the White House to accept a higher underlying rate of inflation. Markets may expect the Fed will eventually give in to these pressures and pause, accepting higher underlying inflation because the short-run costs of rising unemployment will be too painful.
The Fed must dispel that market expectation through aggressive actions. Raising rates 75 basis points and indicating more to come would send a necessary message. At this point, short-run pain is inevitable, but healthy longer-run economic performance requires lower inflation and a credible central bank.
- The WSJ editorial board to the FOMC:
(…) The Fed leaked Monday that the FOMC might consider a 75-point rate increase, and financial markets tanked on the news. But at 1% the real fed-funds rate is still deeply negative, and the Fed’s mistake is that it has been too easy for too long. The sooner the Fed breaks inflation, the better. (…)
This means slower growth, which was already underwhelming at minus-1.4% in the first quarter and is on a paltry 0.9% pace in the second quarter, according to the Atlanta Fed’s GDPNow tracker.
Tighter money and the risk of recession should also cause the White House to abandon its anti-growth fiscal and regulatory agenda. A slowing economy doesn’t need a $1 trillion tax increase, yet Senate Majority Leader Chuck Schumer is still trying to persuade Sen. Joe Manchin to sign on to a smaller version of Build Back Better. (…)
Democrats tried the tax increase to break inflation in the late 1960s but prices kept rising. They raised taxes in 1993 in the name of lower interest rates, but the Greenspan Fed still had to raise interest rates in 1994. The only way a tax increase would reduce inflation today is if it triggered a recession. (…)
The economic point is that policy makers should be pursuing pro-growth fiscal, deregulatory and trade policies to offset the impact of tighter money. That was the Ronald Reagan – Paul Volcker formula that broke inflation in the 1980s and led to a boom. (…)
- Mohamed A. El Erian: Federal Reserve Must Do More Than Raise Rates by 75 Points
(…) Regaining control of the inflation narrative is critical to the Fed’s policy effectiveness, its reputation and its political independence. The longer this takes, the greater the negative effects on economic well-being and social equity in the US, and the larger the negative spillovers for the rest of the world. (…)
The notion of a central bank consistently chasing inflationary developments, running out of good policy options and, in the process, intensifying economic and financial volatility would not be uncommon in a developing country lacking institutional credibility and maturity. It is highly unusual, and particularly distressing, for the central bank that is at the center of the international monetary system. (…)
- “It is monetary policy 101 that to defeat inflation, you need positive real interest rates in 1980 Volcker raised rates to 19% to combat 14% inflation. Greenspan raised rates in 1990 to 8.5% to fight 6% inflation. Even burns raised federal funds to 13 in 1974 to fight 11.5% inflation but retreated too quickly to get the job done. Today, we have real interest rates at the most negative level in the last 70 years. The idea that tightening a% or two from here will beat inflation is hardly credible” – Greenlight Capital President David Einhorn (via The Transcript)
- “betting on a soft landing to me is a real long shot. The other statistical fact is once inflation’s got above 5%, to use your word, it’s never been tamed without a recession so if you’re predicting a soft landing you’re going against decades of history. Could happen, anything’s possible, but I don’t think it’s probable” – Duquesne Capital Founder Stanley Druckenmiller (via The Transcript)
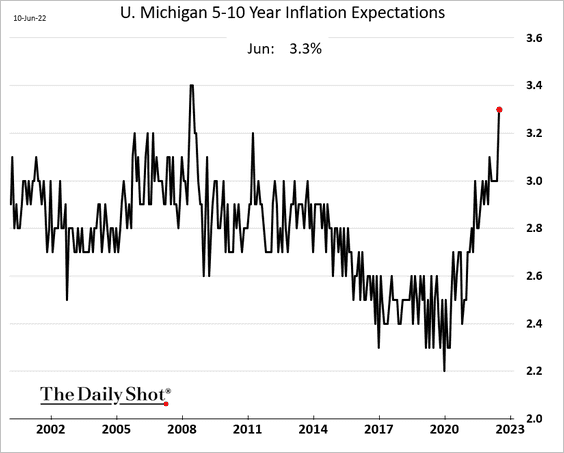
- the biggest problem for the Fed may not even be the CPI surprise. Instead, it could be the chart below. Are longer-term inflation expectations becoming unanchored? (The Daily Shot)
U.S. Producer Price Inflation Picks Up in May
Price inflation at the wholesale level remains heated. The Producer Price Index for Final Demand increased 0.8% during May (10.8% y/y) after rising 0.4% in April, revised from 0.5%. These last two gains follow three consecutive months of 1.1%-to-1.6% increase.
Producer prices less food, energy & trade services increased 0.5% (6.8% y/y) in May after increasing 0.4% in April. A 0.6% rise had been expected for the PPI less food & energy. (…)
Food prices were fairly steady during May (13.0% y/y) after significant gains in the prior four months.
The PPI for goods less food & energy gained 0.7% (9.7% y/y) following two consecutive months of 1.1% increase. Prices for final demand finished goods less food & energy increased 0.8% (8.8% y/y). Finished consumer goods prices less food & energy rose 0.9% in May (8.4% y/y) following a 0.6% increase. Durable consumer goods prices rose 0.7% last month (8.9% y/y) after four months of roughly 0.9%. Core nondurable consumer goods prices rose 1.0% (8.1% y/y), the strongest increase in three months. Prices for private capital equipment rose 0.7% (9.3% y/y) after increasing 1.2% in April.
Services prices rose 0.4% during May (7.6% y/y) following a 0.2% April decline. Trade services prices also increased 0.4% last month (13.6% y/y) after falling 0.6%. Services prices less trade, transportation & warehousing edged 0.1% higher in May (3.0% y/y) after falling 0.2% in April.
Construction product prices increased 0.4% in May (19.0% y/y) after surging 3.7% in April.
Intermediate goods prices jumped 2.3% (21.6% y/y) due to a 4.6% gain (47.5% y/y) in processed fuel costs.


 This Credit Suisse account of the restaurant industry suggests consumers are cutting back on discretionary spending:
Restaurant industry sales trends in May were solid, though decelerated during the month and relative to April. Based on data from Knapp-Track, Casual Dining SSS in May were 5.6%, including traffic of -0.9%, and based on our calculated compounding 3-yr SSS, May 3-yr SSS (vs 2019) were 7.8%, relative to 10.2% in April, 3.9% in March and -0.1% in February.
A more accurate measure of strength would deflate nominal sales with CPI-food-away-from-home which jumped from +4.0% in May 2021 to +7.4% this May. May SSS would then come in a less solid -1.8%.
CS adds that “Based on data from OpenTable, the change in seated diners (vs 2019) is -5.7% in the first half of June, relative to -2.4% in May, -1.3% in April and -4% in March.”
Combing the CPI data, I also found interesting that inflation in full service restaurant was 9.0% in May compared with 7.3% for limited service restaurants, probably because of the higher salary component in FSR costs structure vs LSR. The gap has been increasing in each of the last 3 months: March to May, FSR prices are up 10.0% annualized vs +3.2% at LSR. Higher wage rates are finding their way on the menus.
OPEC Oil Output Fell in May, Adding to Pressure on Cartel
Output among the 13 countries that make up OPEC dropped by 176,000 barrels a day last month to average roughly 28.5 million barrels a day, data from the cartel released Tuesday showed. (…)
The production declines came as protesters closed major oil refineries in OPEC member Libya, where output fell by 186,000 barrels a day. Output fell at other members, too: Nigeria’s by 45,000 barrels a day and Iraq’s by 21,000 barrels a day. The declines outweighed more modest supply increases from Saudi Arabia, the United Arab Emirates and Kuwait. (…)
Earlier this month, the cartel and a group of allied producers led by Russia agreed to a bigger-than-expected oil-production increase in an effort to tame rising oil prices. The group said it would raise output by 648,000 barrels a day in July and August, but the pledge was met with skepticism from oil-market analysts.
Many OPEC members are already producing at close to full capacity, with only leading producers Saudi Arabia and the U.A.E. believed to have sufficient spare capacity to raise output.
Meanwhile, other producers have struggled to meet their quotas in part because of aging oil-production infrastructure. The cartel’s production was already lagging behind an earlier, more modest target to increase production each month by 400,000 barrels a day. (…)
OPEC cut its production growth forecast among non-OPEC nations this year by 250,000 barrels a day to 2.1 million barrels a day.
The decrease is due to continued struggles for Russian oil producers to find customers for their crude since Moscow’s invasion of Ukraine. OPEC said Russian output would likely total 10.6 million barrels a day this year, 250,000 barrels a day less than it was expecting last month.
That marks the third consecutive month OPEC has lowered Russian oil-supply forecasts for the year, amounting to 1.1 million barrels a day that have been knocked off Russia’s expected output. (…)
The group’s oil production plan assumes Russia will increase its output by 170,000 barrels a day from July.
OPEC kept its demand forecasts steady. The cartel expects oil demand this year to grow by 3.4 million barrels a day.
(…) [Biden] says gas prices are 75 cents higher and diesel prices are 90 cents higher than the last time crude oil was trading around $120 per barrel.
“The lack of refining capacity — and resulting unprecedented refinery profit margins — are blunting the impact of the historic actions my administration has taken to address Vladimir Putin’s Price Hike and are driving up costs for consumers,” Biden said. (…)
(…) More than 1 million barrels a day of US oil refining capacity — or about 5% of the total — has been shut since the start of the pandemic. Some aging facilities were closed permanently as the virus crushed fuel demand. Others are being modified to produce renewable diesel instead of petroleum-based fuels amid a web of federal policies spurring a shift to green energy; those conversions may be too far along to reverse course. (…)
And while high prices typically entice investment, there’s little sign that oil companies will build new refineries now, amid a long-term shift away from fossil fuels, long payback times, booming construction costs and permitting challenges.
Even beyond the US, there have been big refining capacity reductions since the start of the pandemic — another 2.13 million barrels per day outside the US — that have further exacerbated the price pain. US refining allies have stressed that China’s export of petroleum products has declined even as the country’s refinery run rates shrink. (…)
LOWEST MAY JOB GAINS FOR TEENS SINCE 2018
Last month, 153,000 teens aged 16 to 19 gained jobs, according to an analysis of non-seasonally adjusted data from the Bureau of Labor Statistics (BLS) by global outplacement and executive coaching firm Challenger, Gray & Christmas, Inc.
May gains are 30% lower than the 219,000 teen jobs added in the same month last year. It is the lowest number of teen job gains in May since 2018 when 130,000 jobs were added.
Employment in Retail, a major employer for teens, fell by 61,000 jobs in May, according to the monthly employment situation from the BLS. Over half of the losses occurred in general merchandising stores.
- “At one point in Walmart U.S., Alan, we had over 300,000 people out on COVID leave in January. And that, as you know, the curve was steep and when it came down on the backside, they all came back to work, but we had hired others to try and fill those gaps given that so many people were out. So I think we have moved to the point where finding people and hiring people and retaining people isn’t the issue we’re facing at the moment. But we do now have a higher wage rate.” – Walmart (WMT) CEO Doug McMillon (via The Transcript)
So, there was a shortage, they hiked wages to attract workers, now overstaffed, but higher wages stick…
No wonder then:

Data: Business Roundtable; Chart: Axios Visuals
The good news: As of early June, 177 leaders of America’s biggest companies surveyed by the Business Roundtable — brought to you first in Axios Macro — were still planning to hire and invest at high rates.
The bad news: Their outlook deteriorated rapidly compared to early March — the sixth-fastest drop in the 78 quarters the survey has been conducted.
- 50% plan to increase employment levels in the next six months, down from 68% last quarter.
- 47% say they will increase capital investment plans, down from 60% last quarter.
- 72% expect sales to increase, 10 percentage points less than last quarter.
There’s this other bad news courtesy of @IanRHarnett: CEOs’ mood is very much linked to profit growth:

Small biz people are even more depressed. In fact, they have never been so down!

Data: NFIB; Chart: Simran Parwani/Axios
- Real estate firms Compass and Redfin [-8%] announced layoffs. (CNBC)
- Warner Bros Discovery to cut as much as 30% of advertising sales force. (The Information)
- Crypto platform Coinbase is laying off roughly 18% of its workforce, about 1,100 full-time jobs, amid a crypto downturn.
- Amazon’s drone delivery service will begin in California. (Axios)
Meanwhile, chaos is spreading:
Traders Put 80% Odds on Three-Quarter-Point Rate Hike in Canada
- Unions Start to Secure Higher Wages in Canada as Inflation Soars Canada has a relatively high unionization rate, at about 30% of employees versus about 10% in the US.
The average annual increase of seven major union wage settlements in March and April was 3.1%, according to government data. That’s almost double the average pace of pay increases between March 2020 and January 2022. (…)
The Public Service Alliance of Canada, which represents 120,000 workers or about a third of federal employees, is demanding a pay increase of 4.5% per year in negotiations that have hit an impasse. (…)
Teamsters Canada secured wage increases last month that range from 9% to 25% for warehouse workers of grocer Metro Inc. in Ottawa. Last month, crane and heavy equipment operators went on strike and successfully pushed for a hourly wage increase of C$3 ($2.36) per year until 2025. (…)
ECB Calls Emergency Meeting to Address Bond-Market Disruption Borrowing costs for Italy and other indebted southern European euro members have soared in recent days
(…) Investors have dumped southern European government debt in recent days after the ECB laid out plans on Thursday to phase out its giant bond-buying program and conduct a series of interest-rate hikes to fight record-high inflation. The yield on Italy’s 10-year government bonds has climbed to about 4.2%, the highest level since 2013 and up almost three-quarters of a percentage point in just five days.
ECB board member Isabel Schnabel sent a strong signal on Tuesday that the bank is ready to create a new bond-buying tool at short notice to contain a spike in southern European bond yields, which is bringing back memories of the bloc’s debt crisis a decade ago.

FYI, Italian debt-to-GDP is significantly higher than it was during Euro Crisis 1.0 while nationalism is a more potent political force than 10 years ago. That could spell trouble.
(…) triple-B-rated Italy’s government debt stood at 150% of GDP as of year-end, up from 119% a decade earlier and 134% on the eve of the pandemic. Yet thanks largely to Frankfurt’s tireless efforts, Italy paid only the equivalent of 3% of GDP last year to service its burgeoning debt load, compared to 5% as the sovereign credit crisis raged in 2011 and 2012.
Italy faces upwards of €850 billion ($884 billion) in maturities over the next four years according to Bloomberg, equivalent to a third of its total debt load. Increased interest expense could soon be in the offing, as Europe’s third-largest economy pays a weighted average interest rate of roughly 2.5%. For context, Italy’s two-year yield now stand at 2.13%, compared to 0.83% less than three weeks ago. (ADG)
But don’t worry, Ms. Lagarde is there: “I can only repeat what I have said, which is that we will not tolerate fragmentation.”
But it’s already happening. Who thinks Germans will go along with Club Med Subsidy 2.0? This ain’t Greece… Here we go again!
China Economic Data Beats Across The Board In Apparent ZeroCOVID Policy ‘Victory Lap’
(…) While all the economic signals did deteriorate in May (except unemployment), they also all beat expectations…
Retail sales fall less than expected and there’s a tick higher in investment. Industrial output notably stronger, reflecting the easing of restrictions, and the surveyed jobless rate fell to 5.9%
China Industrial Production YTD YoY BEAT: +3.3% vs +3.1% exp but WORSE from +4.0% prior
China Retail Sales YTD YoY BEAT: -1.5% vs -1.7% exp but WORSE from -0.2% prior
China Fixed Asset Investment YTD YoY BEAT: +6.2% YoY vs +6.0% exp but WORSE from +6.8% prior
China Property Investment YTD YoY BEAT: -4.0% vs -4.4% exp but WORSE from -2.7% prior
Surveyed Jobless Rate BEAT: 5.9% vs 6.1% exp and BETTER than 6.1% prior
Under the hood of today’s labor market improvements, the situation is ‘varied’ we suggest rather charitably:
Surveyed unemployment rate of the population aged from 16 to 24 was 18.4%
Jobless rate of those aged from 25 to 59 was at 5.1% percent
Urban surveyed unemployment rate in 31 major cities was 6.9%
Looking through the retail sales data, there were big drops for clothing, cosmetics, jewelry, electronics, furniture, automobiles and more. Beverages, tobacco, alcohol and petroleum (probably reflecting oil prices) were among the gainers.
Simply put, today’s data provides prima facie evidence that the Chinese economy hit a bottom in April and is now slowly on the mend – Mission Accomplished Beijing?
However, not wanting to steal the jam from China’s donut too much, despite industrial output rebounding to growth territory, apparent oil demand – a leading indicator – widened its decline to 8.3%YoY in May, suggesting that more bad news is ahead in the coming months.
As Bloomberg notes, even the NBS is hinting at caution: “We must be aware that the international environment is to be even more complicated and grim, and the domestic economy is still facing difficulties and challenges for recovery.”


- China GDP: nearly 11 billion Covid tests seen giving economy a US$26 billion boost in second quarter
- Widespread outbreaks across China since April have racked up a coronavirus-testing bill the size of a small country’s annual GDP, according to Chinese researchers
- Meanwhile, there are growing concerns among experts that an interest group composed of coronavirus test suppliers might have formed
The sheer cost of China’s mass coronavirus-testing campaign since April is expected to exceed the full-year gross domestic product (GDP) of nations such as Iceland and Cambodia, while giving China’s economy a much-needed shot in the arm, according to analysts.
An estimated 10.8 billion Covid-19 tests will be carried out in China during the April-June period, at a total cost of 174.6 billion yuan (US$26 billion), researchers with Soochow Securities said in a note on Sunday.
And that spending is likely to boost the nation’s economic growth rate by 0.62 percentage points in the year’s second quarter, while also helping to offset the impact of shrinking household consumption on the quarterly GDP, they said.
John Authers: The Stock Market Still Has Another Shoe to Drop
(…) This is now a bear market by any sensible definition, and yet a strong majority of big investors expect rates to be higher a year from now. At all previous tough moments for the stock market in this century, investors overwhelmingly believed that rates were coming down. The Federal Reserve and the bond market aren’t going to arrive like the cavalry this time:
(…) It’s decades since a market selloff has been met with higher rates, and few people active in finance today have any experience of a moment like this. So what should we be paying for a stock?
(…) the entire selloff to date has been driven entirely by valuations. This chart, prompted by Ian Harnett of Absolute Strategy Research Ltd. in London, shows the rolling 12-month change in the S&P 500’s trailing multiple. The expansion in 2020, in response to the gusher of cash to deal with the pandemic, was the fastest on record, and it has now been followed by the most drastic compression on record.
Valuations could certainly go lower still, but the bulk of the valuation-led part of the selloff is over. Now, the question is whether the earnings expectations on which those multiples are based are accurate. If expectations are over-optimistic and need to be cut, then there is room for share prices to fall further without much multiple compression. The BofA survey found serious bearishness about the profit outlook. Only in the immediate aftermath of the Lehman Brothers bankruptcy in 2008 has a greater proportion of fund managers expected global profits to fall:
(…) However, that is not the view of the brokers’ analysts who Bloomberg surveys to produce profit estimates. S&P 500 earnings expectations have risen 3% so far this year. Admittedly, this is mostly thanks to energy companies. Exclude them and forecasts are down minimally. (…)
If companies have enough pricing power to get their customers to pay more for their goods, then all well and good. But the Fed is now on a concerted campaign to try to ensure that they can’t do that. If you don’t want to fight the Fed, you might want to factor lower profits ahead into your calculations.
(…) a strong US currency also tends to inhibit earnings for everyone else. Over time, as this Absolute Strategy chart shows, surges in the dollar tend to be followed by falls in global earnings. The pressure a stronger dollar exerts on all those who need to buy dollar-denominated commodities or repay debt denominated in the currency makes this an inevitability:
(…) the longer the dollar rally continues, the more optimistic earnings forecasts appear. (…)


David Rosenberg:
- As for the stock market, we have never before seen the Fed tighten policy into an official bear market. There is a first for everything and this is it.
- As for the economy, the bottom line is that since 1970, a 22%+ drawdown in the S&P 500 over a five-plus month time span has resulted in a recession “only” 100% of the time (five for five).
The other part of the 60-40 portfolio:
- Global bonds nearing a bear market. The Bloomberg Global Aggregate Index, which tracks total returns from investment-grade government and corporate bonds, has slumped 19.7% from a record high in January 2021.
(…) The selloff in fixed income has wiped out almost $10 trillion of value in global bonds this year, erasing the gains made after central banks undertook unprecedented easing to cushion the global economy from a once-in-a-generation pandemic.
The global bond index has already slumped 16% in 2022, more than three times the size of the next biggest annual loss since 1990, after supply snarls, surging commodity prices, and rebounding consumer demand caught central bankers off guard, causing them to play catch-up on inflation.

 Electric Last Mile Solutions plans to liquidate about a year after a SPAC deal tagged the electric vehicle startup with a $1.4 billion valuation (Axios)
 30-Year Mortgage Rates Increase to 6.13%


