U.S. Flash PMI: Inflationary pressures weigh further on US private sector expansion
Latest ‘flash’ PMI™ data from S&P Global indicated a slower expansion in business activity across the US private sector during May. Manufacturers and service providers signalled softer upturns in output amid elevated inflationary pressures, a further deterioration in supplier delivery times and weaker demand growth.
The headline Flash US PMI Composite Output Index registered 53.8 in May, down from 56.0 in April, to signal a weakened rate of expansion of output across private sector firms. The rate of growth was the softest for four months, with the index now below the series long-run average of 54.8.
At the same time, new orders across the private sector continued to increase during May, albeit at the softest pace since August 2020. The rise in new sales was driven by manufacturing firms who recorded a sharp uptick in client demand, despite the rate of growth softening again from March’s recent high. Service providers, however, signalled the slowest upturn in new business for almost two years as hikes in selling prices weighed on demand conditions and the initial boost to demand from the reopening of the economy showed signs of fading.
Although solid overall and quicker than the series average, the rate of expansion in new export orders eased to a four-month low in May, easing for both goods and services.
Meanwhile, input prices soared higher again, with the pace of increase edging up to a new series high (since October 2009). Firms reported a substantial uptick in cost burdens, largely driven by a record-breaking rise in service sector input prices. The rate of cost inflation at manufacturers also accelerated and was among the fastest in the series history.
The surge in input prices was linked by companies to supplier-driven price hikes for a wide variety of goods and services as demand often continued to outstrip supply, as well as higher interest rates, wage bills, fuel costs and higher transportation fees.
Average prices levied for goods and services also rose markedly, albeit with the rate of inflation easing from April’s series-record high as some companies reported challenges passing further surges in costs on to customers. The pace of increase was the second-fastest on record, however.
Concurrently, firms continued to raise employment levels midway through the second quarter, and at the fastest pace for 13 months. Manufacturers registered a steeper upturn in job creation, with service providers noting another sharp rise in workforce numbers just shy of April’s one-year peak. Staffing numbers rose in line with reports of increased new order inflows and further pressure on capacity. Subsequently, the rate of growth in backlogs of work softened to a three-month low.
Business confidence across the private sector remained upbeat, with firms recording a stronger degree of optimism in the outlook for output over the coming year in May. Firms were buoyed by ongoing sales growth and investment in local supply chains which it is hoped will ease bottlenecks. However, although higher than April, the degree of positive sentiment was below levels seen earlier in the year amid concerns regarding inflation and customer spending patterns.
At 53.5 in May, down from 55.6 in April, the S&P Global Flash US Services Business Activity Index signalled a solid upturn in service sector output midway through the second quarter. That said, the rate of growth eased to the slowest for four months and was well below March’s recent high. Although the rise was supported by increased client demand, the pace of expansion was reportedly weighed down by hikes in selling prices and concerns over higher interest rates.
Similarly, new business rose at a solid but softer pace in May. The rate of growth in new sales was the slowest since August 2020 and below the series average. New export business at service providers rose strongly, but at the slowest rate since the start of the year.
Service providers registered the fastest rise in input prices on record in May as cost burdens soared. Hikes in wage bills, interest rates, fuel costs and material prices were all noted as factors behind inflation. Although firms sought to pass higher input prices on to clients, the rate of charge inflation eased from April’s record high and was the slowest for three months.
Despite being strong overall, pressure on capacity softened to the least marked for three months in May, as service providers raised their workforce numbers sharply. The rise in employment was the second-fastest in over a year as companies sought to fill long-held vacancies.
Meanwhile, optimism among service sector firms strengthened. Alongside hopes that staffing and material shortages will have eased over the coming year, firms also expressed confidence that any drop in client demand will prove transitory.
The S&P Global Flash US Manufacturing PMI posted 57.5 in May, down from 59.2 in April. The overall improvement in operating conditions across the manufacturing sector was sharp overall and stronger than the series trend. The headline figure was supported by strong and steep expansions in output and new orders respectively, alongside a faster upturn in employment and longer supplier lead-times.
Growth in production was driven by efforts to clear backlogs of work and process incoming new orders. That said, further reports of raw material shortages and delays in supplier delivery times dampened output growth and led to a quicker rise in work-in-hand. Vendor performance deteriorated markedly, but to the least severe extent since January 2021.
Despite a sharp increase in purchasing activity, material shortages resulted in a slower rise in stocks of purchases and a faster decline in post-production inventories as firms worked through current holdings in an effort to meet order requirements. At the same time, inflationary pressures remained substantial, with input costs rising at the sharpest pace since November 2021. Inflation stemmed from hikes in key components and logistics including; transportation, metals, fuel and cardboard prices. Output charges rose at the third-steepest pace on record (since May 2007) as a result.
Meanwhile, greater new order inflows sparked the fastest increase in employment since July 2021. Many firms stated that greater staffing numbers were due to hiring to replace voluntary leavers, and the filling of long-held vacancies. Nonetheless, backlogs of work increased at a sharper pace as firms struggled to keep pace with rising demand.
Finally, manufacturers expressed a lower degree of optimism in the outlook for output over the coming year in May. Positive sentiment was the lowest for seven months as hopes of new client acquisitions and greater demand were dampened by inflationary fears. (…)
Despite all of the headwinds facing businesses, the survey data remain indicative of the economy growing at an annualised rate of 2%, which is also supporting stronger payroll growth. However, cost pressures have risen to a new survey high which, alongside the encouraging output and employment numbers, will fuel further speculation about the need for further imminent aggressive rate hikes.


The U.S. is thriving while most other countries are struggling. Its higher energy self-sufficiency and above average pandemic support provide a cushion while Europe, the U.K., China and Japan bear the brunt of the effects of the war in Ukraine, supply disruptions and accelerating costs that are increasingly difficult to pass through.
A few contrasting comments from the flash PMIs:
USA:
- manufacturing firms recorded a sharp uptick in client demand
- the rate of expansion in new export orders was solid overall and quicker than the series average
- firms continued to raise employment levels midway through the second quarter, and at the fastest pace for 13 months
- Business confidence across the private sector remained upbeat, with firms recording a stronger degree of optimism in the outlook for output over the coming year
- solid upturn in service sector output midway through the second quarter
- new business rose at a solid but softer pace in May
- New export business at service providers rose strongly
- the rise in employment was the second-fastest in over a year
- optimism among service sector firms strengthened
Eurozone:
- The second quarter so far has seen the weakest manufacturing expansion since the pandemic-related shutdowns in the second quarter of 2020.
- increased caution among customers and spending by households being diverted from goods to services led to weaker output growth or even falling production.
- manufacturing new orders fell for the first time since June 2020
- Confidence fell to the lowest since the first wave of the pandemic in manufacturing during May
U.K.:
- UK private sector firms signalled a sharp slowdown in business activity growth during
- the month-on-month loss of momentum in May was the fourth-largest on record and exceeded anything seen prior to the pandemic.
- May data indicated a slowdown in new order growth across the UK private sector for the third consecutive month.
- pass through of higher costs to clients had led to softer demand conditions
- Manufacturers reported the steepest drop in export orders since June 2020
- more subdued customer demand had led to squeezed margins and greater caution about passing on rising costs during May.
Japan:
- expansion in manufacturing output was the softest recorded in the current three-month growth sequence.
- Both output and new order growth slowed to a marginal pace that was the weakest for three months.
But all is not rosy in the U.S.:
- weaker demand growth
- hikes in selling prices weighed on demand conditions
- some companies reported challenges passing further surges in costs on to customers
- cost burdens soared at service providers but the rate of charge inflation was slowest for three months
Yesterday, we also got the Richmond Fed Survey of Manufacturing Activity for May and it was not pretty as “the indexes for shipments and volume of new orders declined from 6 in April to -16 and -15 in May, respectively. (…) The wage index also remained elevated, indicating that a large share of firms continue to report increasing wages. The average growth rate of prices paid increased notably in May. Firms also reported higher average growth in prices received in May.

This follows weak reports for the N.Y. and Philadelphia areas.
Richmond service sector activity saw some softening in May. The revenues and demand indexes both saw decreases in May, with the index for demand dropping notably, from 24 to 10. The indexes for expected revenues and demand in the next six months also decreased but remained positive.
More firms reported deteriorating local business conditions, as the index fell to -5 in May from 4 in April. Firms are less optimistic about future business conditions, as the expected business conditions index dropped to -14. This is only the fourth time this index has been negative; the other three times were at the beginning of the COVID-19 pandemic.
The wage index dropped to 34 in May from 44 in April, remaining high.
The average growth rate of prices paid edged up slightly in May while growth in prices received declined. Firms’ expectations for price growth in the next 12 months decreased from April to May.
In all, the U.S. (and possibly Canada) is doing relatively well compared to the RoW doing increasingly bad. But, in absolute terms, American companies are experiencing weakening demand momentum, and rising pressures on margins.

US economic data have been surprising to the downside, intensifying market fears of a recession

Source: Goldman Sachs Global Investment Research
CEO Confidence Declined Sharply in Q2
The Conference Board Measure of CEO Confidence™ in collaboration with The Business Council declined for the fourth consecutive quarter in Q2 2022. The measure now stands at 42, down from 57 in Q1. The Measure has fallen into negative territory and is at levels not seen since the onset of the pandemic. (…)
“Expectations for future conditions were also bleak, with 60 percent of executives anticipating the economy will worsen over the next six months—a marked rise from the 23 percent who held that view last quarter.”
“Amid historically low unemployment and record job openings, nearly 70 percent of CEOs are combating a tight labor market by increasing wages across the board,” said Roger W. Ferguson, Jr., Vice Chairman of The Business Council and Trustee of The Conference Board. “On top of that, companies are grappling with higher input costs, which 54 percent of CEOs said they are passing along to their customers. This may contribute to cooling in consumer spending heading into the summer.”
Notably, nearly 60 percent of CEOs expect inflation will come down over the next few years. But they also believe that the interest rate hikes that will tame inflation will cause a recession—albeit, a very brief, mild recession that the Fed offsets.
CEOs’ assessment of general economic conditions declined in Q2 2022:
- 14% of CEOs reported economic conditions were better compared to six months ago, down from 34% in Q1 2022.
- 61% said conditions were worse, up from 35%.
CEOs were more pessimistic about conditions in their own industries in Q2 2022:
- 24% of CEOs reported that conditions in their industries were better compared to six months ago, down from 40%.
- 37% said conditions in their own industries were worse, up from 22%.
CEOs’ expectations about the short-term economic outlook weakened in Q2:
- 19% of CEOs said they expected economic conditions to improve over the next six months, down from 50% in Q1.
- 60% expected conditions to worsen, up from 23%.
CEOs’ expectations regarding short-term prospects in their own industries declined in Q2:
- 28% of CEOs expected conditions in their own industry to improve over the next six months, down from 58%.
- 34% expected conditions to worsen, up from 13%.
- Wages: 91% of CEOs expect to increase wages by 3% or more over the next year, up from 85% in Q1.
- Capital Spending: 38% of CEOs expect to increase their capital budgets in the year ahead, down from 48% in Q1.

Fortune’s own survey of Fortune 500 CEOs:
Seventy-five percent expect a recession this year or next. On average, they also expect inflation to remain (slightly) over 5% next year. Inflation, recession and talent shortages get roughly equal billing as the three greatest threats they face—ranking above geopolitics, cybersecurity, the pandemic and climate.
The Retail Carnage Continues
- Abercrombie’s stock plunged 28.6% Tuesday after the chain posted a $16.5 million loss and downgraded its fiscal 2022 sales growth outlook from a range of 2–4% to 0–2%. Inventories up 45% YoY!
- Best Buy BBY 1.21% said on Tuesday that comparable-store sales in the U.S. declined 8.5% in its quarter ended April 30. But net income fell by nearly 43%. The company lowered its sights for the year and now expects comparable sales to fall by 3% to 6%. About three months ago it was expecting a decline of 1% to 4%. Best Buy’s inventory expanded by a more modest 9% last quarter compared with a year earlier—something Ms. Barry credited to active inventory management. BBY’s statement added: “That [macro] trend has continued into the beginning of Q2 and it does not appear that it will abate in the near term […] people are pulling back at a faster, deeper pace than we had initially assumed.”
Hmmm…inventory up 9% when sales are down 8.5%! I bet BBY now turns to active sales management.
CHINA
Ned Davis Research reports that
Past lockdowns [in China] have typically left the industrial sector relatively unscathed, but not this time. The manufacturing PMIs plunged further into contraction territory,
led by pronounced weakness among small businesses.Industrial production dropped 2.9% in April from a year earlier, also the sharpest fall in history after the initial COVID lockdowns in 2020. The decline was led by a record slump among foreign-owned companies. (…)
According to government officials, a full reopening is unlikely to be in effect until mid-to-late June (and that’s assuming the virus is contained).
The highly contagious Omicron variant against the ineffectiveness of Chinese vaccines and low immunity due to prior illness, suggest that the population is subject to further outbreaks. (…)
Until the broader population receives a more effective vaccine [China has yet to produce an effective mRNA vaccine but Xi refuses to buy the proven Western versions], including the under-vaccinated senior population, a robust rebound in activity, especially among consumers, is unlikely. (…)
Premier Li Keqiang recently described the employment market as “complicated and grim”. Refinitiv informs us that “The surveyed rate of urban unemployment has risen markedly over recent quarters and is now well above the early 2020 peak in 31 large cities. It is particularly elevated among 16-24-year-olds, rising from 14.3% in December to over 18% in April. This comes in a year when a record 11 million students are due to graduate from Chinese universities. The authorities will increasingly worry about the risks to social stability if unemployment continues to spike.”
The Chinese government and its central bank are desperately trying to boost the economy. They may be about to discover what “pushing on a string” means. Europe and Japan are slowing and Chinese consumers are in a state of shock after the collapse in equity markets and declining house prices.
“In the first four months of the year, Refinitiv says, the areas of floor space started and sold were down 28% and 25% respectively compared with the same period in 2021, while the area of land purchased by real estate developers was almost 50% lower.”
Nothing positive for the world economy….and lumber prices.
U.S. New Home Sales Plunge in April as Prices Jump
The new home sales market is unraveling. New single-family home sales during April fell 16.6% (-26.9% y/y) to 591,000 units (SAAR). It was the lowest level of sales since the end of the recession two years earlier. This fourth consecutive monthly decline in sales occurred from 709,000 units in March, revised from 763,000. Earlier figures also were revised. The Action Economics Forecast Survey expected 750,000 sales in April. The data is generated by the U.S. Census Bureau.
Sales declined last month across the country. Sales in the South weakened 19.8% (-36.6% y/y) to 307,000, the lowest level since December 2016. Sales in the Midwest dropped 15.1% (-25.5% y/y) to 73,000, a five-month low. Sales in the West fell 13.8% (-12.4% y/y) to 163,000, the fourth consecutive monthly decline. Sales in the Northeast weakened 5.9% (+17.1% y/y) to 48,000 following two consecutive monthly increases.
The median price of a new home in April strengthened 3.6% (NSA, 19.6% y/y) to a record $450,600 following a 1.8% March increase. The average sales price of a new home increased 9.1% (31.2% y/y) to a record $570,300. These sales price data are not seasonally adjusted.
The decline in sales left the market for new homes flooded in April. The number of unsold new homes jumped 8.3% (40.1% y/y) to 444,000, the most since May 2008.
The seasonally adjusted supply of new homes for sale rose to 9.0 months in April, up from 5.6 months in December. The record low was 3.3 months in August 2020. The median number of months a new home stayed on the market fell to 2.8. The record low was 2.5 months in October of last year. These figures date back to January 1975.

ING:
Construction is 4% of the economy and key retail sales components (furnishings, furniture, building materials etc) all correlate with housing activity.
Furthermore, the inventory of homes for sale continues rising with nine months-worth of sales now sitting on the market – the largest proportion since 2010. Weakening demand and rising supply imply the possibility that house prices will soon top out and start to fall. Rising interest rates in an environment of falling home prices are never a good combination for consumer sentiment and will add to the chances of a retrenchment and potential recession down the line.
Home inventory for sale is rising rapidly

Redfin:
“The meteoric rise in mortgage rates is prompting more house hunters to back out of the market, causing competition to cool,” said Redfin Chief Economist Daryl Fairweather. “Higher rates are also limiting homebuyers’ ability to significantly bid up home prices, meaning some homes aren’t selling for as much over the asking price as they would have a year ago. This could help set off a slowdown in home-price growth in the coming months.”
The dropoff in bidding wars is one of many signs the housing market is slowing. Pending home sales are down 6% year over year, the largest drop since June 2020, and mortgage applications are down 8%. Home tours and online housing searches are also falling and the share of home sellers dropping their asking prices is at a seven-month high of 16%.

THE NEW SUBPRIMES
Last week: More Subprime Borrowers Are Missing Loan Payments Strained by the end of pandemic benefits, consumers with limited or troubled credit histories are falling behind on payments for car loans, personal loans and credit cards.
I quipped: That does not include the BNPL crowd…
Here’s a primer on BNPL from the NY Magazine:
(…) It seems smart, almost responsible. You know credit-card debt is how boomer-economy consumers wrecked their finances. And BNPL isn’t credit — it’s debit with fixed payments taken right from your bank account, and you’re told there’s no interest or late fees. It helps you plan your spending, letting you spend more now — so you do. You use Afterpay to buy sneakers from Reformation, and Klarna to defer payments on tickets from Live Nation, and Affirm to get a Peloton. Your approach to spending feels New Economy — the traditional laws of finance don’t apply. (…)
BNPL seduced a generation with a great pitch. The firms position themselves as a financially responsible alternative to credit because, per Afterpay’s former executive director, young people “don’t want to be on credit.” (…) Calling debt “a better way to pay” is masterful, tapping into young people’s desire for innovation right at the point of greatest vulnerability: checkout. Merchants love BNPL because it increases basket size (by as much as three and a half times) and purchase frequency. (…)
When tested on financial concepts, only a quarter of Americans between 23 and 35 demonstrated basic knowledge. Four out of five BNPL customers said they use the service to avoid credit-card debt. And now nearly a third of them can’t afford the BNPL debt. One behind-on-her-payments Klarna customer told the BBC, “I wasn’t too worried because my credit score was quite good. The next time I checked, it had nearly halved.” (…)
Fortune magazine brings us up-to-date:
Klarna, the most valuable fintech unicorn in Europe, told employees yesterday that it was laying off 10%—or around 700—of its employees this week.
Just a year ago, Stockholm-based Klarna seemed untouchable. It is a venture capital darling—having raised nearly $4 billion in venture capital dollars from backers like Sequoia Capital and SoftBank, and becoming the highest valued unicorn based out of Europe. It’s been rapidly scaling, launching a Chrome browser extension and adding its Klarna credit card to new markets. (…)
Affirm’s delinquencies rose to 6.3% in the first quarter of this year—up from 4% in the second quarter of 2021.
Klarna racked up $700 million in losses last year, and 65 percent of it was from credit defaults. Affirm lost almost the same over the past 12 months, while its marketing expenses tripled to $427 million.
Meanwhile, VCs are retrenching and venture-backed companies can’t find the dough to bake their costs in anymore. Per Fortune again:
Investors have been anticipating a slew of layoffs at venture-backed private companies—but actual mass layoffs have been few and far between thus far. There was Latch at the end of last week, which laid off 28% of its full-time staff—or around 130 people—to speed up its efforts in generating cash flow and becoming profitable. Or Outside, the Boulder-based digital outdoor athletics publication, which said it was letting go of 15% of its staffers earlier this month.
There are more: Since January, nearly 50 startups have made significant layoffs, per Layoffs.fyi.

There will be more: Pitchbook counts nearly 2,000 new venture funds that have been raised in the US since the beginning of 2020.
Startups will have to compete more aggressively for venture capital, or will have to become profitable sooner so that they don’t have to rely on investors. “For those that can’t,” says Turck, “there will probably be some carnage, unfortunately—a combination of acqui-hires and outright failures. Expect a few of those to be somewhat scandalous.” (Wired)
-
Lyft to Pause Some Hiring and Trim Budgets, Citing Economic Slowdown
-
Sequoia Warns Founders of ‘Crucible Moment,’ Advises How to ‘Avoid the Death Spiral’ The firm suggested founders move fast to extend runway and to fully examine the business for excess costs. “Don’t view [cuts] as a negative, but as a way to conserve cash and run faster,” they wrote.
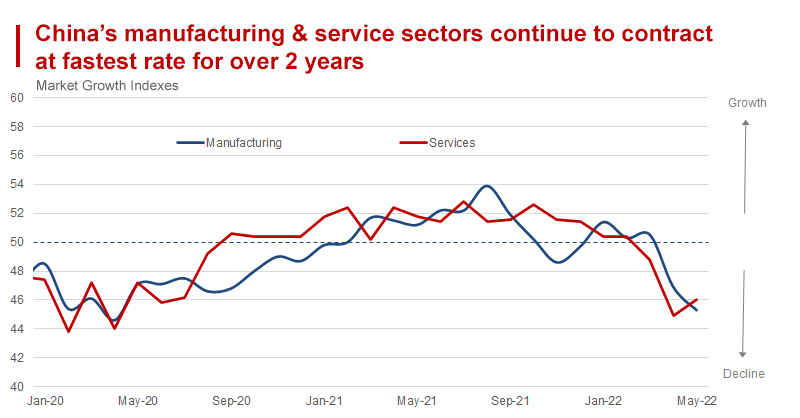
Back to China: this is the World Economics’ Sales Managers Index:
The All-Sector Sales Managers Index has fallen in May to levels not seen for over two years
The May Sales Managers Index illustrates dramatically the heavy toll being taken on the Chinese economy by the continuing Government attempts at preventing the spread of Covid. Some 40 cities are now reported as affected accounting for almost a third of GDP. (…)
One other worrying sign was highlighted by sharp rises in the Prices Indexes in both Manufacturing and Service sectors. The overall Manufacturing + Services Price index rose from 50.5 in April to 53.1 in May.
Bank of America Doles Out Additional Pay Increases and Electric-Car Perks
Bank of America Corp. is boosting pay for tens of thousands of US employees that earn less than $100,000 a year and adding reimbursements for a portion of electric-vehicle purchases.
Base salaries will climb as much as 7% for workers who have been with the firm since 2021 or earlier, according to a memo seen by Bloomberg News. The size of the raises, which start at 3% and kick in next month, will be based on how many years each employee has worked at the company.
Bank of America, which employs more than 200,000 worldwide, is also evaluating compensation for similar roles outside the US, according to the memo, which was confirmed by a company representative. (…)
Bank of America previously announced that its hourly minimum wage would increase to $22 from $21, another step toward its goal of reaching $25 an hour by 2025. (…)
Bank of America also announced a new perk to encourage all-electric rather than fuel-based driving. The company will give a $4,000 reimbursement to employees that buy an electric vehicle, or $2,000 for a new lease, according to a separate memo. (…)
Earlier this year, the bank said it would reward nearly all its staff with a pool of $1 billion in restricted stock, on top of regular compensation.
SENTIMENT WATCH
Where is the “all in no matter what” level? Question: “If we continue to sell off, at what level on the S&P 500 would you step in to buy, regardless of macro developments?”

According to BofA, retail has been busy selling lately. They write: “Retail and institutional clients were net sellers (for first time in 4 weeks and for the second week, respectively). Sales by retail were the largest in a year and the 12th largest in our data history (since ‘08)”. Retail is not a contrary indicator, but BofA also writes: “weeks of similarly or more extreme retail outflows have been followed by positive 4-week S&P 500 returns >90% of the time”. Add to that the recent put love (here) by retail and things could get dynamic should we squeeze a little more… (The Market Ear)
 Mega-SPAC Mints a $21 Billion Fortune That Collapses in Minutes
(…) MSP Recovery was valued at $32.6 billion in its merger with special purpose acquisition company Lionheart Acquisition Corp. II, the largest such combination ever in the US as measured by enterprise value. It began trading Tuesday on the Nasdaq, plunging more than 60% to $3.85 at 10:04 a.m. in New York, less than an hour after its debut.
(…) it’s the second post-merger SPAC deal for Lionheart’s chief executive, Ophir Sternberg, after taking fast-food chain BurgerFi International Inc. public in December 2020. Those shares traded at about $3 on Tuesday, down 81% since its merger. (…)
Nomura Holdings Inc., one of Lionheart’s underwriters, will receive more than $24 million in fees now that the merger has closed. Nomura owned about 8% of Lionheart’s shares, and agreed to vote that stake in favor of the business combination in advance of the meeting.
Nomura’s vote, plus that of Sternberg and other officers and directors, meant that the merger could be approved without winning the vote of any public shareholders, assuming the minimum quorum threshold. (…)
Transaction fees for the bankers, lawyers and accountants who helped make the deal happen come to $78 million, some of which has already been paid. (…)
Good grief! Pukable!
Breaking Russia’s Ukrainian Grain Blockade A Black Sea mission to escort commercial ships may be needed to prevent a global food shortage.
(…) Russia’s military is denying Ukrainians use of their own ports. Mariupol on the Sea of Azov has been destroyed and is now in Russian hands. Ukraine still holds Odessa, but Kremlin warships won’t let commercial ships into or out of that Black Sea port.
The consequences include shortages and higher food prices as prospects rise that Ukraine’s annual crop production won’t make it to world markets. Ukraine exports about 14% of the world’s corn, 10% of its wheat, and 17% of barley, according to the U.S. Department of Agriculture. Roughly 50 countries rely on Russia and Ukraine for at least 30% of wheat imports. (…)
In normal times, Black Sea ports account for 90% of Ukraine’s grain and oilseed exports, the commission says. (…)
The world will have to do more to prevent hunger and the risk of unrest that soaring food prices could trigger. Recall how the Arab Spring began in Tunisia. (…)
The economic suffering will increase, and food shortages will turn into political stress around the world. If Mr. Putin won’t yield, the civilized world, led by the U.S., will have to find a way to break his Ukraine food blockade.


 (
(

 Retail loves splits