TECHNICALS WATCH
Technical warnings of the past two weeks have finally turned into a call for a correction as sellers have taken over and now dominate equity trading. Up to Wednesday July 14, tech stocks were resisting the downdraft pushing most stocks down since June 8. No longer. Defense is key for now although no signs of a bear just yet as CMG Wealth’s 13/34–Week EMA Trend chart suggests.

A NDR chart I had never seen before is shared by CMG Wealth’s Steve Blumenthal with the caption “Important Sell Signal” triggered on June 18 with an 86% win rate:
Here’s how to read the chart:
- The analysis looks at the number of new stock offerings and plots the data all the way back to 1969.
- There are two categories: too much supply (many offerings), and relatively few new stock offerings.
- The indicator looks for a change in the trend in new offerings. Signals, as you can see, are infrequent. A “sell” signal was just triggered on June 18.

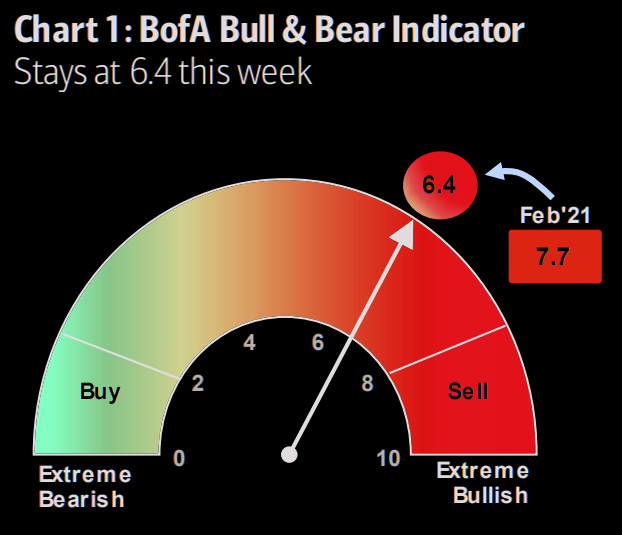
BofA’s Bull & Bear gauge not at boil level but the water is hot:
(The Market Ear)
EARNINGS WATCH
We have 41 S&P 500 company reports in and 90% surprised positively (+19.2%) including +75.4% for the 6 Consumer Discretionary companies having declared their Q2 results. Sales at these 6 CD companies surprised by 11.4%! More on this below.
The economy is very strong and supply chains are struggling to keep up. Commentary from companies suggested that these supply chain challenges will last through the end of the year at least. And the inflation that comes with supply chain bottlenecks may not be so transitory. (The Transcript)
Analysts are scrambling to keep pace:


Trailing EPS are now $176.83, 7.5% above pre-pandemic levels, this while the S&P 500 rose 28%. Twelve-month forward earnings just passed the $200 mark ($200.07), up 14.1% from 12-m forward EPS in February 2020.
The Rule of 20 P/E is 26.0 using forward EPS and inflation of 4.4%; it was 22.9 in Feb. 2020.. If you wish to “normalize” inflation to, say, 2.5%, the R20 P/E is 24.1, 17% above its “20” median (it was 21.6 in Feb. 2020).

Trailing and forward earnings are currently rising faster than inflation pushing the Rule of 20 Fair Value (yellow line) upward (now at 3110). If history holds, valuation corrections are possible but bear markets don’t occur when the R20 FV is rising (exception: 1987, a 3-month bear).
-
2021 Business Leaders Outlook Pulse Survey: Locally and globally, business optimism is now higher than pre-pandemic levels—and company and industry optimism are at the highest level in the history of the JPMorgan Chase Business Leaders Outlook.
(…) With the economy reopening and vaccination expanding, many of the 1,375 executives who responded to the 2021 Business Leaders Outlook Pulse survey said they see unprecedented economic opportunity and significant hiring needs in the next 6-12 months.
The percentage of business leaders who are optimistic about their companies and industries was the highest recorded in 11 years of the Business Leaders Outlook. Some 80% expect higher revenue/sales and 71% expect profits to increase for the remainder of 2021.
Nearly two-thirds of respondents say they added new product/service lines in response to the pandemic that they’ll keep afterward. Most say they’ll keep pandemic-era supply chain strategies, too.


Meanwhile, fundamentals are getting complicated.
Retail-Sales Gains Bolster Recovery Consumers spent more on products and services associated with the resumption of outside activities as governments ended many remaining Covid-19 restrictions.
Retail sales rose 0.6% last month compared with May, the Commerce Department reported Friday. [Consensus was +0.6%](…)
Economists said higher prices accounted for some of the increase in retail sales last month, but that the spending trend helped support an improving recovery. (…)
Sales in June were robust at restaurants and bars and clothing and accessories stores. Meanwhile, sales fell in categories that benefited from strong demand earlier in the pandemic as Americans stayed at home. Sales at furniture, sporting goods and building materials stores all dropped. (…)
Auto sales, which have shown signs of slowing amid supply-chain disruptions that have limited the number of vehicles for sale, fell by 2% and weighed on overall retail sales last month. Excluding autos—a sometimes volatile category of products—sales rose 1.3% in the same period [consensus was +0.4%].
Retail sales last month were up by 18% compared with February 2020, just before the pandemic took hold. (…)
Retail sales are showing no signs of giving back their new high ground. Control Sales (retail sales ex-cars, gas, restaurants and bars and building materials), which feed directly into GDP, are up 18.9% from Feb. 2020 and hanging up there as well. Note also that the recent softness in auto sales is because of very low inventories given production/supply chain issues, rather than weak demand.

The economy has been gradually reopening since March. During those 4 months, sales at restaurants and bars have jumped 27.1% but Control Sales have nevertheless grown another 7.8%, indicating that consumers have enough money to sustain goods purchases at a high level while resuming spending on services. Contrasting sales with aggregate payrolls in the last 4 months, it is clear that Americans are heartily using their pandemic savings, giving more credence to the bullish, potentially inflationary, strong, sustained, YOLO inspired demand scenario.

While economists and central bankers debate inflation and the meaning of “transitory”, the reality on main street is that, transitory or not, the recent surge in prices is having a growing impact on real retail sales. The BLS calculates that retail inflation has been +5.3% since February 2020 but reached +9.5% annualized in the last 3 months. As a result, while nominal retail sales are unchanged since March, real sales are down 2.5%. In the chart below, note the transition from goods deflation prior to the pandemic to inflation since, particularly in 2021.

The next chart illustrates the trend in real aggregate payrolls (red) as inflation accelerated in recent months. Since January, nominal payrolls are up 3.1% but real payrolls are down 0.3% and trending lower in spite of continued employment growth.

Transitory or not, inflation is rapidly eating into Americans’ savings, particularly as it hits essentials such as food, up 5.5% since February 2020 but +6.7% annualized in Q2’21, and energy, up 8.9% since February 2020 together accounting for 21% of total CPI. The other large and essential expenditure category is lodging which in June logged only +2.0% YoY in the CPI. Given the actual jump in house prices and rents (see below), it is only a matter of time until fast rising lodging costs find their way into official statistics.
Lodging is 33% of the CPI so with food and energy, more than half of the CPI, the essential, non-discretionary part, is dangerously inflating with low odds of proving only transitory. In effect, the average American family is already experiencing stagflation, dreading the day when the Fed, if proved wrong in its transitory thesis, decides to use “the tools” it claims to have to correct its mistake. (BTW, what are the FOMC’s tools to combat stagflation?)
To be sure, aggregate consumer finance are in great shape but another stark divide is taking shape in the USA: people merrily spending their excess pandemic savings vs people struggling to cope with stagflation. According to an analysis by Oxford Economics, “the top 20% of earners — and to a lesser extent the second 20% —account for all the current accumulated cash.” That leaves over 60% struggling. A recent Goldman Sachs analysis estimates that the top 40% of American earners control 65% of excess savings.
Could that be what the bond market is sniffing? Ten-year treasuries touched 1.29% last Friday with core inflation at 4.4%, down from 1.74% at the end of March when core inflation was 1.6%.
Lack of Supply Is Pushing Rents and Home Prices
(…) We are well on our way to more supply coming in 2022 and 2023. Here are the upcoming supply pipelines we are monitoring:
- Rental Homes: Many resale homes that are coming on the market are finding their way into single-family rental (SFR) portfolios. With more rental home supply, occupancy rates will normalize and rent growth will slow.
- Build-for-Rent (BFR): BFR operators, owners, and builders are adding some much-needed rental home supply. We expect this channel to grow as capital continues to enter this asset class. (…) roughly 7% to 10% of land purchases in the last few quarters in the Southeast, Southwest, and Texas are going to BFR operators. This indicates future supply coming down the pipeline.
- Rising property taxes: Recent home price appreciation will cause significant property tax increases in most states. These increases will be passed onto tenants until vacancy rises.
- Apartments: The 30-year high supply of apartment construction is being quickly absorbed, leading to more construction in the works. Capital is flooding into apartment development, which will increase supply once again.
- For-sale (new and existing): Home builders are on land buying sprees, and we are finally seeing more resale listings hit the market. More for-sale supply will slow down the tremendous price appreciation that has been occurring.
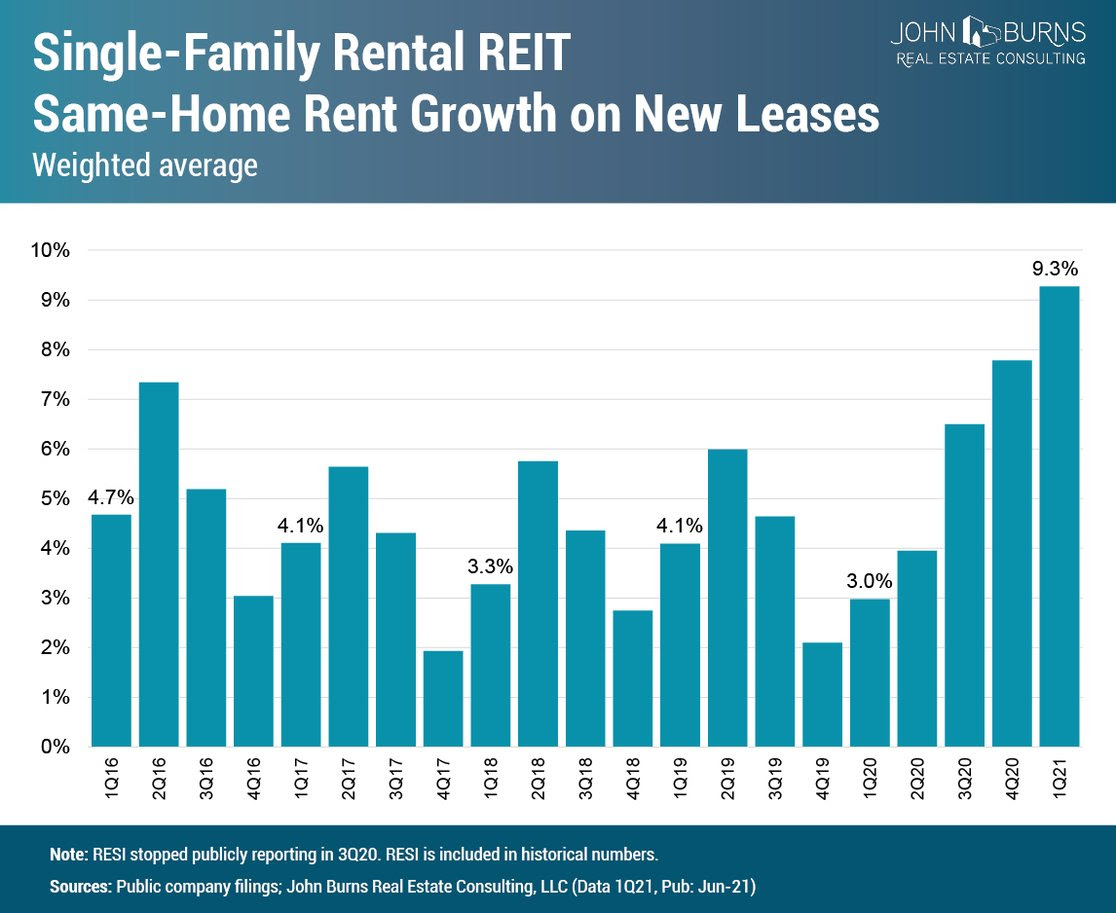
For now, let’s take a look back at what the single-family rental REITs have reported. In early June, Invitation Homes (INVH) reported 14.1% same-home new lease rent growth for May 2021 and American Homes 4 Rent (AMH) recently highlighted 12.7% same-home new lease rent growth quarter-to-date in May 2021, both striking results that indicate insatiable demand.
Here are a few key takeaways from our 1Q21 Single-Family Rental REITs Results Report, a new report we added to our single-family rental research suite, which covers American Homes 4 Rent (AMH), Invitation Homes (INVH), and Tricon Residential (TCN).
In 1Q21, the three SFR REITs reported the following results*:
- 9.3% same-home rent growth on new leases, the highest rent growth we’ve seen since we’ve started tracking this metric.
- We analyze market level same-home rent growth and for the 3 combined REITs, we saw 17% same-home new lease rent growth in Phoenix, and 13% same-home new lease rent growth in Las Vegas and Atlanta. Landlords are raising rents much less on existing tenant renewals.
- 4.6% same-home rent growth on renewals, which is back to pre-COVID levels. Landlords exercised restraint in pushing renewals during the pandemic. We expect this number to accelerate through 2021 as the economy opens up and occupancy remains so high. Below are the results for May:
- AMH same-home renewal rent growth = 5.3% (quarter-to-date in May 2021)
- INVH same-home renewal rent growth = 5.9% (May 2021)
CPI-Rent is up 1.9% YoY in June…

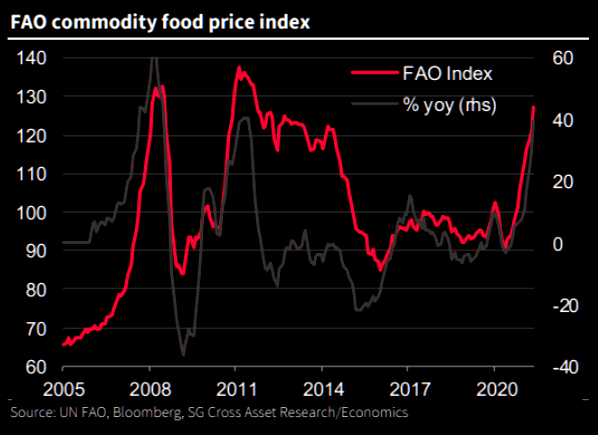
- On July 13, food packager Conagra Brands cut its earnings forecast for the next 4 quarters by 7% due to cost pressures being “materially higher than we anticipated” after Q1. The company reassured investors that it has developed an “aggressive and comprehensive action plan. . . which includes broad-based pricing [initiatives].”
(The Market Ear)
- The University of Michigan’s widely followed consumer sentiment index unexpectedly tumbled to 80.8 in July from 85.5 in June.
- Consumers have increasingly said they are worried about what inflation may look like one year and five years from now.
- The report also found that consumers have never been more frustrated by the rising prices of homes, cars and durable goods like home appliances.
- For these categories, a net 33% of consumers said it was a bad time to buy because prices were too high. This is an all-time record according to data going back to 1960.
- The report found 71% of consumers thought it was a bad time to buy a home because prices were too high, while just 6% thought it was a good time to buy because prices were low. (Axios)

Data: University of Michigan; Chart: Axios Visuals
Lack of supply is everywhere
Total Business Sales are up 12.7% since February 2020 but inventories are flat. New orders are through the roof, yet shortages abound causing price spikes.

 Source: Macrobond, ING

Total industrial production is down 1.2% from February 2020 and production of Durable Goods is down 3.8% amid booming demand, most of which is for imported goods. Meanwhile, production of motor vehicles and parts is down 13.8% from its pre-pandemic level and domestic auto production has cratered 35.3%.
The lack of semi-conductor chips, which go in anything from brake sensors to satellite navigations systems, is really hampering output with chip producers warning that supplies could remain constrained well into 2022. Consequently, disappointing output and ongoing price pressures are likely to be a persisting theme. (…)
This combination of strong order books and low customer inventories mean that there is a growing sense of rising corporate pricing. With so many companies experiencing supply chain issues and higher costs, be it for components, energy, raw materials or workers, this means companies are increasingly able to pass them onto customers – as highlighted by today’s Philly Fed and NY Empire manufacturing surveys. This is another reason to believe that inflation could remain more elevated for longer than the Federal Reserve believes likely. (ING)
Price Received components
Source: Macrobond, ING
Here, There and Everywhere!
COVID Waves Roll Across Southeast Asia
Nothing to help world growth nor the supply chains:
Since April, a number of Southeast Asian economies have been hit by escalating COVID-19 Delta waves. Indonesia, Malaysia, Thailand, Vietnam, Cambodia and Myanmar are all currently experiencing significant COVID waves that have triggered lockdowns and are creating significant disruption to economic activity.
The latest IHS Markit Manufacturing PMI surveys for Southeast Asia have reflected the impact of these new lockdown measures, which have disrupted industrial production and consumption spending.
In Malaysia, the headline IHS Markit Malaysia Manufacturing Purchasing Managers’ Index (PMI) fell sharply in June, to 39.9 compared with 51.3 in May. This pointed to a severe decline in business conditions in the Malaysian manufacturing sector. The renewed downturn in June reflected the recent steep rise in daily COVID-19 infections and associated containment measures, which again dampened demand, stymied production and disrupted supply chains.
Vietnam’s economy has also been hit by the impact of the latest COVID wave, after its economy showed considerable resilience during 2020 as the domestic pandemic was successfully contained. The latest wave of COVID-19 cases in Vietnam led to a sharp decline in business conditions for manufacturers during June. The IHS Markit Vietnam PMI dropped sharply to 44.1 in June from 53.1 in May, pointing to the most rapid deterioration in business conditions for over a year and ending a six-month period of growth.
The pandemic, lockdown measures and temporary company closures were all mentioned by firms in Vietnam as factors leading to sharp reductions in both output and new orders during June. Meanwhile, new business from abroad also decreased as transportation issues and container shortages exacerbated the impacts of the rise in virus cases.
Output and new orders both decreased at the sharpest rates since the first outbreak of the pandemic in early-2020, while firms scaled back their employment and purchasing activity accordingly. The pandemic also impacted supply chains, resulting in a near-record lengthening of delivery times. For example, four industrial parks in Bac Giang province in northern Vietnam were temporarily closed in late May, due to outbreaks of COVID cases, which also impacted on some manufacturing facilities of Foxconn and Samsung.
In Indonesia, daily new COVID-19 cases have risen sharply during June and early July, reaching 40,400 by 12th July. As of July 12, 2021, an estimated 13.3% of the Indonesian population have received their first vaccinations.
India’s economic recovery momentum in early 2021 has also been badly impacted by the recent severe COVID-19 wave that hit the nation in May and June, although the severity of the latest wave appears to be receding as daily new cases have declined rapidly during recent weeks.
India’s manufacturing industry fell back into decline during June, as the intensification of the pandemic and strict containment measures negatively impacted on demand. Falling new orders, business closures and the COVID-19 crisis triggered a reduction in output among Indian manufacturers.


Here’s a little more supply:
OPEC+ Agree to Boost Oil Output Producers to increase production by 400,000 barrels a day, moving to restore capacity they cut at the start of the Covid-19 pandemic
OPEC and its Russia-led oil-producing allies agreed to unleash millions of barrels of bottled-up crude over the next two years, committing to restore all the cuts they made at the start of the Covid-19 pandemic as many economies pick up and crude demand recovers.
Underscoring the uncertain speed of a full economic recovery and a return of pre-pandemic oil demand, the group chose to move gradually, agreeing to modest, monthly installments of new oil through the latter end of 2022. Oil prices have eased recently in anticipation of a deal, but analysts said the gradual nature of the output boost could continue to pressure prices. (…)
Sunday’s oil deal calls for the Organization of the Petroleum Exporting Countries and a Russia-led group of big producers to raise production by 400,000 barrels a day each month through the end of 2022. The deal seeks to unwind all the cuts the two groups, collectively called OPEC+, agreed to make at the start of the pandemic. (…)
But the demand outlook remains uncertain. Much of the developing world, where demand growth for oil had been strongest pre-pandemic, is still fighting surging Covid-19 cases. (…)
OPEC expects oil demand in industrialized nations to increase by 2.7 million barrels a day in 2021, up 6.3%. More than half of that growth will come from the U.S., at 1.5 million barrels a day, it said. In its first 2022 forecasts for the global oil market, OPEC said last week it expected the world’s appetite for crude to rise by 3.3 million barrels a day to average 99.9 million barrels a day next year. That is about the level of demand pre-pandemic. (…)
OPEC said the U.A.E.’s baseline would go up by about 332,000 barrels a day. Saudi Arabia and Russia will each get their baseline lifted by 500,000 barrels a day. Overall, the group’s estimated production capacity is being upgraded by 1.63 million barrels a day. (…)
Goldman Sachs says that
While the increase in baselines of 1.63 mb/d is larger than expected, we do not view this as bearish. First, such a number does not impact production volumes, set by quotas which remain near 0.4 mb/d even after the baseline increase (and with the window to implement such binding production quotas now extended from April to December 2022). Second, this does not reflect the loss in capacity taking place in most OPEC+ countries (and aggressively assumes a large increase in Russian capacity well above past production highs).
Third, such production volumes will ultimately be needed as under-investment in productive capacity in many regions require higher core-OPEC production in coming years. In fact, the announcement of these higher baselines, right ahead of US earnings, may contribute to shale producers staying disciplined, the second bullish supply catalyst we expect in coming weeks. In addition, progress on the US reaching an agreement with Iran has stalled, creating risks that the potential ramp-up in Iran exports is later than our October base-case (with OPEC stating its willingness to offset it once more). Finally, we believe consensus expectations for non-OPEC+ non-shale production remain too optimistic (we are 0.8 mb/d below the IEA in coming months).
With most of our expected summer demand gains already achieved and with headwinds growing from the Delta COVID variant, we believe that the catalyst for the next leg higher in prices is shifting from the demand to the supply side, with upside risks to our price forecasts in the coming months as a result.
All else equal, this represents $2/bbl upside to our $80/bbl summer and $5/bbl upside to our $75/bbl 2022 Brent price forecasts although market focus on the Delta variant and higher baselines will likely delay such price impacts.
- TSMC Expects Auto-Chip Shortage to Abate This Quarter The company is on track to increase output of microcontrollers used in cars by about 60% this year compared with last. However, the broader semiconductor shortage could persist until 2022.
Global Growth Boom May Disappoint, Morgan Stanley’s Sharma Warns
China’s regulatory crackdown on its technology sector and U.S. consumers possibly saving more than they spend are twin risks facing the world’s economic recovery, according to Ruchir Sharma, head of emerging markets and chief global strategist at Morgan Stanley Investment Management.
(…) What he’s warning is that the consensus for a robust boom may be overlooking downside risks that may cause momentum to fade sooner than expected. (…)
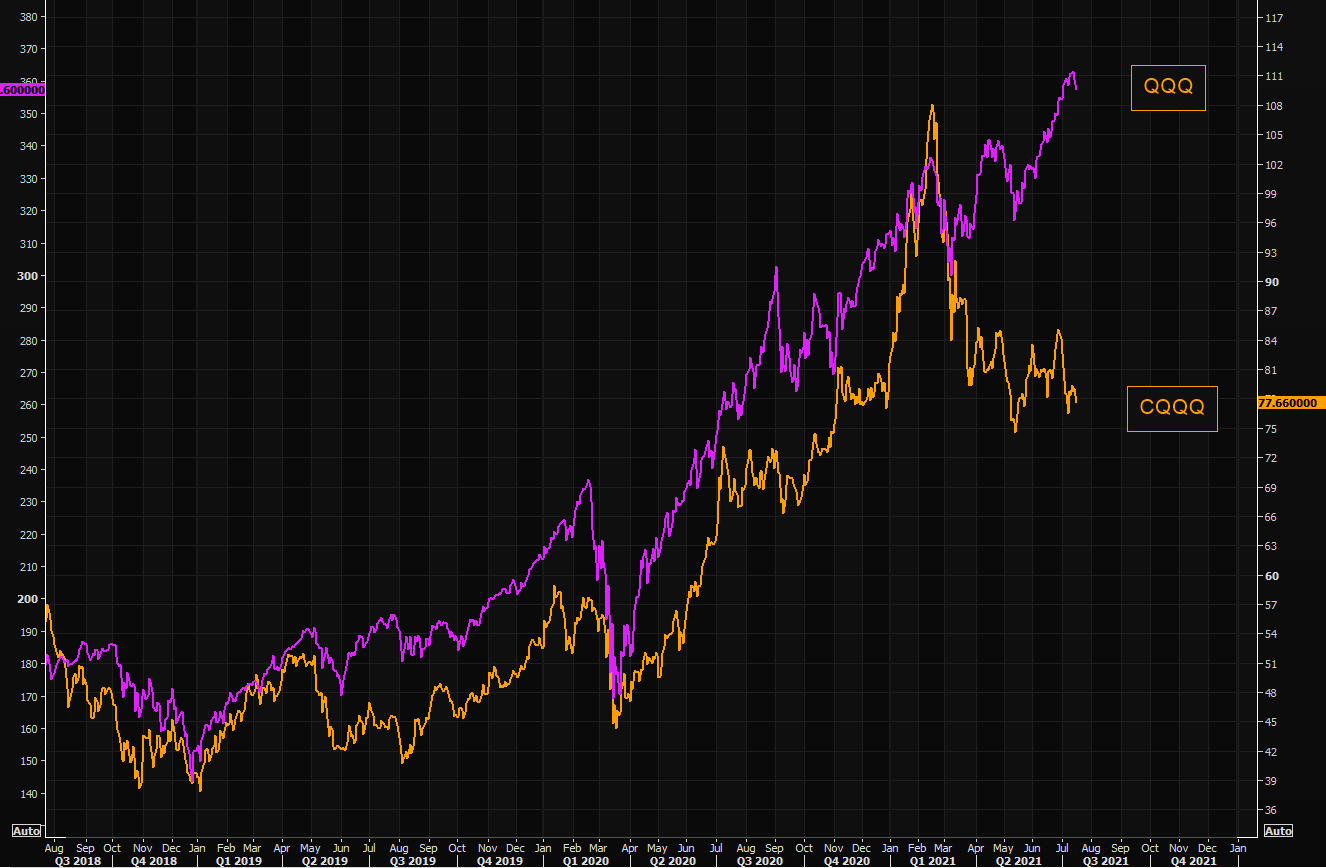
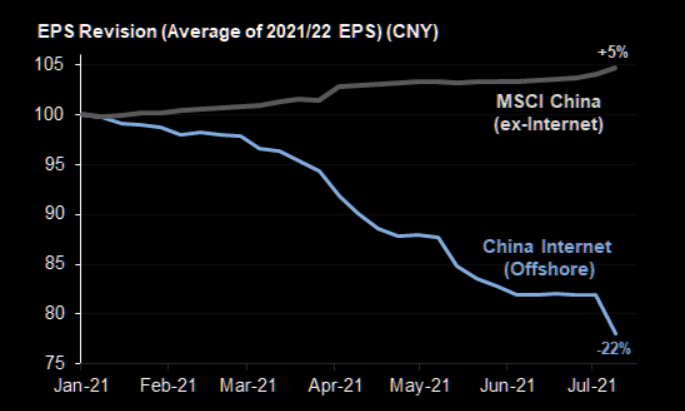
Speaking of China’s regulatory crackdown:
Phillip Orchard at Geopolitical Futures:
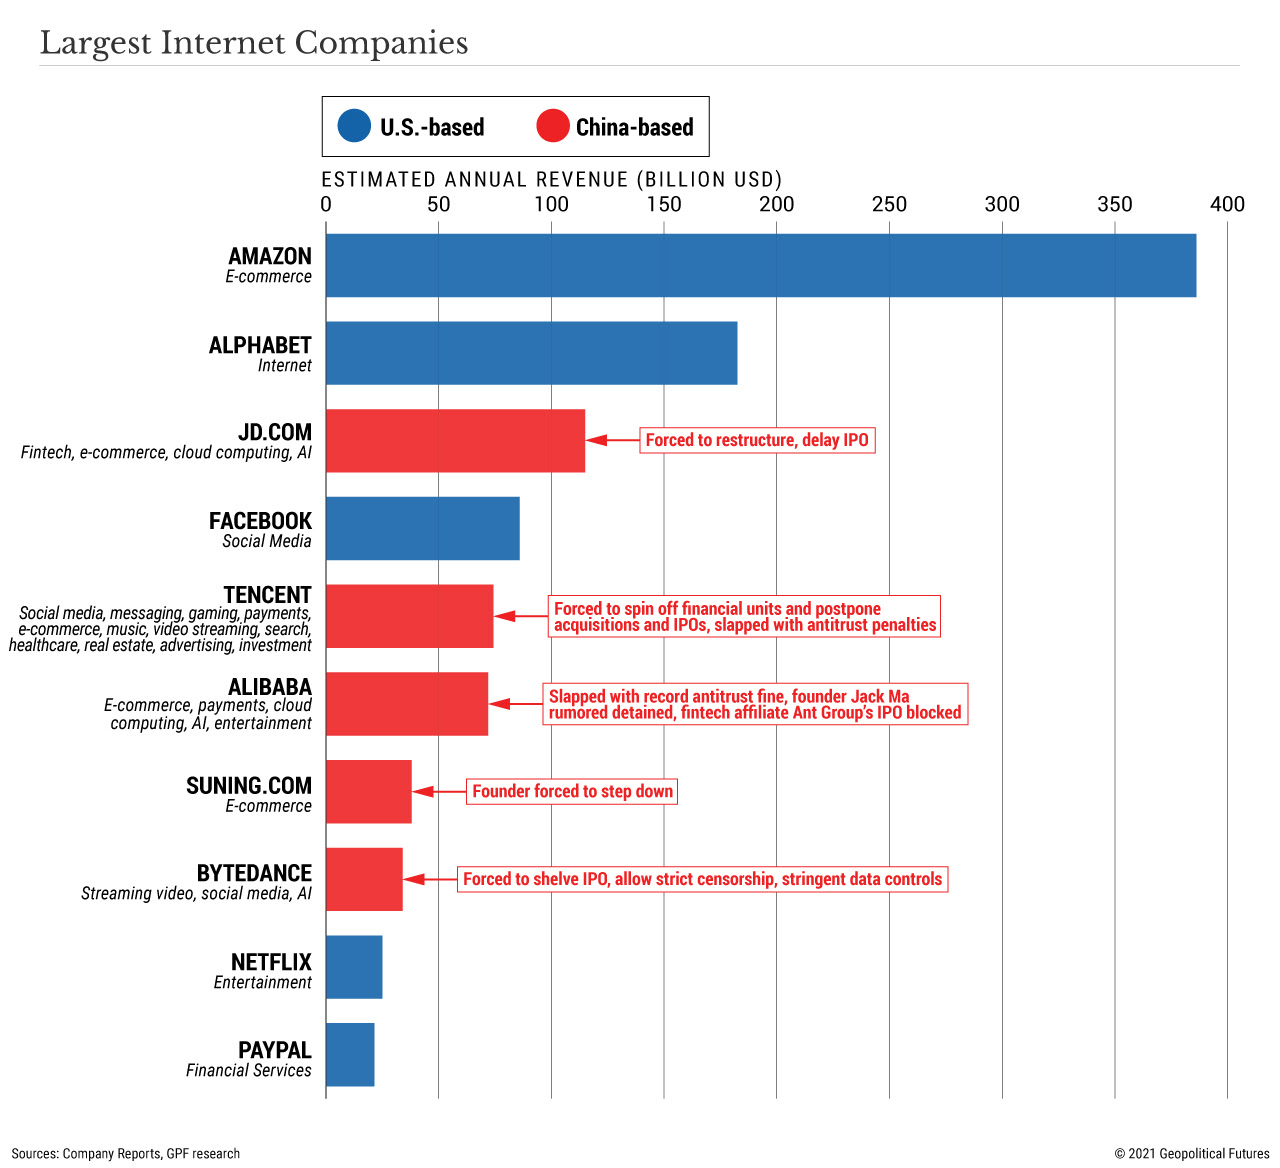
(…) What’s clear is Beijing doesn’t just fear the wealth and potential for influence of its increasingly rich tycoon class; it fears the very empires they’ve built. This is partly because they’re playing increasingly indispensable roles in Chinese society, meeting needs the Communist Party can’t, thus making them more difficult to bring to heel. It’s also because the sources of their commercial power are often the same as those the party has traditionally relied on for its own preeminence and survival. (…)
Beijing also passed a major new data security law that gives the country’s main cybersecurity agency sweeping new powers over the tech sector, including the ability to block overseas listings. Altogether, the moves have wiped out nearly $850 billion in market value for Chinese tech firms since February.
The scope of the campaign underscores just how many potential emerging threats the CPC believes it’s trying to head off. Holding onto power, governing 1.4 billion people, and sustaining China’s ascendency requires, in the CPC’s view, several things that Chinese tech giants theoretically could undermine. For example, it needs control over information – that is, the ability to drive national narratives, stamp out dissent and signal clear directives to the vast machinery of the Chinese state. It needs the ability to act decisively and aggressively against financial risk. It needs the ability to overwhelm security threats before they take root. It needs to prevent the proliferation of competing centers of power – from allowing its tycoons to turn their wealth into excess political influence and returning China to the exceedingly factionalized environment that existed before Xi’s takeover. And it needs unquestioned recognition of the CPC’s primacy and indispensability in the project of national rejuvenation.
Why China Needs Them
In some ways, though, this is what Beijing wants. Rebalancing the Chinese economy from exports to services and domestic consumption has long been the ideal but often elusive goal for Chinese policymakers. To the extent that China can progress toward this goal, these companies will surely lead the way. They expand the reach of Beijing’s propagandists and give homegrown entertainment industries a leg up over potentially problematic foreign ones. They facilitate state surveillance. They ease China’s own dependence on foreign technologies. Their financial services arms help offset endemic structural flaws in the Chinese banking system that traditionally struggles to get liquidity to small, private businesses. They shore up Hong Kong’s role as a global financial center. They pioneer all sorts of data-driven technologies that will define the next generation of warfare. They deepen the sense among Chinese citizens that China, under the CPC’s guidance, has rapidly emerged as an advanced, innovative power with homegrown technologies competing against the West’s finest.
They can be valuable for Beijing’s foreign policy objectives, too, by, say, deepening economic dependencies on China and/or mining for political clout in foreign capitals. Tencent, for example, has invested more than $50 billion in some of America’s most promising tech firms, including Snap, Spotify, Shopify, Stripe, Tesla and Zoom. China’s tech firms can help Beijing shape narratives about the country abroad. The more WeChat users there are in, say, Indonesia, the more power Beijing ostensibly would have to censor stories about Chinese activities around Indonesia’s Natuna Islands in the South China Sea. In general, the more data from Chinese tech abroad flows back to the mainland, the more Beijing can probe for strategically or economically valuable insights. (See, for example, the face-palming problems the U.S. military ran into with fitness apps.)
Of course, this works only if these companies comply with Beijing’s wishes – demands on censorship, data-sharing, financial oversight and so forth. And more often than not, what Beijing wants is less than ideal for these companies’ bottom lines. Huawei, Tencent, Bytedance (owner of TikTok) and others have already lost access to foreign markets over suspicions of Beijing.
This underscores why Beijing is acting with such urgency to lay down new rules for the sector today. Chinese tech giants are only going to get bigger and more vital as the digital economy steadily expands – as control of data becomes ever-more crucial in the balance of power both at home and abroad. The CPC can’t live with the threats they embody, but it can’t survive without the services they provide. Beijing, then, is trying to have the best of both worlds by doubling down first and foremost on its own control. It’s making it clear that it can’t and won’t sacrifice its primacy for the sake of economic vitality or technological innovation or anything else – and that Chinese tech titans are welcome to lead the country into the future so long as they do it on Beijing’s terms.
BTW, just last week, after the Didi crackdown: China Plans to Exempt H.K. IPOs From Cybersecurity Reviews
China plans to exempt companies going public in Hong Kong from first seeking the approval of the country’s cybersecurity regulator, removing one hurdle for businesses that list in the Asian financial hub instead of the U.S., according to people familiar with the matter. (…)
The Cyberspace Administration of China will vet companies to ensure they comply with local laws, but only those headed to other countries such as the U.S. will undergo a formal review, the people said. (…)
Bankers briefed by the CSRC came away with the impression that the approval process for Hong Kong would be less onerous than for the U.S. (…)
The shifting regulations threaten the plans of about 70 private firms based in Hong Kong and China that were set to go public in New York, according to data compiled by Bloomberg. Chinese companies have raised about $76 billion through first-time U.S. share sales over the past decade.
Pretty clear that Xi’s crackdown on Chinese companies listed in the U.S. or planning to list seeks to drive those companies from New York to Hong Kong.
Another type of crackdown:
The Internal Revenue Service seeks documentation of customers who have undertaken crypto transactions equivalent to $20,000 or more on the venue between 2016 and 2020, the Department of Justice announced in April. U.S. District Judge Richard Stearns acceded to the IRS summons, writing that “there is a reasonable basis for believing that cryptocurrency users may have failed to comply with federal tax laws.” (ADG)
Evergrande Resumes Downward Spiral as Investors Prep for Crisis
Investor doubts over troubled developer China Evergrande Group turned into panic on Monday as a creditor’s successful demand to freeze some assets underscored concern over the company’s ability to raise funds.
The company’s shares plummeted 16% to close at a four-year low in Hong Kong, while its listed electric vehicle unit sank 19%. Evergrande’s bonds fell.
A Chinese court froze a 132 million yuan ($20 million) deposit held by Evergrande’s main onshore subsidiary, Hengda Real Estate Group, at the request of China Guangfa Bank Co., according to a court ruling released on July 13 that circulated among traders over the weekend. Evergrande said in response it will sue Guangfa Bank, with the loan not coming due until March, according to a statement. (…)
“Pandemic of the unvaccinated”
Coronavirus cases, hospitalizations and deaths are back on the rise in the U.S. as the highly transmissible Delta variant spreads across the country, Axios’ Sam Baker writes. This is happening almost exclusively to people who aren’t vaccinated, and it’s worse in places where overall vaccination rates are low.
The U.S. is now averaging about 26,000 new cases per day — up 70% from the previous week, the CDC says. Hospitalizations are up 36%, and deaths are up 26%, to an average of 211 per day.
- Two-thirds of eligible Americans have gotten at least one dose of a COVID-19 vaccine, and about 57% are fully vaccinated.
- Over 97% of the people currently hospitalized for severe COVID-19 infections were unvaccinated, according to the CDC.
A handful of states with low vaccination rates — Arkansas, Florida, Louisiana, Missouri and Nevada — are driving a plurality of new cases.
- One in five new infections comes from Florida alone, per the CDC.
The good news: The vaccines work, even against the Delta variant.

 The end is nigh:
Some used cars worth more than new
“[C]ertain popular preowned models, such as the Kia Telluride and Toyota Tundra, are regularly selling for thousands of dollars more than the list prices of the brand-new versions as auto retailers run historically low on preowned vehicle inventory.”
Prices are even rising above 100,000 miles: “Car-shopping website Edmunds.com found that the average selling price for a used car with between 100,000 and 110,000 miles on it was $16,489 in June, the highest ever recorded and up from $12,626 a year ago,” per The Journal. (Axios)
 The anatomy of a ransomware attack Inside the hacks that lock down computer systems and damage businesses.
 (WaPo)


 (
(