PMI data hint at rising numbers of staff shortages
(…) Although growth of new orders accelerated globally in May to reach the highest since 2006, employment growth slowed marginally compared to April’s 14-year peak. This divergence meant global employment growth lagged demand growth to the greatest extent since 2010.
While the scale of the divergence itself is therefore not unprecedented, with a similar discrepancy seen in the immediate recovery from the global financial crisis recession, the slowing of jobs growth while new orders are accelerating is unusual in this context, notably given the speed with which demand is currently growing.
Looking further into the data, sluggish jobs growth relative to new orders growth is by far the most evident in the US, followed by the UK, France and Italy. Ireland and Spain also report a marked weakness of jobs growth relative to new orders, but the divergence is less notable in China, Australia and Brazil, while in Japan and (to a lesser extent) India, jobs growth exceeded new orders growth.
The US not only saw jobs growth lag demand to the greatest extent of all major economies, but the divergence was also the greatest recorded since data were first available in 2009.
Analysis of the anecdotal evidence provided by responding companies showed a rising incidence of firms struggling to fill vacancies, notably in the US but also in the UK.
(…) labour shortfalls were not confined to [pandemic-impacted] services, with auto makers and chemical producers among the worst-affected sectors gauged by the divergence between employment and order book growth.
In fact, over the past year, it is the manufacturing sector that has reported the largest shortfall of hiring relative to demand than services, though it is the latter which is now seeing the highest incidence of such problems as the global economic recovery broadens out from manufacturing to services. Global PMI data showed services growth overtaking that of manufacturing in April and May as Covid-19 lockdown measures eased. (…)


Now, we’ve been there before and the hope, or the Fed’s forecast, is that there will be a repeat of the post 2010 labor shortage when employment grew steadily and wage growth stayed around 2.0%. The major difference this time is that the unemployment rate is 5.8%, not 10% like in 2010.
Note how wage growth sharply accelerated from 2.0% to 3.5% right after the unemployment rate dropped below 5.5% in 2015 even though core inflation stayed stable around 2.0%.

In 2015, the labor participation rate was 62.8%, down from 64.6% in mid-2010. It is now 61.6%. The FOMC has explicitly targeted a return to the pre-pandemic level of 63.3%. Throughout the last decade, the participation rate among the 55+ age group (35M people) was 40%; it is now 38.4% as many older workers seem to have permanently retired.
At the other extreme of the age spectrum, the participation rate of the 16-19 group has risen a little from 36.2% in February 2020 to 36.8% but this 4.7M group cannot offset the older one from a supply nor from a cost standpoint.
Some pundits argue that swapping older for younger workers keeps inflation at bay because of the cost difference. It may help corporate margins if productivity is no offset but today’s WSJ informs us of a rather different kind of offset:
- Wage Gains at Factories Fall Behind Growth in Fast Food Workers find more opportunities as pay rises and demand for their labor increases
(…) For years, factory jobs paid significantly more than those in many other fields, especially for less-educated workers. That is changing, according to economists, manufacturers and federal data. (…)
Some workers recently left Haworth’s factory in the nearby town of Ludington for hospitality jobs, Ms. Harten said. Haworth is advertising assembly jobs for $14 at that facility—the same starting pay rate at a nearby Wendy’s restaurant. “Manufacturing can be taxing,” said Ms. Harten, who also believes enhanced Covid-19 unemployment benefits are discouraging some people from taking open jobs. (…)
Since the start of 2020, jobs in many industries including restaurants and retail have posted their highest-ever hourly wages relative to wages in manufacturing, according to an analysis of federal data by The Wall Street Journal. The $23.41 that hourly factory workers made on average in April is 27% more than average pay for retail workers, according to the Labor Department, down from a 40% premium for factory workers 10 years ago. Factory work pays 56% more than restaurant and fast-food jobs, the data shows, down from 83% a decade ago. (…)
For many restaurant and grocery stores, the shortage of workers is the main drag on potential sales gains from customers eager to return to in-person dining and shopping. Executives at those companies say that demand is encouraging them to raise wages. For manufacturers, though, labor shortages are compounded by tight supplies and high prices for materials from steel to lumber to resin. Those added costs are restricting their ability to raise wages, executives said.
(…) manufacturers face more pressure to hold down wages than some service employers because they compete with factories around the world rather than restaurants around the corner. (…)
Not mentioned in the article is that rising wages at the bottom of the scale eventually pushes the whole scale upward.
- Rising Inflation Looks Less Severe Using Pre-Pandemic Comparisons Annual inflation hit a 13-year high in May, but annualized price growth from 2019 was more modest
(…) The base effect can be illustrated by calculating price changes from two years prior, instead of one year prior, and annualizing those figures. That adjustment puts inflation from pre-pandemic levels at 2.5%, rather than 5.0%, which is closer to the Fed’s 2% target rate. (…)
Yes, but:
1. Both CPI and Core CPI are above trends (+0.8% for core and +1.3% for total CPI) and accelerating:

2. This in spite of below-trend Services inflation (62% of CPI, 78% of core CPI). Demand for many services is just starting to recover. According to the Chase Consumer Card Spending Tracker as of June 14, spending in restaurants is 8% below pre-Covid trends, lodging -30%, airlines -21% and other travel and entertainment -10%.

- Chip Shortages Are Starting to Hit Consumers Semiconductor companies say they face higher costs that they are passing on to customers in some cases.
Price increases are snowballing their way through suppliers and key materials in chip making as the industry rushes to meet rising demand and plug supply holes. As a result, many of the world’s large chip makers are raising prices they charge to the brands that make PCs and other gadgets. Industry officials say the increases may continue.
Consumers are starting to feel the pinch. Prices of popular models of some laptop computers have crept up over the past two months, among other electronics becoming more expensive at retailers. A laptop geared toward videogamers—made by Taiwanese manufacturer ASUSTek Computer Inc. —that Amazon lists as its bestseller rose from $900 to $950 this month, according to Keepa, a site that tracks prices. The cost of a popular HP Inc. Chromebook rose to $250 from $220 at the beginning of June.
HP has raised consumer PC prices by 8% and printer prices by more than 20% in a year, according to Bernstein Research. (…)
Customers understand the situation and have been willing to stomach higher prices, he said on a call with analysts this month. (…)
In some cases, the pricing data doesn’t yet reflect the most recent cost increases seen across the semiconductor supply chain, said Dale Ford, the chief analyst at the Electronic Components Industry Association. Prices also are often set in longer-term contracts, he said, delaying when they are adjusted for market forces.
“Raw-material costs have gone up more recently, and I think people are now saying this is not a temporary situation,” Mr. Ford said. “Price increases are going to be durable.”
There is both demand pull and cost push inflation. Another example, courtesy of Axios:
- Companies are increasingly turning to the sky to try to keep up with America’s demand for stuff. They’re now relying more on planes to carry inventory — rather than getting clothes, shoes and other goods shipped by sea from abroad.
It’s an attempt to get around the supply chain snafus already hitting consumers — who have fewer stocked items to choose from and higher price tags because companies are paying more for goods themselves. Sellers are warning that items could run out more quickly this year during Amazon Prime Day, according to CNBC.
Companies have used planes to get cargo from overseas before — but it was roughly 10 times more expensive than ocean freight, according to the National Retail Federation’s Jon Gold. But it’s more comparable now since sea shipping costs have skyrocketed. (…) “I don’t know if the airlines have the capacity to take up as much slack as is needed,” says Gold, who focuses on supply chain issues.
Did Powell just run for the hills? (Nordea)
It seems as if chair Powell is already running for the hills in the average inflation targeting relationship. A few months of vastly overshooting actual inflation and Powell and the FOMC aborts the AIT-regime. This was almost faster than even we dared to anticipate, even if we have been clear frontrunners in calling for an early tapering discussion within the Fed due to the spike in inflation that would arrive in Q2.
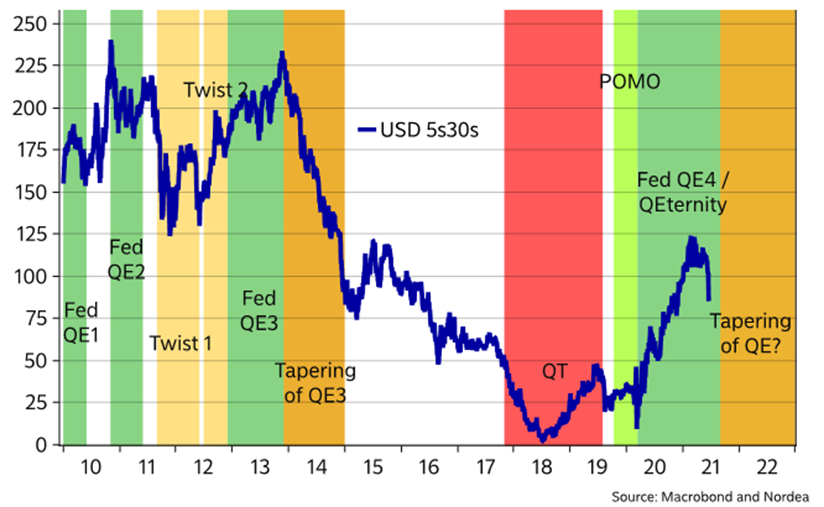
After Powell ran for the hills, yield-curve-steepenistas started running for their lives with 5s30s flattening as if tapering had already been launched. Taper talks ought to be ultra-good news for 2s5s steepeners, but bad news for those who betted on the Fed allowing a complete melt-up in inflation expectations and activity that could take 30yr bond yields much higher. USD 5s30s flattened 150 bps during the 12-month tapering period in 2013/2014. What about in 2021/2022, if Fed tapers already in September?
Markets starting to trade as if tapering was already launched
It is counterintuitive from a supply/demand perspective that the long end of the curve tends to flatten during an actual tapering scenario, but it is a very stubborn historical pattern.
We find that there are two effects in play. First, the market positioning is always caught wrongfooted when tapering actually starts. Right about everyone enters the tapering period betting on steeper curves and higher long bond yields, why positioning is a roadblock for a further move in those directions. This is also the case this year.
Second, we find that QE is an important part of the expectation formation as QE leads to reflationary vibes, higher long-term inflation expectations and a larger outcome space for inflation long-term. Withdrawing stimulus (tapering) leads to the opposite. Less activity, less inflation, and contained expectations.
Lower long bond yields always occur OUTSIDE of QE programs
The USD is usually the biggest gainer from a steeper 2s5s in the USD curve, while the EUR is ranked much lower on the leaderboard in such a scenario. EM FX is also one of the high-risk positions in such a scenario, while also the SEK (and partly NOK) looks to be at risk of a summer sell-off.
We are almost as certain as we can be that paying the USD belly will prove to be a good bet this summer, as our main thesis is that tapering will arrive early, while the Fed subsequently will use aggressive forward guidance to contain lift-off expectations. Sounds like a perfect 2s5s steepener. (…)
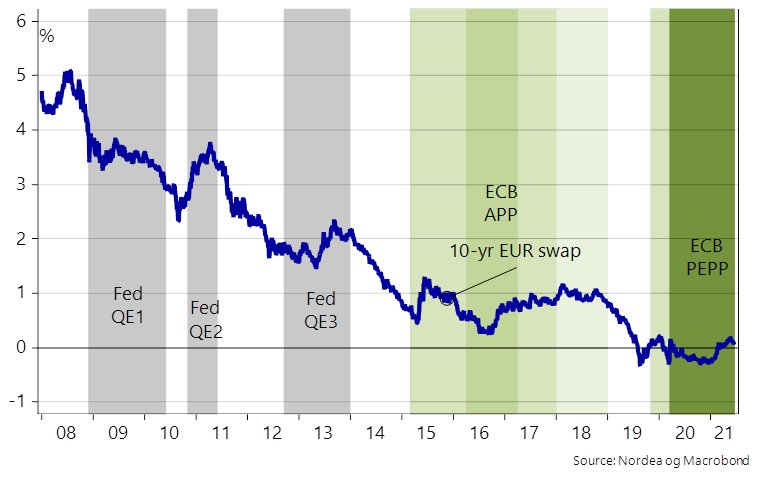
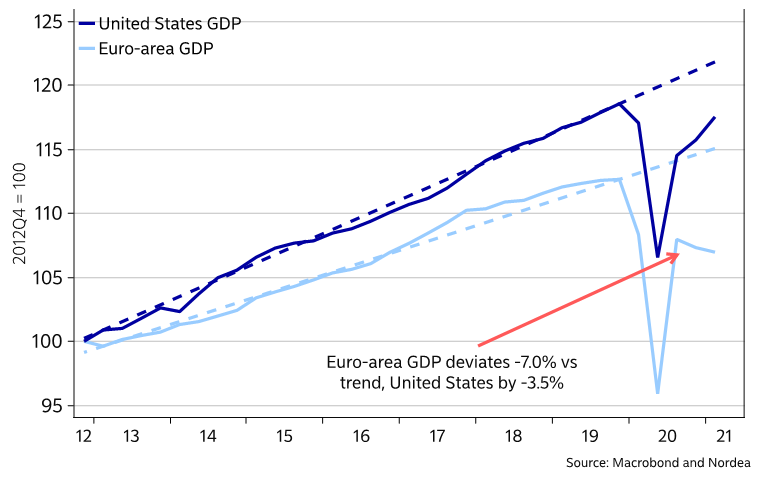
We remain Fed hawks and expect inflation to surprise positively also in coming months, which should beget more hawkish surprises. So, we’d argue we just got a hawkish shift from the Fed, while across the pond, Lagarde has started to act more like Draghi did, pre-committing the ECB to a dovish stance and daring her colleagues to not fulfil the market’s expectations. Hence we’d argue we have just seen a dovish shift from the ECB.
Why Fed ought to be much more hawkish than the ECB – in one chart
And there is also this development:
The delta variant of the virus is contagiously spreading in the UK, and even more recently Portugal and is, according to WHO chief scientist, “well on its way to becoming the dominant variant globally because of its increased transmissibility”. A study by Public Health England finds that Pfizer-BioNTech’s jab has an efficacy rate of 88 % after 2-shots, however, only 33% after the first dose. The AstraZeneca vaccine shows an efficacy of 66% after 2 doses.
There are elements of uncertainty associated with this study, firstly it only included 1.054 positive cases of the delta variant, and secondly, differences in efficacy rates may also be explained by the rollout of second doses. The AstraZeneca second dose have been given later than the Pfizer shots, and antibody profiles show that it takes longer to reach maximum effectiveness with the AstraZeneca Vaccine.
The transmission in Portugal is predominantly in Lisbon where around 60% of the new cases are of the delta strain, which has forced the government to impose restrictions for weekend travels in and out of Lisbon. The Portuguese government also reports that 66% of the daily cases last Friday in Portugal was in the Lisbon region. In the UK, the delta variant comprises 91% of sequenced cases, and 99% of cases are estimated to be from the delta variant.
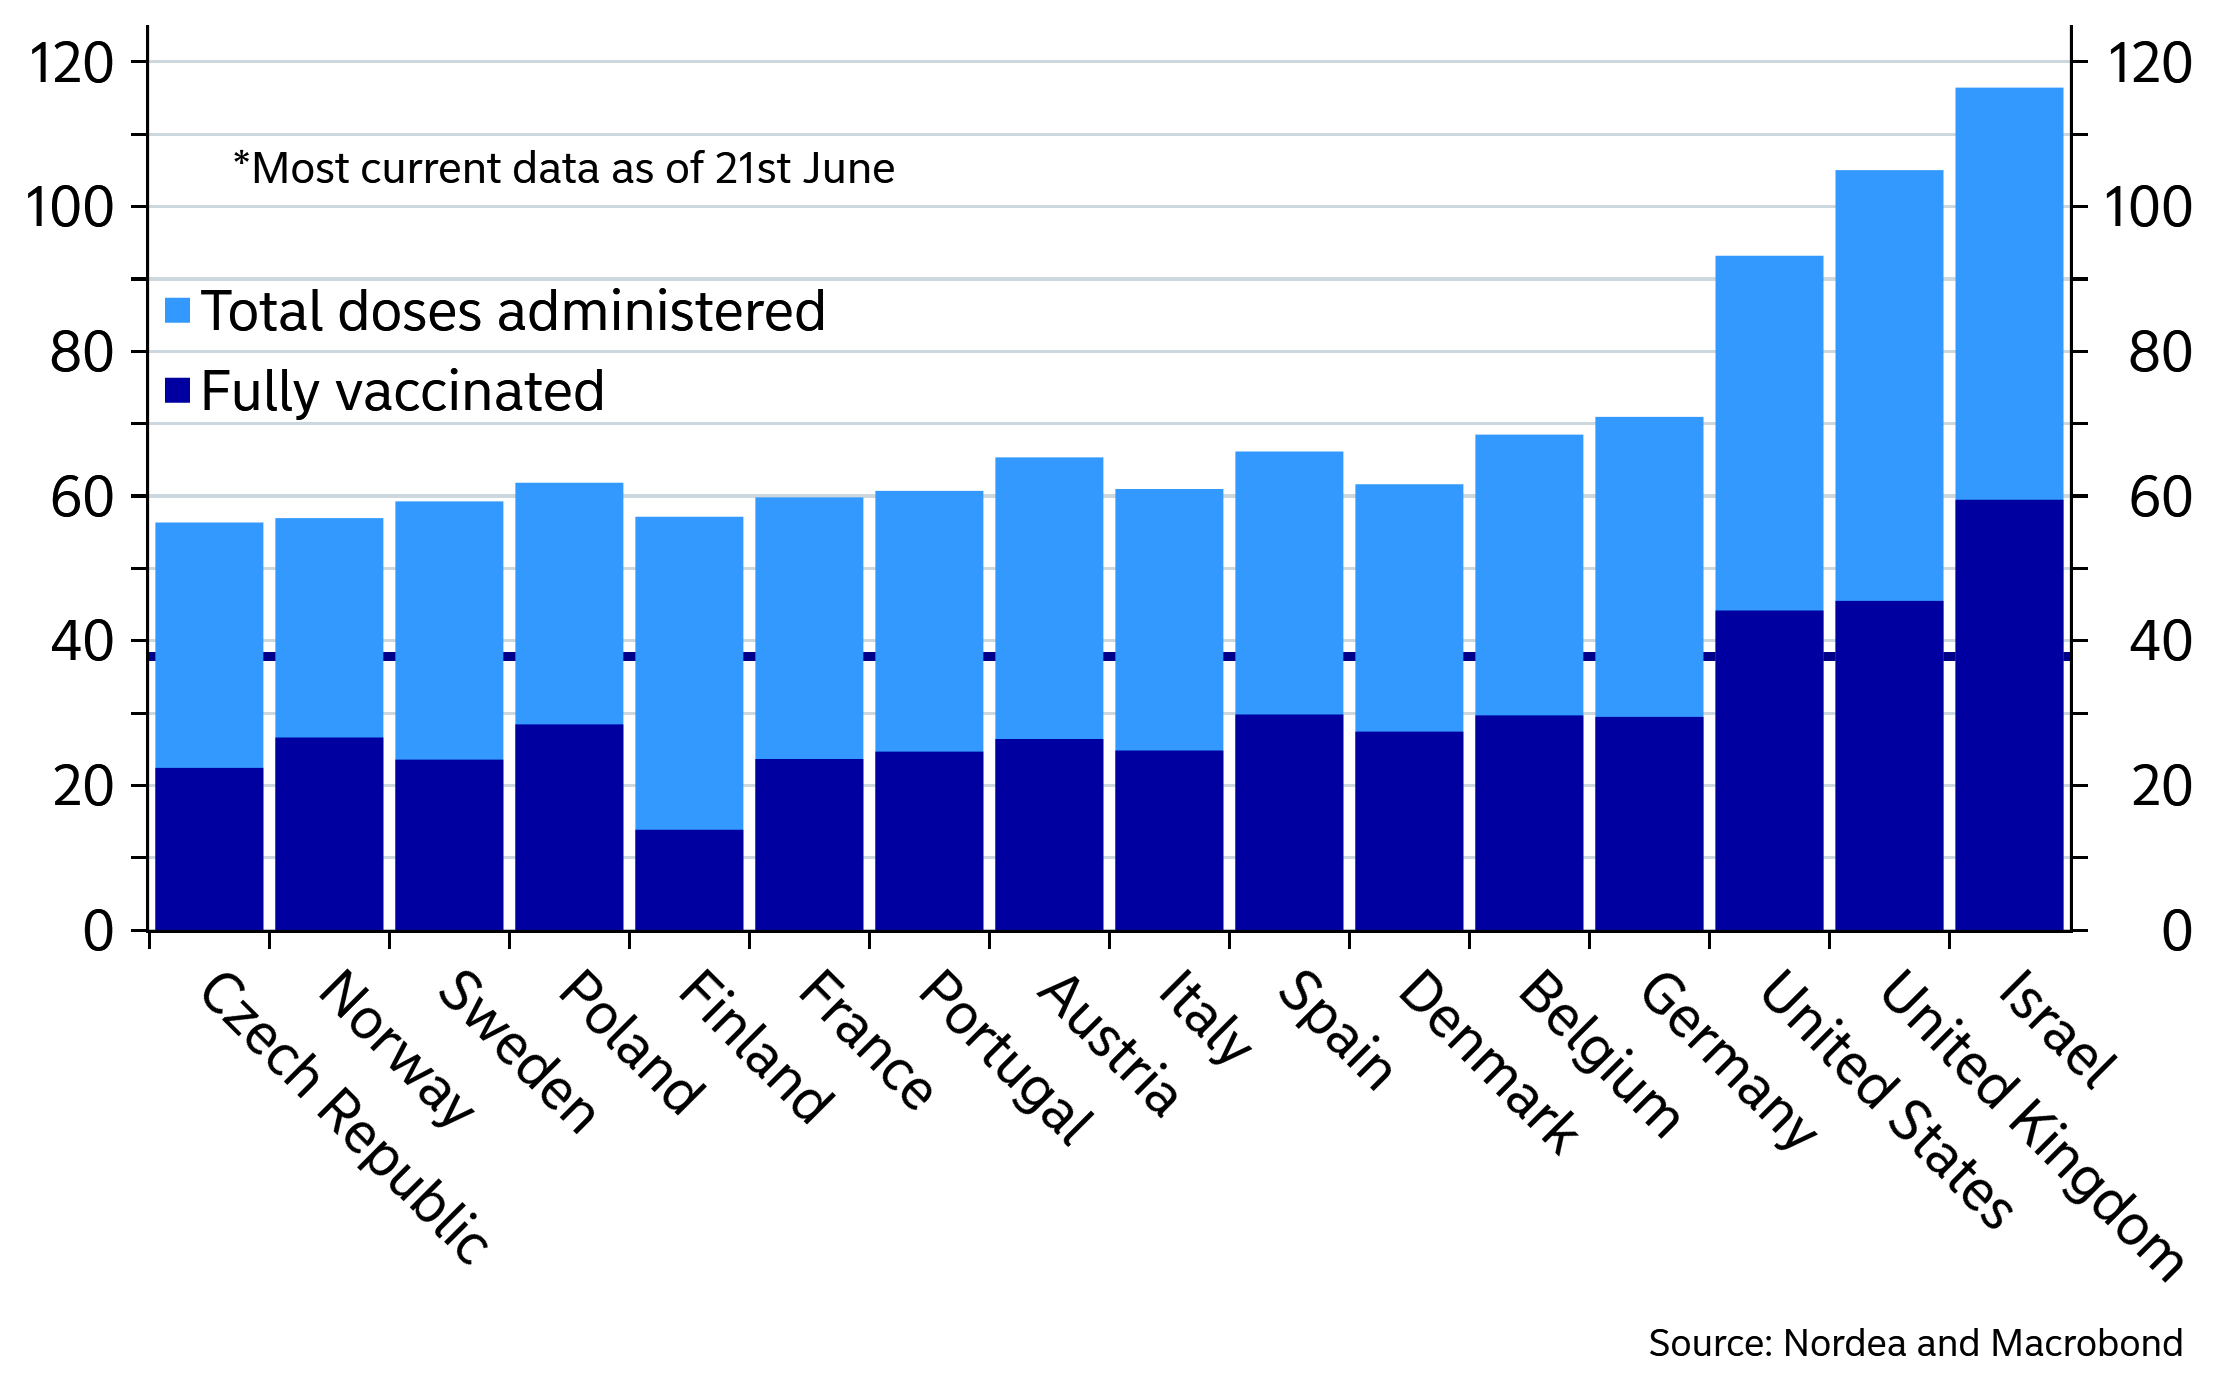
With the rapidly growing delta-spread in Portugal and as the EU evidently lags behind on vaccinations compared to the UK, the EU questions regarding the emergence of the delta variant changes from “if” to “when”.
Doses administered as percent of population
And this other one:
- South America Is Now the World’s Covid-19 Hot Spot While Covid-19 is receding in much of the world, the pandemic is raging in South America, which has just 5% of the world’s population but accounts for a quarter of the global death toll.
But back to the discussion about wages, inflation and bond yields, at some point we might have to consider the risk that consumer demand may get impacted by prices rising faster than wages. Not happening just yet, other than for durable goods. Consumers may be willing to pay more now, but they could eventually become unable to pay more

Fed’s Williams Not Ready to Pare Aid, but Other Officials Talk Tapering New York Fed chief John Williams says the central bank is a ways off from achieving its job and inflation goals.
“It’s clear that the economy is improving at a rapid rate, and the medium-term outlook is very good,” Mr. Williams said in a virtual appearance Monday. “But the data and conditions have not progressed enough for the [Federal Open Market Committee] to shift its monetary policy stance of strong support for the economic recovery,” he said.
Earlier Monday, the leaders of the Dallas and St. Louis Fed banks said that the day for paring back the central bank’s bond-buying stimulus is growing closer. (…)
Speaking with reporters after his formal remarks, Mr. Williams acknowledged that officials are talking about paring asset purchases, but said that he isn’t ready to call for such a move and that policy makers haven’t yet discussed the tactics of slowing the bond buying. (…)
Mr. Kaplan, reiterating a view he has held for some time, said, “I’ve been more of a fan of doing some things, maybe, to take our foot gently off the accelerator sooner rather than later so that we can manage these risks” around the recovery process, in a bid to “avoid having to press the brakes down the road” with a more abrupt shift in monetary policy.
Meanwhile, Mr. Bullard said that when it comes to asset buying “the debate is open, and I think it’s appropriate” that the Fed is considering when to pull back. He added that the process of getting to such a tapering decision won’t happen super quickly, saying, “The committee is only now starting to talk about tapering, and that will take some time to get that organized.”
Neither Messrs. Bullard or Kaplan holds a vote on the rate-setting FOMC this year, but Mr. Williams does given his role as vice chairman of that body. (…)
Mr. Bullard also said in the Monday appearance that the Fed should give special consideration to its mortgage bond purchases given that they are happening in an economy with a strong housing market, adding that “there’s a good question there about whether it’s time to retire our intervention” into housing finance.
Mr. Kaplan concurred and said, “At this stage we’re questioning whether the housing market really needs this Fed support of $40 billion a month” in mortgage bond purchases. (…)
- Ex-deputy governor warns Bank of Canada against ‘mission creep’ The bank should focus on maintaining or adjusting its core inflation targeting mandate, and avoid adding policy goals explicitly tied to unemployment, inequality or climate change
(…) “By putting too much on the central bank, you risk eroding its independence, its effectiveness through monetary policy … and taking responsibility away to a degree from those who really should be sharing it,” Mr. Murray said in an interview before the publication of his report, Mission Creep and Monetary Policy. (…)
The Bank of Canada has given little indication it is moving in any of these directions. But it is undertaking its most ambitious review since the 1980s, weighing different monetary policy models, including a “dual mandate” that targets full employment alongside inflation, and an “average inflation” model, which would let inflation run above or below target to make up for recent misses. (…)
“An explicit target for full employment requires that the central bank fix as a target something that it doesn’t have any influence over, at least the structural side of unemployment over the long run,” he said. (…)
Investors account for a fifth of home purchases in Canada. Are they driving up housing prices in a booming market?
(…) With the Canadian Real Estate Association (CREA) reporting the national average home price is 38 per cent higher than a year ago, real estate investors are being accused of driving up prices. (…)
It defines investors as borrowers who obtain a mortgage to buy a property while maintaining a mortgage on another property. It does not include all-cash transactions and only goes back to 2015, when the country’s real estate market was already frothy. (…)
Andy Yan, housing expert and director of Simon Fraser University’s city program, said investors are able to take bigger risks than home buyers who intend to live in their home as the investors can tap their existing assets to offer higher prices. “They have a greater set of moves than homeowners. They have more financing, more capital and higher risk capacities,” he said. (…)
And they benchmark against central bank-created negative real interest rates.
LIQUIDITY WATCH
“Earnings don’t move the overall market; it’s the Federal Reserve Board…focus on the central banks and focus on the movement of liquidity…most people in the market are looking for earnings and conventional measures. [But] it’s liquidity that moves markets.” – Stan Druckenmiller
- John Authers: Following the Money Suggests Stocks Have a Problem
(…) Rather than worry about when the Fed will formally taper off the purchases of assets it makes each month, it might make better sense to look at the actual trends in money supply growth and fiscal stimulus. Tapering, when it happens, will involve a reduction in the speed of the Fed’s purchases, rather than an actual decrease in the assets it holds. In other words, it will be a “second derivative” change. This is often what matters most in financial markets.
But if we look at the growth of money supply and the federal deficit in annual terms, we find that both are falling sharply. The change in the second derivative has already arrived, in a big way. This chart is from James Paulsen, chief strategist at Leuthold Group in Minneapolis:
Simple measures like this may be the best. With growth in new sources of money suddenly decreasing, Paulsen classifies both fiscal and monetary tightening as extreme — and just eyeballing the chart shows that this is about as fast as deceleration gets. On that basis, the odds of a forthcoming fall in the stock market become very significant:
(…) To look at this in more detail, Crossborder Capital Ltd. of London keeps indexes of central bank liquidity growth globally. This shows a global deceleration, which is most marked in the U.S., and which uncoincidentally peaked roughly when bond yields topped out in early April:
The Fed isn’t tapering its asset purchases, but it is far less directly involved in pumping money into the system through the repo market. Also, critically, this isn’t being counterbalanced by a rundown in the Treasury General Account, which was built up in the early months of the Covid crisis to cover all eventualities. (I wrote about this complicated issue here.) As Crossborder Capital summarizes:
U.S. monetary base growth has plummeted to 7%: it peaked at 78% only 10 weeks ago. It is driving the downturn in policy liquidity expansion. ECB and Bank of England liquidity growth also peaked in April but the downturn has been less pronounced. Meanwhile, the People’s Bank of China, and now the Bank of Japan too, look to be moving in the opposite direction
If liquidity growth begins to fall, that implies problems for stocks. For months, the market has splashed in more cash than it knows what to do with. On the model used by Crossborder Capital, that suggests a risk that liquidity leaves too soon. The logic is that if there is a lot of money around, it has to go somewhere. If there are more liquid or safe assets in circulation, it isn’t unsafe for a proportion of them to go into stocks. But this theory is vulnerable not only to the numerator increasing (share prices going up), but also to the denominator decreasing, as money supply is reined in. When equity holdings reach prior peaks as a share of world liquid assets, that is cause for concern about share prices, and it happened earlier this month:


Individuals also seem filled up: @MebFaber
Morgan Stanley’s Michael Wilson concurs: “we are on the other side of the mountain with respect to monetary accommodation for this cycle.”


The Oldest Technical Trading System Just Triggered a Sell Signal
For the first time in over a year, one of the oldest forms of technical analysis has triggered a sell signal.
There is no “official” record of buys and sells according to Dow Theory, but the basic setup is fairly standard.
“The Dow theory is a financial theory that says the market is in an upward trend if one of its averages (i.e. industrials or transportation) advances above a previous important high and is accompanied or followed by a similar advance in the other average.
A reversal in the primary trend is signaled when the market is unable to create another successive peak and trough in the direction of the primary trend. For an uptrend, a reversal would be signaled by an inability to reach a new high followed by the inability to reach a higher low. In this situation, the market has gone from a period of successively higher highs and lows to successively lower highs and lows, which are the components of a downward primary trend.” – Investopedia
When we’ve looked at this in the past, we’ve used the historical record of buy and sell signals from TheDowTheory.com, a site specializing in analyzing these signals. It’s unknown whether they consider Friday’s moves in the Dow Industrials and Transportation averages to be a sell signal. Still, it does meet the criteria, or if not, it’s close enough to consider. Trying to split hairs based on arbitrary rules is silly – it’s the concept that counts.
For a sell signal, both averages should:
Set a new high
Pull back in a reaction against those new highs
Rebound by 3% or more but without setting a higher high
Decline below the pullback low
Since the year 1900, there have been 47 prior sell signals. Not surprisingly, the Dow Industrials have not responded well.
Over the next three months, the Dow managed to rally only 34% of the time. Across all time frames, the risk/reward was skewed toward “risk” and the Dow’s median return was at least 2 standard deviations below random.
If there’s any solace here for investors, it’s that sell signals since the end of the financial crisis have mostly been terrible. They would have prevented some uncomfortable losses in 2011, 2018, and 2020, and a few other modest ones. But all were brief and ended up leading to gains during the next 3-6 months.
BTW:
- California will pay off accumulated unpaid rent that piled up during COVID-19, fulfilling a promise to help landlords break even and giving renters relief. Go deeper.
- Evergrande Debt Woes Deepen With Fitch Downgrade, Wary Banks
(…) Bonds of the world’s most indebted real estate company slumped on Tuesday after Bloomberg reported several large Chinese banks are restricting credit to the firm and Fitch Ratings downgraded it deeper into junk territory. (…)
Three banks with a combined 46 billion yuan ($7.1 billion) of credit exposure to Evergrande as of June 2020 have decided in recent months not to renew loans to the company when they mature this year, according to people familiar with the matter. The decisions were made before Evergrande’s bonds began tumbling at the end of May and resulted from banks’ internal risk assessments, they said, asking not to be identified discussing private information.
Three other banks are allowing Evergrande to roll over portions of credit lines it has already tapped but are limiting the company’s access to any untapped credit from those lines, the people said. These banks decided against a more restrictive stance partly due to concern that a large reduction in lending to the developer could destabilize China’s financial system before the politically sensitive 100th anniversary of the Communist Party on July 1, the people said. (…)
- Google Faces EU Antitrust Probe of Alleged Ad-Tech Abuses The European Union opened a formal antitrust investigation into allegations that Google abuses its leading role in the advertising-technology sector, the most wide-ranging case yet to look at that pillar of the tech giant’s business.


