U.S. Spending Boost Is Adding Fuel to Economic Growth Consumer spending rose 0.5% in April as Americans extended a spending binge and continued to catch up on activities they held off on during the pandemic, propelling a broad economic recovery.
(…) After months of buying goods from the safety of their homes, Americans are increasingly comfortable enough to go out in public and buy things in person, a shift that economists say is crucial to getting the economy running at full speed again. Spending on services, which account for the bulk of all consumer purchases, rose 1.1% last month; spending on goods fell 0.6%.
(…) household income was 11% higher than in February 2020, the month before the pandemic hit the U.S. Households have saved about $2 trillion more than they would have absent the pandemic and federal relief efforts in response to it, according to Morgan Stanley. (…)
The Commerce Department’s inflation measure showed consumer prices rose 0.6% in April from a month earlier and 3.6% from a year earlier. Core prices, which exclude energy and food, rose 0.7% over the month and 3.1% over the year. (…)
It is not easy to effectively and objectively analyse consumer data given the pandemic rescue payments, base effects and uneven re-openings. To me, the most important stats from Friday’s income and expenditures data are the following ones:
- Wages and Salaries rose 1.0% MoM, after +1.0% in March, +0.1% in February and +0.8% in January. That is a +9.0% annualized rate in the first 4 months of 2021. W&S are now 4.3% above their February 2020 level while some 8 million more workers remain on the sidelines.
- Total personal expenditures diverged from aggregate payrolls (employment x hours x wages) for the second consecutive month and are up 4.6% from their February 2020 level, against +1.8% for labor income. Americans are beginning to dissave as confidence returns and the economy reopens.

- Importantly, March expenditures were revised up, from +4.2% MoM to +4.7%. Not insignificant although not mentioned by the media/pundits.
- Spending on durable goods remains very strong even as spending on Services is gradually recovering. Pent-up is still winning over spent-up.

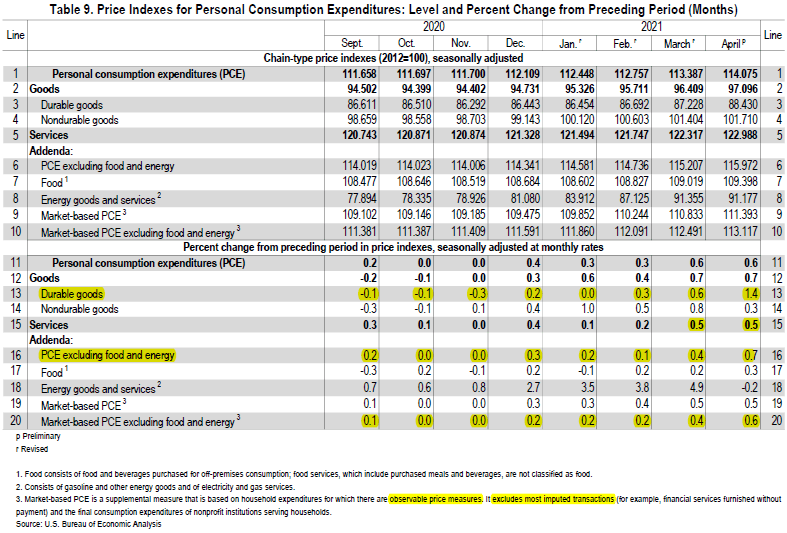
- Core PCE inflation, normally more subdued than core CPI inflation, has been rising at the same pace since January and is now even at +3.0% on a YoY basis. In the last 2 months, core PCE inflation is +6.7% annualized. Even if transitory, that ought to be a surprise to the Fed.

- Sequentially, trends in core inflation rates are worrisome:

- Inflation on durable goods has sharply accelerated on strong demand and constrained supply but inflation on services is also quite strong at +6.0% annualized in March-April. Spending on services is not back to its pre-pandemic level yet. Note the strength in “ Market-based core PCE”, also at +6.0% annualized. This measure is totally objective as it excludes most imputed prices.
- Goldman Sachs seeks to reassure us that “transitory” is the right qualifier: “We forecast core PCE inflation of 2.50% at end-2021 (up from 2.3% previously), 2.10% at end-2022, 2.15% at end-2023, and 2.20% at end-2024 based on our bottom-up inflation model.”
- But its own key inflation drivers are all pointing upwards:
- Its composition-Adjusted wage tracker (light blue) is holding steady at 3.0% but pre-pandemic trends were all clearly upwards and its actual wage tracker (blue), at 4.0%, is back on trend. Worker shortages amid booming demand and rising minimum wages could surprise.

- “Recent dollar weakness points to further moderate upward pressure on import prices.” If the recent dollar weakness continues, upward presures could become less “moderate”.
- Commodity prices, including energy and ag, may not have peaked just yet as supply issues could well endure after years of under-investment.
From a WaPo biz piece last Saturday:
(…) No one in Wildwood seemed to have enough help. Businesses were getting desperate and creative. Raising wages. Dangling bonuses. Busing in workers from neighboring counties. Sharing workers with competitors. Cutting back hours. Turning to family and friends.
“Help Wanted” signs were everywhere. The main highway into town was dotted with billboards from Morey’s offering $15 an hour — well above the state’s $11.10 seasonal worker minimum wage. A sign outside the Douglass Candies store on the boardwalk advertised $13 an hour, plus a $150 signing bonus and $50 for getting vaccinated.
“I think it’s going to be a banner year. I just need to find more workers,” said Jason Dugan, co-owner of the popular candy store. (…)
Baralos said he had already raised prices — 50 cents here, $1 there. He’d ordered new laminated menus. The kids breakfast — two eggs, pancakes or French toast with meat — was now $7.99, a dollar more than last summer. (…)
How transitory will these new laminated menus be?
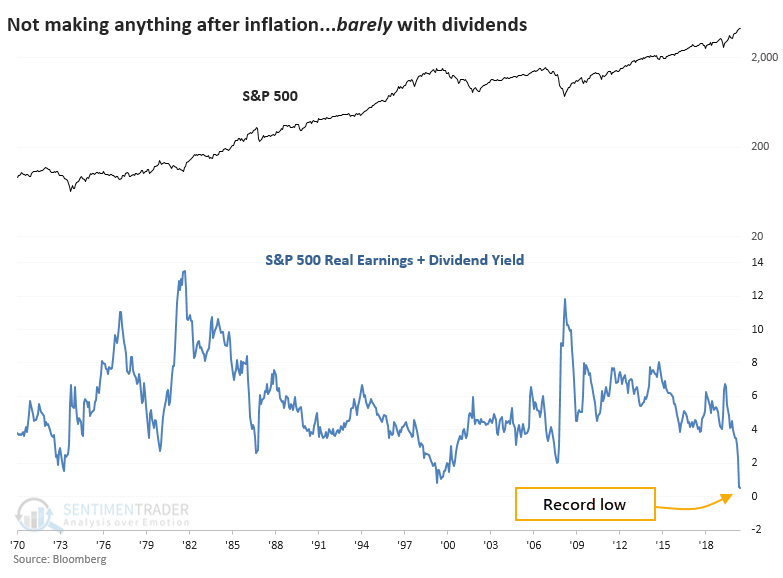
Last week I offered this chart and comment from SentimenTrader showing that there is little, if any, value/income backstop in this market.
When an investor in the S&P adds up her dividend check and share of earnings, then subtracts the loss of purchasing power from inflation, she’s barely coming out even. This is a record low, dating back to 1970, just eclipsing the prior low from March 2000.
Steve Blumenthal posted this chart from Lohman Econometrics which excludes dividend yields but adds visuals to the valuation risk. The recent sharp drop commes exclusively from the spike in inflation, underscoring the importance of the word “transitory”.

The YoY change in core CPI jumped from 1.3% in February to 3.0% in March. This added 1.6 points to the Rule of 20 P/E to 24.8 using the current 2021 estimated EPS of $189.61. We will get the May CPI data on June 10. An unchanged core would leave the YoY growth at 3.1%.
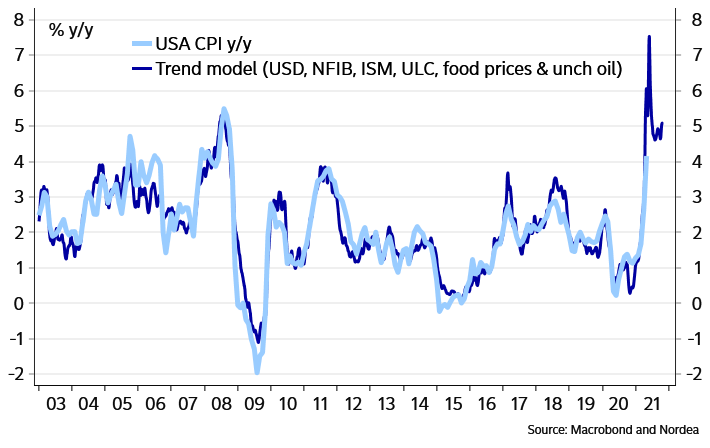
Nordea’s model on total CPI is scary:
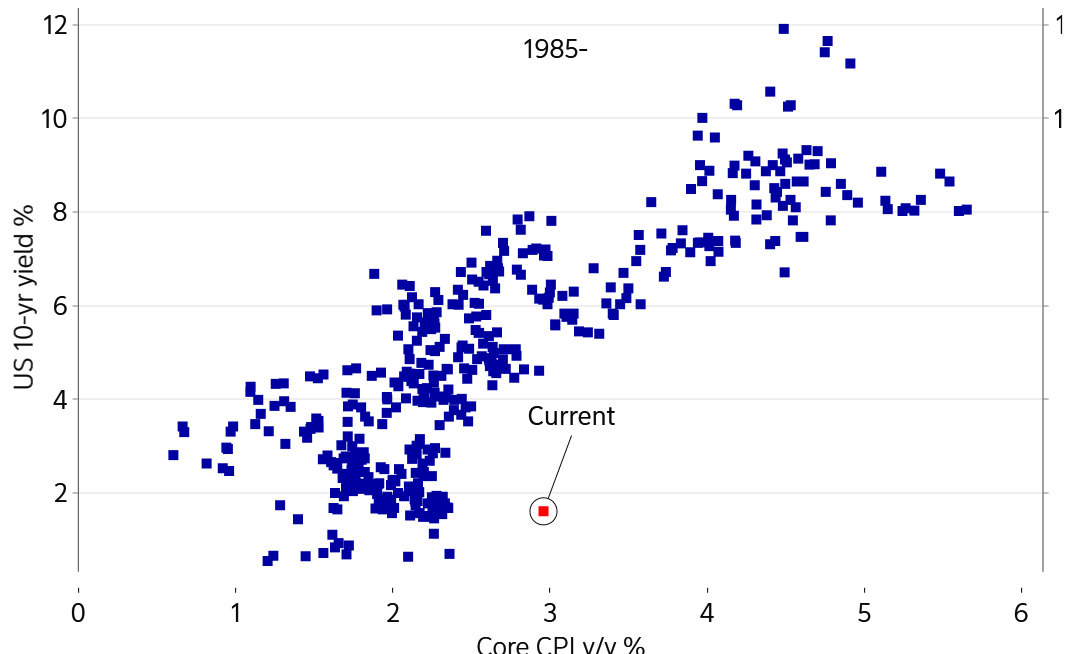
But isn’t the inflation story already market consensus? Well, even though there is a lot of talk of inflation and the FinTwit crowd has started to call sticky inflation a consensus view, a scatter plot of core inflation and the US 10-year yield says that the bond market rather has fully bought into the transitory peak inflation story.
The bond market believes that inflation is transitory
Meanwhile, the demand side of the equation keeps getting help:
Biden Is the $6 Trillion Man A blowout for the ages on everything but defense and security.
From the WSJ Editorial Board:
(…) If Mr. Biden gets his way, spending in fiscal 2022 will still be $6 trillion, which is some $2 trillion more than before the pandemic in 2019. Then spending will keep rising and remain a little under 25% of GDP for the rest of the decade. That level has never been reached in a single year since World War II, and the postwar pre-Covid average was 19.4%.
Even this level of spending is surely understated since much of it will finance Mr. Biden’s new cradle-to-grave federal entitlements for child care, paid family leave, community college and more. These are mandatory programs that don’t require an annual Congressional appropriation. (…)
The President’s discretionary priorities also deserve a word. Most executive agencies would get huge budget increases, including Health and Human Services (23.1%), Commerce (27.7%), and the Environmental Protection Agency (21.3%). Apparently, the administrative state will need more money for the vast regulatory buildup the President has ordered.
On the other hand, Defense (1.6%) and Homeland Security (0.2%) budgets would decline after inflation. China is a generational challenge. Iran is arming its proxies across the Middle East. Migrants are flooding the Southern border. Yet Mr. Biden believes the military and border security need to go on a diet.
Mr. Biden proposes to finance all this with some $3 trillion in tax increases, the largest tax hike as a share of the economy since 1968, according to Strategas Research Partners. (…)
Even Mr. Biden’s budget assumes that interest payments on the debt will more then double to 11.2% of spending by the end of the decade. But that assumes the Federal Reserve won’t raise interest rates all that much, and that America’s creditors won’t demand a higher premium to guard against inflation and financial risk. Mr. Biden is counting on the Fed to monetize all of this debt, but no one knows how long this modern monetary theory can last. (…)
(…) “Where we choose to invest speaks to what we value as a nation,” Biden said in a statement released by the Office of Management and Budget. “It is a budget that reflects the fact that trickle-down economics has never worked.”
The idea is that boosting the middle class and the poorest Americans will provide more stable, long-term growth. (…)
Equity is mentioned almost 40 times in the budget document, double the references to growth. (…)
This chart is from Stan Druckenmiller. (If you missed my Memorial Day post, you probably missed his recent presentation, a must). Good demand cannot remain 15% above trends without goods inflation.

The Chase spending tracker is as of May 24. There is no let down, even on nondiscretionary spending:

Fed’s Bullard: US jobs market is tighter than it looks Comments could accelerate central bank’s timeframe for removing some monetary stimulus from the economy
In an interview with the Financial Times, James Bullard, president of the St Louis Fed argued that anecdotal evidence suggests that conventional measures of employment may not fully reflect the reality and that “labor markets should be interpreted as fairly tight”.
So much for a data and evidence dependent Fed…

Graphic: U.S. Chamber of Commerce (via Axios)
Euro-Area Inflation Rate Hits 2% for First Time Since 2018
(…) Core inflation, a less volatile measure that excludes volatile items such as food or fuels, was just 0.9% in May. (…)

Nordea:
The flash inflation data provides only a very limited amount of detailed information on each country’s price developments but it points to a direction that the core inflation seems to be sluggish in most Euro-area countries and energy was driving the increases in headline inflation in all countries. Out of the big economies, the HICP core inflation slowed down to 0.1% in Italy and in France, available information both on services and manufactured products showed very modest inflation in monthly terms and core inflation very likely kept hovering at around 1%.
The only signs of higher core inflation came from Germany where service price inflation (based on the national data) accelerated from 1.6% to 2.2%. Based on the regional data, it seems that the rise was mainly due to higher inflation in transport and package holidays which both are typically volatile and especially the transport prices were probably at least partly driven by the higher fuel prices. Otherwise, the regional data showed very gradual price developments among services in Germany.
ING:
Goods inflation is set to rise as well – which has hardly happened so far – as supply chain problems, shortages and high capacity utilisation are resulting in price pressures. In May, it increased from 0.4% to 0.7%, which is likely to be the start of a longer rally, as supply side issues are set to last for at least a few more months, and demand for goods continues to come in very strong.
For services, a lot of prices are still imputed as restrictions remain in place in a lot of countries, which makes real price developments harder to read. Reopenings have occurred over the course of May though, but the full inflation impact is probably going to show up in June. German data did reveal yesterday that prices for package holidays increased more significantly in May. We expect more reopening jumps to play into the services inflation data over the months ahead. (…)
With goods and services inflation set to increase more, elevated eurozone inflation is the best bet for the coming months. The discussion about whether this is indeed temporary or structural will be a very prominent debate for the months to come. We expect the recovery to moderate after a few strong months initially and see most goods inflation disruptions fading towards the start of 2022. That means we still expect inflation to come down to about 1.5% in 2022.
MANUFACTURING PMIs
The eurozone manufacturing economy experienced a new record improvement in operating conditions during May. The headline PMI® recorded 63.1, compared to 62.9 in April and its highest reading in the survey history (data for the eurozone have been available since June 1997). The headline index has now recorded readings above the 50.0 no-change mark that separates growth from contraction for 11 months in succession.
All three market groups once again recorded strong improvements in operating conditions during May. Investment goods producers were again the best-performing, registering rapid gains in both output and new orders. The intermediate goods and consumer goods categories both saw stronger growth, with respective PMI readings for May close to survey record highs.
At the country level the Netherlands registered the highest PMI, followed by Austria. In each case, latest readings were respective survey records.
Of the remaining six countries covered by the survey, Ireland and Italy also recorded their highest ever PMI numbers, whilst Greece, France and Spain all registered multi-year peaks. Germany was the only nation to record slower growth, though still managed to register a rate of expansion close to March’s survey record.
Growth of manufacturing output was the slowest recorded by the survey for three months, though it nonetheless remained close to March’s survey record with production again underpinned by rapid gains in new orders. May’s survey indicated that sales rose at the third-strongest rate in the survey history (surpassed only by increases seen in the preceding two months). New order books were swollen by increased demand from across domestic and international markets: new export business rose again at a historically sharp pace.
Placing constraints on production activities were ongoing difficulties in sourcing inputs from vendors. Deliveries from suppliers deteriorated at a severe and unprecedented rate during the month, as demand for inputs again exceeded the supply capabilities of vendors.
Indeed, purchasing activity amongst eurozone manufacturing firms rose at a fresh survey record rate but, faced with delays in delivery, firms again utilised their existing stocks wherever possible. The result was a twenty-eighth successive monthly fall in input inventories. In a bid to meet strong demand, manufacturers reduced their stocks of finished goods to the sharpest degree recorded by the survey since November 2009.
On the price front, average input costs again rose substantially, with the rate of inflation hitting an unprecedented level in line with widespread product shortages. Boosted by strong market demand, manufacturers took advantage of improved pricing power by raising their own charges at the fastest rate in more than 18 years of data availability.
With new orders rising at a faster rate than output, levels of work outstanding continued to increase in May. Moreover, the rate of growth hit a fresh survey record for the third month running. This encouraged firms to add to their workforce numbers, leading to a net rise in manufacturing employment for the fourth successive survey period. Growth also accelerated, reaching its highest since January 2018. All nations once again registered a rise in staffing levels, with Austria, Ireland and the Netherlands enjoying the sharpest gains.
Finally, confidence about the future remained highly positive in May despite easing to its lowest in the past four months. Manufacturers remained buoyed by the potential opportunities over the coming year from the hoped-for further reopening of economies and easing of restrictions related to dealing with the COVID-19 pandemic.


Chris Williamson, Chief Business Economist at IHS Markit:
(…) High sales volumes are consequently depleting warehouse stocks and backlogs of uncompleted work have soared at a record pace. While these forward-looking indicators bode well for production and employment gains to persist into coming months as firms seek to catch up with demand, the flip-side is higher prices. The combination of strong demand and deteriorating supply is pushing up prices to a degree unparalleled over the past 24 years.
The survey data therefore indicate that the economy looks set for strong growth over the summer but will likely also see a sharp rise in inflation. However, we expect price pressures to moderate as the disruptive effects of the pandemic ease further in coming months and global supply chains improve. We should also see demand shift from goods to services as economies continue to reopen, taking some pressure off prices but helping to sustain a solid pace of economic recovery.
China’s manufacturing sector continued to expand in May, with firms reporting the strongest increase in new work for five months. As a result, production expanded further, though the rate of growth softened since April amid reports of material shortages and higher purchasing costs. Suppliers’ delivery times lengthened solidly, which in turn drove a rapid increase in input prices. As part of efforts to contain costs, employment was broadly stable in May. At the same time, firms raised their factory gate prices at the quickest rate for over a decade.
The headline seasonally adjusted Purchasing Managers’ Index ™ (PMI ™ ) climbed from 51.9 in April to 52.0 in May, to signal a further improvement in operating conditions. Though mild, the upturn was the strongest recorded in the year to date.
Latest data signalled a further increase in demand for Chinese manufactured goods, with total sales rising at the fastest rate for five months. The expansion was supported by greater demand both at home and overseas. Notably, new export order growth improved to a six-month high in May.
Greater amounts of new work led to a further increase in Chinese manufacturing output during May. The rate of expansion softened since April and was moderate. Anecdotal evidence indicated that material shortages and higher purchasing costs had dampened the latest upturn in output.
The subindex of total new orders hit its highest point in 2021 and the gauge for new export orders was at its highest since November. Supply was relatively weak as raw material shortages and high prices hindered expansion.
The sustained improvement in customer demand led firms to raise their buying activity at a solid rate. However, average vendor performance deteriorated again in May, and at a faster pace than in April. According to panel members, greater demand for inputs and low stock levels at suppliers drove the latest deterioration in lead times.
Inventories data meanwhile pointed to a slight drop in stocks of both pre-and post-production items. The falls were often linked to the greater usage of current inventories for production and fulfilment of orders.
After rising slightly in April, employment was broadly unchanged in May. While some firms added to their payrolls in order to expand capacity, other companies expressed a more cautious approach to hiring due to rising input costs. Consequently, backlogs of work rose for the third month in a row.
Average cost burdens rose rapidly in the latest survey period, with the rate of inflation the quickest since December 2016. Panel members frequently mentioned that higher raw material costs pushed up expenses. Firms generally passed on greater input costs to clients by raising their output prices which increased at the fastest rate since February 2011.
Manufacturing firms remained confident that output would increase over the year ahead amid forecasts of rising customer demand and new product releases. That said, the level positive sentiment dipped to a four-month low, largely due to concerns over rising costs and pandemic-related uncertainty.


The headline au Jibun Bank Japan Manufacturing Purchasing Managers’ Index™ (PMI) edged down from 53.6 in April to 53.0 in May, signalling a softer but still moderate improvement in the health of the manufacturing sector. The latest increase extended the current sequence of expansion to four months and highlighted a sustained turnaround for the Japanese manufacturing throughout 2021 following COVID-19 related disruption last year.
Latest data pointed to manufacturing output increasing for a fourth consecutive month. The pace of growth softened from the previous survey period, but was still solid overall amid reports of improved demand conditions as firms adjusted to operating under COVID-19 restrictions.
New orders among Japanese manufacturers also rose further. The overall pace of expansion dipped in comparison to April, and was only modest overall. Respondents linked higher sales to greater client confidence for tools and machinery. Moreover, foreign demand for Japanese manufactured goods remained in expansion territory in May, with firms citing stronger demand in key markets, notably in China.
The Japanese manufacturing sector was boosted by a second successive rise in employment levels in May, with firms taking on additional personnel in response to greater output requirements. Indications of greater pressure on capacity rose, as backlogs of work increased for the third time in as many months, though the pace of growth eased from April.
At the same time, Japanese goods producers indicated a quicker expansion in purchasing activity in May, with the respective seasonally adjusted Index reading at the highest level since February 2014. Firms linked additional input buying to growing output requirements and new orders. That said, average vendor performance deteriorated further in May, as manufacturers indicated that raw material shortages meant lead times extended further. As a result, holdings of preproduction goods were raised for the first time since March 2019 to guard against delivery delays, while panellists noted that existing orders were completed using stocks of finished goods where possible.
May data signalled further rises in average cost burdens among Japanese manufacturers. The pace of input cost inflation remained rapid overall, and reached the fastest pace since October 2018. Respondents commonly attributed higher input costs to widespread rises in raw material prices. These were partially passed on to clients through higher factory gate charges, which rose only modestly in comparison.
Looking ahead, business optimism rose at Japanese goods producers, as firms continued to forecast a rise in output in the coming year. Manufacturers predicted that a wider economic recovery from the pandemic would boost demand.

- China’s Factory Activity Slipped in May, but Consumer Spending Held Up A Holiday spurred spending on travel and accommodation, and construction climbed
China’s official manufacturing purchasing managers index slipped slightly to 51.0 in May from the previous month’s 51.1 reading, according to data released Monday by the National Bureau of Statistics. (…)
A recent surge in prices for raw materials such as iron ore, crude oil and coal sent the subindex for input prices to 72.8 in May, the highest level since November 2010, while output prices notched up a record-high reading of 60.6, according to Monday’s PMI data. (…)
Total new orders retreated to the lowest level in a year as fewer bookings from overseas markets pushed new export orders into contraction territory, the statistics bureau said.
“The soaring prices will soon dent demand and squeeze profit margins for manufacturers by adding production costs,” said Xing Zhaopeng, an economist at ANZ. (…)
Monday’s data showed larger manufacturers performing better while a subindex tracking small enterprises fell into contraction, below the 50 mark. (…)
Separately on Monday, China reported that its nonmanufacturing PMI, which includes services and construction activity, rose to 55.2 in May from 54.9 in the previous month.
The subindex measuring construction activity climbed to 60.1 in May from April’s 57.4, the statistics bureau said, while those for transportation and accommodations marked a second month above 65—indicating a sustained rebound in travel. The retail, catering, cultural, sports and entertainment sectors also remained well in expansion territory in May, reflecting what the statistics bureau described as an accelerating consumer recovery. (…)
However, expansion for the service industry as a whole narrowed slightly to 54.3 in March, compared with 54.4 in April, held back in part because of production-linked services, according to the statistics bureau. (…)
Does China’s Baby Bust Mean a Global Inflation Boom? The effects of China’s demographic crisis will percolate to nearly every corner of the global economy.
China will allow couples to have three children and will invest more in education and child care, after decades of restricting most families to one or two children. The change is welcome, but the limited success of many other countries trying to boost births with financial incentives—and the lackluster response to a similar policy change in 2015—mean it is probably too late to head off the worst of China’s demographic crisis. The effects of the great Chinese baby bust will percolate to nearly every corner of the global economy.
(…) all things being equal, it does seem likely that costs for labor-intensive manufacturing in aggregate could be set to rise significantly over the next decade or so, particularly if India continues to struggle with poor infrastructure and protectionism. Places like Vietnam will help, but the scale is several degrees of magnitude away. China’s Guangdong province alone is home to around 30% more people. (…)
About half of migrant workers in China are older than 40, according to Commerzbank, compared with around 30% in 2008. Many of them will find themselves responsible for supporting two elderly parents back home.
The growth rate of both the migrant and overall urban labor force has slowed sharply since 2017, right around the time the 15- to 64-year-old population began to fall in earnest. That is a more worrisome trend than lower population growth itself. It implies that one main source of Chinese productivity growth—moving workers from low-value-added agriculture or local services into high-value-added manufacturing—may be starting to bump up against some natural limits. (…)
Many investors seem to view copper as a sure thing given the tailwinds behind investment in clean energy and vehicles. But as of 2018, construction was still the biggest source of copper demand in China, according to mining giant BHP, accounting for 26% of total demand and edging out the power sector and consumer durables at 22% and 23%, respectively. If future Chinese households stop seeing real estate as their best financial bet, the hit to demand for nearly every major industrial commodity would be substantial. (…)

TECHNICALS WATCH
Fresh new highs on several broad indices are encouraging but tech and smaller caps remain problematic.
S&P 500 Canada


Russell 2000 NYFANG


 Amgen Wins Approval for Pathbreaking Lung Cancer Drug