U.S. Housing Starts Surge in March to Highest Level Since June 2006
Better weather and low interest rates boosted housing last month. Housing starts jumped 19.4% (37.0% y/y) during March to 1.739 million units (SAAR) after falling 11.3% in February to 1.457 million, revised from 1.421 million. Starts in January eased 1.7% to 1.642 million, revised from 1.584 million. The Action Economics Forecast Survey expected 1.610 million starts in March.
Starts of single-family homes jumped 15.3% in March (40.7% y/y) to 1.238 million from 1.074 million in February, revised from 1.040 million. Starts of multi-family units surged 30.8% last month (28.8% y/y) to 501,000 from 383,000, revised from 381,000.
Building permits improved 2.7% (30.2% y/y) to 1.766 million from 1.720 million in February, revised from 1.682 million. That reversed part of the February decline. Permits to build single-family homes rose 4.6% (33.6% y/y) to 1.199 million after falling 9.8% in February. Permits to build multi-family homes eased 1.2% (+20.1% y/y) to 567,000 after a 6.8% February decline.
By region, housing starts in the Northeast jumped by roughly two-thirds and more than doubled y/y to 182,000 after falling 46.1% in February. In the Midwest, starts surged 122.8% (87.0% y/y) to 303,000, the highest level since February 2006. Housing starts in the South rose 13.5% (24.0% y/y) to 874,000 following February’s 6.2% decline. In the West, starts fell 13.6% (+19.5% y/y) to 380,000 after rising 8.9% during February. (Haver)

The chart below plots quarterly single-family starts and the red dot marks the last 4Q average.

The National Association of Realtors reported that its Fixed Rate Mortgage Housing Affordability Index decreased 7.6% (-1.4% y/y) in February to 173.1. This decline followed a 9.1% jump in January, which had lifted the index to 187.4, its highest since 193.2 in March 2013. The Housing Affordability Index equals 100 when median family income qualifies for an 80% mortgage on a median-priced existing single-family home. A rising index indicates an increasing number of buyers can qualify for a mortgage to purchase the median-priced home
In February, median family income declined while median house prices increased. The income measure fell 4.9% (+3.5% y/y) after a hefty 7.0% rise in January, and house prices rose 3.0% (16.2% y/y) to $317,100 after falling 1.8% in January. Income had been bolstered in January by the federal government’s special income support payments. The mortgage interest rate was unchanged in February at its all-time low of 2.73%, which it sustained through December, January and February. The house price measure and the interest rate combine to make the monthly payment $1,033, also up 3.0% in February and 5% from a year ago. The payment represented 14.4% of median income, up from 13.3% in January and almost the same as the February 2020 amount of 14.2%.


Redfin with data to February:
The median down payment on a home during the last six months was $40,987, up from $32,261 during the same period a year earlier. That’s an increase of 27%, or nearly $9,000. (…)
Down payments have increased primarily because housing prices have jumped. The median home sale price over the last six months was $333,322, up from $292,945 a year before.
“The surge in home prices actually hasn’t resulted in higher monthly mortgage payments for most buyers because it has been offset by low mortgage rates, but it has driven up down-payment costs,” said Redfin Chief Economist Daryl Fairweather. “This is likely putting homeownership out of reach for many cash-strapped first-time buyers who can’t afford to put an additional $9,000 down.”
(…) the share of sales financed with Federal Housing Administration (FHA) loans fell to 9.9% from 12%, and the share of sales financed with Veterans Affairs (VA) loans dropped to 4.4% from 5.3%. FHA loans are backed by the U.S. government and are frequently used by first-time homebuyers and Americans who don’t qualify for conventional loans due to lower credit scores. (…)
“Lenders have been tightening up requirements for borrowers during the pandemic because so many families are at risk of defaulting on their mortgage payments,” Fairweather said. “This means that many lower-income Americans have been unable to qualify for the loans they need to become homeowners and start building home equity. But as lenders become more confident in the economic recovery, they will be more willing to offer loans to borrowers with less-than-immaculate credit.”
The 30Y fixed mortgage rate was 3.04% on April 15:

A homebuyer would lose $23,250 in spending power with a mortgage rate of 3.25% versus a 2.75% rate, where they were sitting late last year and early this year. At a 3.25% interest rate, a homebuyer can afford a $506,000 home on $2,500 per month, down from the $529,250 they could afford on the same budget with a 2.75% rate. To put it another way, the monthly payment on a $506,000 home would rise $110 with the higher mortgage rate, from $2,390 to $2,500. (…)
With a 3.25% interest rate, 68.4% of homes nationwide that were for sale any time between January 26 and February 25 were affordable on a $2,500 monthly budget. With a 2.75% rate, 70.1% of homes were affordable on that budget.
In a recent Redfin survey, 44% said mortgage rates rising above 3.5% would have no impact on their homebuying plans, but 43% would reassess their plans:

(…) According to data collected by Builder magazine, the top 10 builders in the metropolitan area that includes Austin, Texas, accounted for 57% of the new-home market in 2019, versus 40% in 2005. The top 10 in the Denver area accounted for 61% of the market, versus 52% in 2005.
Even with rising demand, it could be difficult for any new entrants to get much of a toehold in many markets. Banks remain less willing to extend loans to upstart builders than they once were, giving big builders—particularly the large, public ones with access to capital markets—a substantial advantage when it comes to securing land.
Big builders are generally more risk averse than the small, speculative builders that fueled past building booms. On the plus side, that makes busts less likely. It also means that big builders won’t be rushing to put up every house they possibly can, choosing instead to ride what could be a lucrative wave of demand for a long time. That in turn suggests housing won’t be getting much more affordable any time soon.

From John Burns Real Estate Consulting:
- Consumers made $1.0 trillion more than usual in 2020 due to government stimulus, while spending dropped by more than $500 billion. Combined with surging stocks and a rising home equity, potential new and move-up purchasers have more wealth to utilize. A projected strong economic recovery, demographic tailwinds and an accelerated pivot to remote work allows buyers and renters to live in locations where they can get more home for their money.
- In JBREC’s newest land survey (1Q2021) 99% of brokers we surveyed rated their markets as “Hot” or “On Fire” and 96% of brokers reported rising lot prices quarter over quarter.
- Across the country builders are restricting sales and increasing prices to ensure they can keep up with rising material and labor costs, as well as maintain production schedules. The risk to builders is that these limited releases could mean lost customers.
- Despite solid to strong market conditions, the 2010s did not see a land-buying spree, since high and rising horizontal and vertical development costs put a lid on land prices.
- Larger land takedowns are more common to (1) maintain a steady stream of available lots and (2) tap into land value appreciation during hold periods.
- Builders are generally more willing to buy raw land.
- Lot to home price ratios are up everywhere by about 20% (four percentage points), and this is true across all price niches.
- Major infrastructure needs to be done to ensure continued supply of developable land. Support from state and federal governments is needed to help make this happen.
Global savers’ $5.4tn stockpile offers hope for post-Covid spending Households amass extra cash equivalent to 6% of world output since pandemic began
The FT says Moody’s estimates that “if consumers spend about a third of their excess savings they would boost global output by just over 2 percentage points both this year and next”. 
For its part, Morning Consult says that “More than one-third of richer households in many countries (…) said now was a good time to make big purchases, but that was not the case for poorer households”. And Goldman Sachs estimates “that nearly two-thirds of US excess savings were held by the richest 40 per cent of the population and suggested this could hold back the scale of the economic boost because “high-income households will hold [rather than spend] the bulk of excess savings”.
But stimmies helped many consumers, presumably among the less affluent, clear their credit card balances…

TAPER?
Bank of Canada expected to slow pace of bond buying this week as economic outlook improves
Most analysts are forecasting a $1-billion cut to the central bank’s weekly bond-buying program – also known as quantitative easing, or QE – in its rate decision on Wednesday. The bank is currently buying at least $4-billion worth of federal government bonds each week in an effort to keep benchmark interest rates down and stimulate borrowing.
There is less consensus on what the bank will say about timing for interest-rate hikes. Since October, the bank has maintained that it does not expect to raise its overnight policy rate until 2023. However, with recent GDP and employment data coming in stronger than anticipated, the bank may decide to shift its forward guidance for a rate hike to 2022. (…)
Annualized GDP growth in the fourth quarter of 2020 was twice what the bank projected in January, while GDP growth in the first quarter of 2021 did not contract as the bank had predicted, despite a second wave of lockdowns. Commercial bank economists now expect Canada’s GDP to grow by around 6 per cent in 2021, two percentage points higher than projected in the January MPR.
These changes underpin the argument for tapering QE this week. Members of the bank’s governing council have said repeatedly they will reduce the size of the QE program as they gain confidence in the recovery. They have also said any wind-down of the program will be gradual. (…)
Having purchased billions of dollars worth of Government of Canada bonds every week for the past year, the bank owns more than 40 per cent of the market. Bank of Canada Governor Tiff Macklem has said markets become impaired once central banks own between 50 per cent and 70 per cent of the bond supply. (…)
FYI:
In mid-March, the FOMC was expecting real GDP to grow 6.5% in 2021, up from its 4.2% forecast from its December meeting. Q1 now looks well above consensus. Goldman Sachs Q1 is at 7.5%, Q2 at 10.5% and Q3-Q4 average 7.0% for full year growth of 7.2%, slowing to 4.9% in 2022 (FOMC: 3.3%). Somebody will prove very wrong!

Pandemic destroyed fewer U.S. businesses than feared, Fed study shows
Fewer than 200,000 businesses in the United States may have failed during the first year of the COVID-19 pandemic, a lighter toll than initially feared and one that may have had relatively little impact on unemployment, according to Federal Reserve research. (…)
Perhaps 600,000 businesses, most of them small firms, fail in any given year, and U.S. central bank researchers estimated that from March 2020 through February of this year the figure has been perhaps a quarter to a third higher.
That included 100,000 “excess” failures among firms engaged in close-contact services such as barber shops and nail salons, a sector described by the Fed research group as the sector hardest hit by the economic fallout from the pandemic. (…)
Offsetting the hit to those services-oriented businesses, they noted, carry-out restaurants, grocery stores and outdoor recreation companies seemed to suffer fewer failures than usual, with the net result being a smaller-than-anticipated blow to the overall economy. (…)
China Growth Numbers Betray Waning Momentum China reported record on the year growth of 18.3% in the first three months of 2021, but the more telling figure might be the sluggish 0.6% expansion compared with the quarter before.
(…) “The domestic economic recovery is not yet solid,” Liu Aihua, a spokeswoman for the National Bureau of Statistics, said Friday, pointing to uncertainties in the manufacturing sector that have held back investment and rising joblessness for migrant workers and young graduates.
Ms. Liu said the number of migrant workers who headed to cities for work in the quarter was roughly 2.5 million lower than before the coronavirus, reflecting the struggles of their primary employers: the services sector and smaller enterprises.
Meanwhile, the jobless rate for workers aged between 16 and 24 was 13.6% at the end of March, up 0.3 percentage point from a year earlier and far higher than the headline urban unemployment rate of 5.3%, Ms. Liu said. (…)
(…) In his first few months in office he’s already on track to run through over 70 billion euros ($84 billion) in support for the economy. Combined with stimulus measures passed by the previous government, that adds up to over 170 billion euros to protect the country’s families and businesses from the pandemic. The government says that will push this year’s budget deficit to 11.8% of output the government says, making it the biggest stimulus effort in Europe. (…)

That all-in strategy is the most audacious manifestation yet of a sea change in fiscal philosophy in Europe since the austerity-driven response to the sovereign crisis a decade ago. Draghi’s determination to make growth as the lodestar of his policy cements Italy’s place alongside France in brushing off potential constraints on spending and taking advantage of the market’s willingness to underwrite economic recovery.
The extra spending will push Italian debt near to 160% of output this year, higher even than the 159.5% touched after the devastating impact of World War I. The International Monetary Fund forecasts that Italy’s economy will expand by 4.2% this year, faster than the euro-area average. But Draghi’s deficit plans are more aggressive than those of any of his European peers.
“Judged with the eyes of yesterday it would be very worrying. Today’s eyes are very different because the pandemic has made the creation of a great deal of debt legitimate,” Draghi said during a press conference in Rome on Friday. “Debt is good if you can put a company back on the market and allow it to support itself.” (…)
EARNINGS WATCH
From Refinitiv:
Through Apr. 16, 44 companies in the S&P 500 Index have reported earnings for Q1 2021. Of these companies, 84.1% reported earnings above analyst expectations and 13.6% reported earnings below analyst expectations. In a typical quarter (since 1994), 65% of companies beat estimates and 20% miss estimates. Over the past four quarters, 78% of companies beat the estimates and 19% missed estimates.
In aggregate, companies are reporting earnings that are 30.8% above estimates, which compares to a long-term (since 1994) average surprise factor of 3.7% and the average surprise factor over the prior four quarters of 15.2%.
Of these companies, 84.1% reported revenue above analyst expectations and 15.9% reported revenue below analyst expectations. In a typical quarter (since 2002), 61% of companies beat estimates and 39% miss estimates. Over the past four quarters, 69% of companies beat the estimates and 31% missed estimates.
In aggregate, companies are reporting revenue that are 3.5% above estimates, which compares to a long-term (since 2002) average surprise factor of 1.1% and the average surprise factor over the prior four quarters of 2.3%.
The estimated earnings growth rate for the S&P 500 for 21Q1 is 30.9%. If the energy sector is excluded, the growth rate improves to 32.0%.
The estimated revenue growth rate for the S&P 500 for 21Q1 is 9.4%. If the energy sector is excluded, the growth rate improves to 10.9%.
The estimated earnings growth rate for the S&P 500 for 21Q2 is 56.2%. If the energy sector is excluded, the growth rate declines to 44.5%.


Companies in 7 sectors have reported Q1 so far. Only the 7 Industrials having reported surprised negatively (-50.3%) in spite of a +6.2% revenue beat. Big margin squeeze there.
Trailing earnings are now $150.84. Full year 2021: $177.77e. 2022: $203.75e.
TECHNICALS WATCH
Stock Rally Broadens in Encouraging Sign for Bull Market Indicators that point to a stronger and more resilient stock market have been hitting rare milestones recently as the continuing bull run has once again widened.
A greater number of stocks have been propelling the U.S. market higher lately, a signal that—if history is any indicator—more gains could be ahead. (…)
A market is generally considered healthier when more stocks are rising together, and signs of strong participation are typically viewed as a signal that a rally has legs. In contrast, a market with poor breadth—such as the one in the late 1990s near the peak of the dot-com bubble—indicates fewer stocks with larger market capitalizations are carrying the load.
Lately, signs of strong breadth have abounded, a reversal from much of the past year when a small group of large technology stocks drove much of the market’s gains. Last week, the percentage of stocks in the S&P 500 trading above their 200-day moving averages crossed 95%, rising to the highest level since October 2009, according to data through Thursday. Only during three other periods since the start of 2000 has that measure surpassed and then hovered above 95% for several days, according to a Dow Jones Market Data analysis based on current index constituents. (…)
Indeed, during the past three times that the indicator first crossed the 95% threshold—in May 2013, September 2009 and December 2003—the S&P 500 went on to post gains both six months and a year after the threshold was breached.
Similarly, market watchers tend to keep tabs on the percentage of S&P 500 companies trading above their shorter-term 50-day moving averages and watch for when the number crosses 90%—another rare bullish sign. Stocks in the S&P 500 also surpassed that threshold last week.
During the past 15 instances when that has happened, the index has likewise ended higher one year later 14 of the times, according to an analysis by Keith Lerner, chief market strategist for Truist Advisory Services. The average annual gain for those 15 times, according to his analysis: 16.4%.
Analysts say both indicators are optimistic signs for the market—but note they are flashing at a starkly different time than in the past. Often when such breadth milestones are hit, the S&P 500 is coming off a correction—a drop of at least 10% from a recent high—or a much bigger fall. (…)
To be sure, while measures of strong breadth have historically preceded gains six and 12 months ahead, history has shown they don’t preclude short-term setbacks along the way. (…)
Extreme bullish sentiment tends to appear near the end stages of bull markets, noted Jason Goepfert, president of Sundial Capital Research, which is why, he said, it has been unusual to see that occurring at the same time that technical indicators are pointing to further gains.
“It’s hard to find any instance that’s remotely similar to this. We’ve seen extremes like this before in breadth readings, but not coupled with a market that has been so strong,” he said. “It’s been a hard thing to juggle: Is [this market breadth] a sign of an impressive comeback and recovery, or is it a sign of excess speculative behavior, where everyone is buying anything?” (…)
Technical analysis is not my forte so I rely on a few select “proven experts”. One of my favorite is Lowry’s Research which has been around since 1938. Lowry’s admits that its “core measures of Supply and Demand remained less than ideal” but also sees a “broadening bull market” with the current sectorial rotations.
The skeptic in me notes, however, that
- small caps have not participated in the recent surge. The S&P 600 is down 3.7% from its March 15 high, while the Russell 2000 is down 4.2%. These are the stocks most directly impacted by a strong domestic economy. They are also likely among the most impacted by rising tax rates, although the Biden tax plan is apparently focusing on international profits. Go figure!
- Per GS, “S&P 500 average trading volume as a share of market cap thus far in April has registered as the lowest since January 2020. The slowdown in retail trading has been a key contributor. While online retail broker daily average trades are still up about 75% year/year, the growth in trading has dropped sharply from the peak of 250% in August 2020. Similarly, total US equity call option volumes have dropped to their lowest level since late 2020, albeit at still elevated levels by historical standards. Despite low volumes, most measures of market liquidity, such as bid-ask spreads or top-of-book depth remain healthy.”
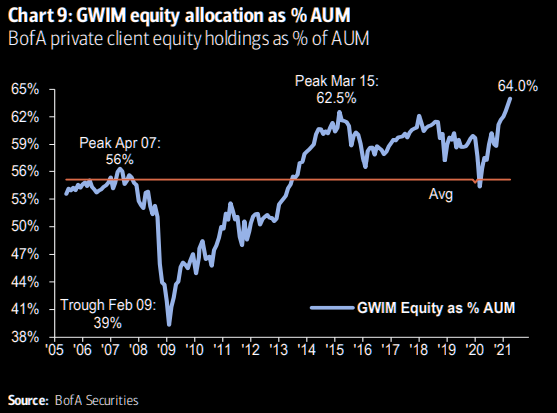
- Individual investor equity weight is at record high levels and so is their net overweight in equities per BofA data.
- Insiders are possibly as bearish as they can be. This chart is from TR via Barron’s…

- … while INK Research says that “American insiders are giving the thumbs down to not only the broad market but also most sector themes.”
- BTW, JPM says that “as of this moment a near record 96% of S&P stocks are trading above their 200DMA, which is the highest in more than 20 years, and the last time it happened – in Sept of 2009…the S&P was 5% lower in 2 weeks, and unchanged a year later.
That said, one of the charts I closely watch remains positive:
- 13/34–Week EMA Trend (CMG WEalth)

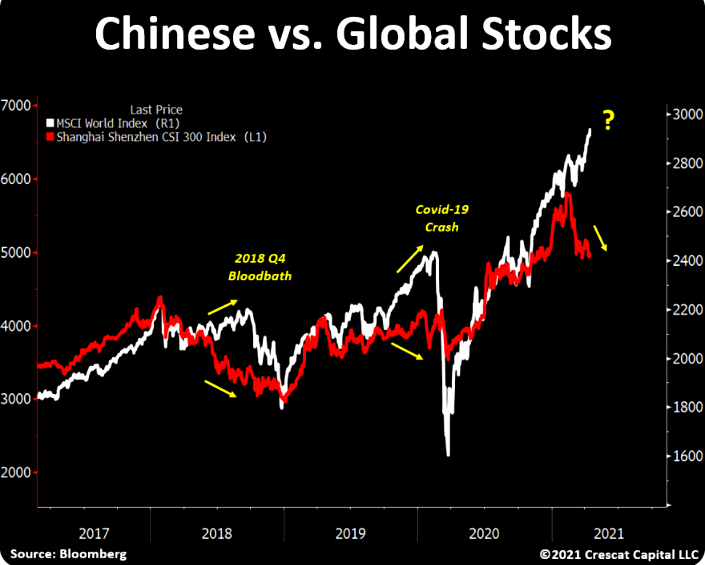
Interesting comment by Crescat via The Market Ear: “Something is brewing under the surface. Chinese stocks significantly underperforming global equities. Similar divergence preceded two big selloffs in overall stocks”
Has spec Spac peaked?
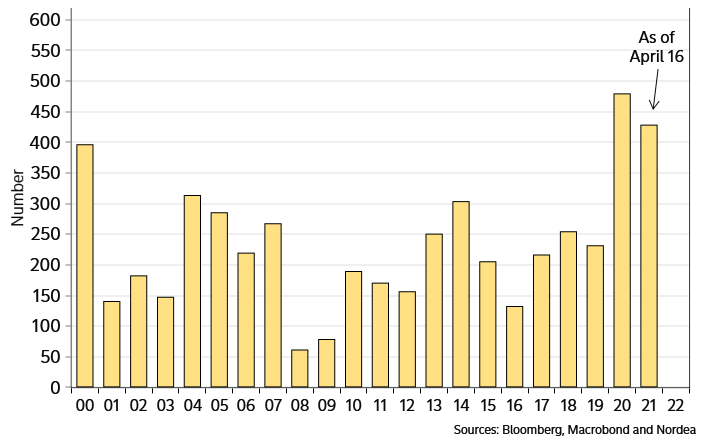
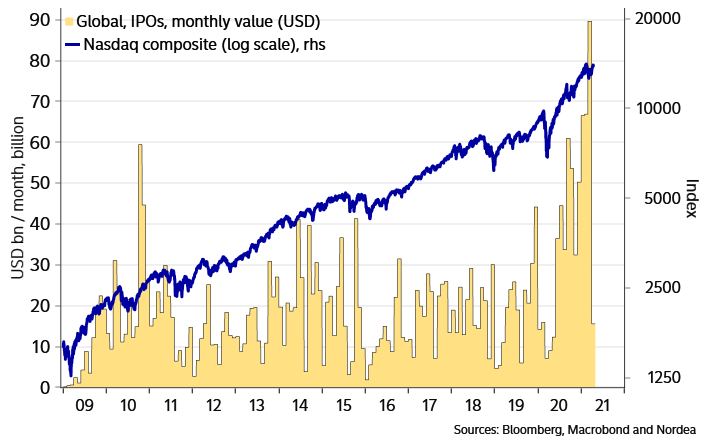
SPAC Hot Streak Put on Ice by Regulatory Warnings Investors are getting scared off special-purpose acquisition companies, one of the hottest bets on Wall Street, as regulators intensify scrutiny of SPACs and share prices tumble.
The Dollar’s Sliding Share in Reserves is a Red Herring The greenback is at a 25-year low in official currency reserves, a figure that understates the currency’s importance in a number of ways
The quarterly International Monetary Fund data show the dollar’s share of reserves below 60% for the first time since 1995. At 21.2%, the euro’s share is at its highest level in six years, and at 6%, the Japanese yen is at its highest in two decades.
One of the reasons is a simple mechanical one. The dollar depreciated last year, meaning that the dollar value of nondollar assets in a mixed-currency portfolio rose. In the IMF data, that is often the largest factor in each given quarter, rather than active buying and selling.
But the second effect of a falling dollar, which is less immediate, should act as a counterweight. As the greenback falls in value, especially against the currencies of exporters with large currency reserves, it encourages them to buy Treasurys and other U.S. assets to keep their own currencies from rising too quickly and damaging competitiveness. (…)
From Bloomberg’s Joe Weisenthal:
(…) Here is a chart published by Crypto Voices from February, when it was still below $50K per coin and its total market cap was just under $900 billion, and it shows it knocking on the door of the British pound based on the total “monetary base” of the pound and other fiat currencies. Since the chart was published of course, Bitcoin has grown a lot more and would now be, theoretically, in 5th place.

Now right away you should immediately see the problem. This idea of ranking currencies based on the size of their so-called monetary base means the yen and the euro are both larger than the U.S. dollar. I’m really not sure what to tell you, but I’ll just say this. If you ever get to a point in life where you’re ranking the size of currencies, and somehow you stumble on a measure which purports to show that the yen and the euro are larger than the dollar, you need to just stop everything and re-evaluate the decisions that got you to this point. Because everybody knows that’s nonsense, and you should start looking for another measure. Seriously, that fact alone should tell you you’ve stumbled on a very wrong way to measure currencies. And yet within the Bitcoin community rankings like this one proliferate.
We could stop right there, but it’s worth powering forward for a second to just explain the levels of wrongness at play here. First, what are we even talking about when we are talking about the monetary base like this? As the creator of the above chart Matthew Mežinskis explained on the On The Brink Podcast with Nic Carter, it’s a combination of coin and cash out there, plus the reserves the banks hold at monetary authorities.
The problem is that reserves is just not that useful as a measure of anything. All it simply reflects these days is how much QE the central bank has done. QE is a swap of one type of government liability (a government bond like a Treasury or a Gilt) for another type of government liability (reserves). It’s not a measure of currency size. It simply reflects how the government has chosen to structure its own liabilities.
Bitcoiners may admit that it’s not a perfect measure, but then they say it’s conceptually useful, because just as fiat currency has various Ms (M1, M2, M3 etc) reflecting broadening forms of the money, so too does Bitcoin, which has a base layer (the blockchain) but also has Layer 2 payments whereby transactions can be conducted off chain and then settled ultimately on the chain itself. You can actually think of the newly public Coinbase as offering centralized Layer 2 payments, because they enable instant Bitcoin transfers between Coinbase users.
Those transactions aren’t actually registered on the blockchain itself. They’re just reflected in Coinbase’s own internal ledger. There are also other solutions such as the decentralized Lightning Network that allow multiple parties to enter into transactions, which only later get properly settled on the blockchain itself. But while it’s seductive to compare the levels of Bitcoin and fiat this way, the analogy doesn’t take you very far.
The conceptual flaw is that Bitcoin’s second layer solutions need the dollar value of the base layer to grow in order to scale. You can’t have billions of layer 2 Bitcoin transactions until the base layer is worth several billions. With fiat, no such constraint exists. Everyday dollar payments scale just as well today as they did before the Global Financial Crisis, when the amount of Fed reserves were much smaller, because QE wasn’t a thing yet. Dollar transactions don’t need a large base money at all, whereas Bitcoin transactions absolutely do.
So the chart fails on its face. (Obviously the euro and yen aren’t bigger than the dollar). It fails conceptually since base money isn’t a measure of a currency’s size. And it fails logically. Base money measures aren’t analogous structurally to Bitcoin’s base layer, because for Bitcoin, growth in the base is needed in order to scale payments, and this isn’t the case for fiat.
You know there are always long-running Twitter arguments about whether Bitcoin is technically a currency or not. And TBH I don’t find the discussion to be that important. But if Bitcoiners are going to insist on actually comparing the currency to the big fiats, then they should use proper measures. What is the Bitcoin share of international payments? What is the Bitcoin share of central bank reserves? How much Bitcoin-denominated debt is there? These are the logical type of ways to rank and compare money. By these rankings, Bitcoin is still incredibly tiny.
Now it’s true, more and more people use Bitcoin as an investment vehicle and that’s getting pretty big. At $1.2 trillion, it’s smaller than Alphabet, but larger than Facebook. It’s also around the value of all NYC real estate, which was pegged last year around $1.4 trillion. Pretty impressive as an investment or savings vehicle no doubt! But so far, as a currency it just doesn’t measure up yet to the big ones. If Bitcoin ever gathers real steam as a way that people pay for things, we can revisit the currency ranking side seriously.
COVID-19
I have recently downgraded this subject to the bottom part of my posts but maybe too early…
Global Covid Cases Hit Weekly Record Despite Vaccinations
(…) The data from Johns Hopkins University showing a 12% increase in infections from a week earlier casts doubt on the hope that the end of the pandemic is in sight.
 The weekly increase surpassed the previous high set in mid-December. While infection rates have largely slowed in the U.S. and U.K., countries in the developing world — India and Brazil in particular — are shouldering surging caseloads. (…)
India and Brazil have so far administered doses equivalent to cover 4.5% and 8.3% of their populations respectively, compared with 33% for U.S. and 32% in U.K., according to Bloomberg’s vaccine tracker. (…)
But it’s not just developing nations that have seen recent setbacks in their efforts to tackle the pandemic. Rare cases of clotting seen in people who have taken vaccines made by Johnson & Johnson and AstraZeneca Plc have fueled the vaccine skepticism being faced by governments worldwide. (…)
Hopefully, this next section will remain where it is:
FYI:

Statista


![image_thumb2[1]](https://i0.wp.com/www.edgeandodds.com/wp-content/uploads/2021/04/image_thumb21.png?ssl=1 "image_thumb2[1]")




(…) More or less any reform that passes will have a bigger negative impact on information technology and healthcare than other sectors. That is because these companies have relatively large foreign profits, and a relatively low effective tax rate on them, as this chart from Credit Suisse Group AG shows:


