The enemy of knowledge is not ignorance, it’s the illusion of knowledge (Stephen Hawking)

It ain’t what you don’t know that gets you into trouble. It’s what you know for sure that just ain’t so (Mark Twain)

Invest with smart knowledge and objective odds

THE DAILY EDGE: 15 DECEMBER 2020

US stimulus plan shrinks to $748bn but wins crucial backer Bipartisan group of lawmakers strip out contentious provisions in bid for compromise
SURVEY SAYS!

In its November Survey of Consumer Expectations, the central bank found households reporting the highest level of expected spending growth since July 2016, at a predicted 3.7% rise for a year down the road, up from 3.1% in October. The increase was driven by households earning under $50,000 a year.

The spending forecast comes against a backdrop of expected household income gain holding steady at 2.1%,which the New York Fed noted was below the long-run average of an expected 2.8% increase in income.

Despite the expected rise in spending, “respondents were more pessimistic about their households’ financial situations in the year ahead, with more respondents expecting their financial situation to deteriorate, and fewer respondents expecting an improvement in their financial situation,” the report said. (…)

  • ZeroHedge looked at the latest aggregated credit and debit card data reported by BofA, one of the largest card issuers in the US:

(…) contrary to gloomy expectations, found that consumer demand normalized with total card spending increasing by 5.4% yoy for the 7-days ending December 5th after a large yoy swing the prior two weeks. Importantly, BofA’s measure of holiday sales, defined as core control retail sales ex-groceries, has moved back in line with last year’s trend and on a cumulative basis is up a whopping 19% yoy, reflecting very strong demand for goods items during the holiday season.

My more cautious reading is that core retail sales trended in line with 2019 in November after a strong October. Many suspect that consumers shopped earlier than normal this year, fearing lockdowns and taking advantage of early promotions (e.g. Prime Day). Recall that this only covers spending on goods. ZH continues:

And although the % mom may indeed be on the cusp of a contraction, BofA’s Michelle Meyer notes that it doesn’t reverse the exceptional growth previously and leaves the November growth rate at a stellar 9.8% Y/Y, hardly the stuff of imminent recessions.

It is rather interesting to note that people are going debit and not credit. Seems cautious to me. November U.S. retail sales data are out tomorrow.

  • Consumer Sentiment Rose in Recent Weeks U.S. consumers grew more confident in the economy in late November and early December, with many expecting the economic conditions to improve when the country begins to exit from the pandemic.

The University of Michigan said Friday its index of consumer sentiment climbed to 81.4 in the two weeks ended Dec. 9, from 76.9 in November. Economists surveyed by The Wall Street Journal expected a reading of 75.5.

Rosier expectations for the economy drove the index’s rebound, though respondents’ views on current economic conditions improved as well.

“Most of the early December gain was due to a more favorable long-term outlook for the economy, while year-ahead prospects for the economy as well as personal finances remained unchanged,” said Richard Curtin, the survey’s chief economist.

A partisan skew in views was responsible for much of the upward shift in sentiment, Mr. Curtin said, with Democrats becoming more optimistic about the economy and Republicans more pessimistic, following President-elect Joe Biden’s victory in the presidential election. (…)

  • The Investor’s Business Daily/TIPP poll dropped from 55.2 in October to 50.0 in November and to 49.0 in December. The 6-m outlook was 46.3 in December, down from its February peak of 57.0.

There are other types of surveys:

In the first week of December, the proportion of mortgage borrowers that started seeking forbearance relief rose to its highest level since August, according to the Mortgage Bankers Association. And call volume at the companies that collect payments rose to the highest level since April, a sign of growing distress among homeowners, the trade group said Monday. (…)

The total percentage of loans that are in forbearance edged lower to 5.48% in the week ended Dec. 6, from 5.54% the week before. Yet the number of borrowers looking to enter forbearance rose to 0.12% of all the loans mortgage servicers collect payments for, the most since August, the MBA said. (…)

As the pandemic drags on, time is running out for some borrowers. Consumers whose loans are in forbearance have to resume making payments next year, in some cases as soon as the end of March. When that happens, many homeowners will face a difficult choice: either pay their mortgage, convince their lender to somehow ease the terms of their loan, or default. (…)

Even with the forbearance program, delinquencies have been rising, in part because some borrowers may not know they’re eligible for relief. At the end of the third quarter, about 7.7% of loans were delinquent, according to the MBA, about twice the percentage at the end of 2019. Delinquencies are still below their financial crisis peak of around 10%. (…)

Bloomberg’s Shawn Donnan suspects that many businesses are in a state of suspended animation that might hit the economy in 2021.

image

(…) This state of suspended animation applies as well to corporate America, which has benefited from the Federal Reserve’s dramatic cuts in interest rates and moves to support credit markets. A Bloomberg analysis of financial data for 3,000 of the country’s largest publicly traded companies found that 1 in 5 were not earning enough to cover the cost of servicing the interest on their debt, rendering them financial zombies. Collectively those companies—among them Boeing, Delta Air Lines, Exxon Mobil, and Macy’s—have added almost $1 trillion in debt to their balance sheets since the beginning of the pandemic. (…)

As the economy comes back to life and government support eventually is withdrawn, one effect is likely to be a surge in bankruptcies and evictions, he says. Even if vaccinations reach a meaningful number of Americans, it may be too late for many businesses.

Oil consumption will be ‘lower for longer than expected’, warns IEA Body cautions against premature ‘euphoria’ that vaccines will swiftly boost air travel
Covid19
China Recovery Continues Despite Covid Surge Elsewhere Industrial output, investment and consumer spending all grew at faster paces in November

(…) China’s industrial output rose 7.0% in November from a year earlier—its highest level in more than two years, China’s official National Bureau of Statistics said. The result was a tick up from 6.9% in October, and beat the 6.8% increase expected by economists polled by The Wall Street Journal. (…)

China’s fixed-asset investment, which includes spending on manufacturing, property and infrastructure projects, rose 2.6% in the January-November period compared with last year, according to data from the statistics bureau. That was faster than the 1.8% pace recorded in the first 10 months of the year, and beat economists’ expectations of 2.5%.

China’s urban jobless rate fell for the fourth straight month to 5.2% in November, compared with 5.3% in October, said the statistics bureau. (…)

China’s retail sales, a key gauge of consumer spending, rose 5.0% year over year in November, up from 4.3% in October. Still, it was lower than the 5.5% increase expected by surveyed economists, suggesting China has work to do to shore up growth longer term. (…)

FYI: China’s 10Y yields are up 80bps (+32%) back to their late 2019 range.

unnamed (18)

China suspends top credit rating agency as defaults hit market Regulator says Golden Credit failed to justify some of its ratings and upgrades
SENTIMENT WATCH
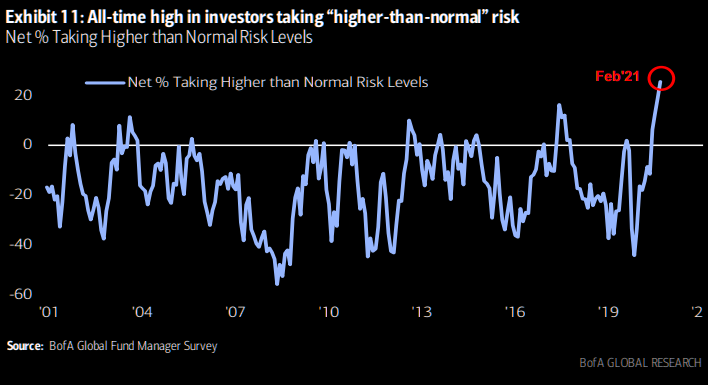
  • Bank of America says says investor bullishness is rising, but is not yet euphoric. BofA’s Sell Side Indicator rose to 57.8%, the highest level of bullishness in 18 months.  The indicator is now closer to a “sell” signal than it has been since the onset of the Greet Financial Crisis. But this doesn’t mean that it’s time to sell stocks just yet. In fact, the strategists said this signal indicates a 10% total return in the benchmark S&P 500 over the next 12 months. In other words, investor sentiment is rising, but it’s not yet at the euphoric level that is typically seen at the conclusion of bull markets. a reading of 61.9 represents high bullishness and thus triggers a “sell” signal.
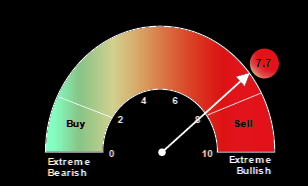
  • BofA Bull & Bear Indicator is “accelerating toward extreme bullish”. It now stands at 5.8, up from 4.7; on a scale from 0 to 10. In concert with that indicator, the bank said fund managers’ cash was at 4.1 per cent of their holdings, which is close to a “sell signal”.

BofA Bull & Bear Indicator history

  • The IPO frenzy is almost where it was during the dot.com era (The Daily Shot).

image

  • If you can’t buy the IPO directly because your a “financial nobody”, you can feed the beast that buys IPOs at and after issue:

unnamed - 2020-12-15T091515.295

ipo

The beast is feeding on pretty fatty meals these days as Jay Ritter’s data shows:

unnamed - 2020-12-15T090921.748

Wolf Street (via the Daily Shot) adds that

not only are investors willing to buy unproven companies, they’re willing to buy things that aren’t really companies at all, just concepts. There has never been a time when investors were so willing to fund blank-check companies in hopes of striking it rich with an undiscovered gem – even though these things are much more likely to give riches to their founders.spac money raised ipo

This paper analyzes the structure of SPACs and the costs built into their structure. We find that costs built into the SPAC structure are subtle, opaque, and far higher than has been previously recognized. Although SPACs raise $10 per share from investors in their IPOs, by the time the median SPAC merges with a target, it holds just $6.67 in cash for each outstanding share. We find, first, that for a large majority of SPACs, post-merger share prices fall, and second, that these price drops are highly correlated with the extent of dilution, or cash shortfall, in a SPAC. This implies that SPAC investors are bearing the cost of the dilution built into the SPAC structure, and in effect subsidizing the companies they bring public. We question whether this is a sustainable situation. We nonetheless propose regulatory measures that would eliminate preferences SPACs enjoy and make them more transparent, and we suggest alternative means by which companies can go public that retain the benefits of SPACs without the costs.

U.S. tech giants face 6-10% fines as EU set rules to curb their power Amazon, Apple, Facebook and Alphabet unit Google may have to change their business practices in Europe or face hefty fines between 6-10% under new draft EU rules to be announced on Tuesday.

(…) One set of rules called the Digital Markets Act calls for fines up to 10% of annual turnover for online gatekeepers found breaching the new rules, a person familiar with the matter told Reuters.

It also sets out a list of dos and don’ts for gatekeepers, which will be classified according to criteria such as number of users, revenues and the number of markets in which they are active, other sources said.

The second set of rules known as the Digital Services Act also targets very large online platforms as those with more than 45 million users.

They will be required to do more to tackle illegal content on their platforms, misuse of their platforms that infringe fundamental rights and intentional manipulation of platforms to influence elections and public health, among others. (…)

The draft rules need to reconcile with the demands of EU countries and EU lawmakers, some of which have pushed for tougher laws while others are concerned about regulatory over-reach and the impact on innovation.

Tech companies, which have called for proportionate and balanced laws, are expected to take advantage of this split to lobby for weaker rules, with the final draft expected in the coming months or even years.

  • The FT adds today:
EU warns that it may break up Big Tech companies Repeat offences under new rules will trigger action to force divestments, Brussels will warn
U.S. Homeland Security, thousands of businesses scramble after suspected Russian hack The U.S. Department of Homeland Security and thousands of businesses scrambled Monday to investigate and respond to a sweeping hacking campaign that officials suspect was directed by the Russian government.

(…) The attacks, first revealed by Reuters Sunday, also hit the U.S. departments of Treasury and Commerce. Parts of the Defense Department were breached, the New York Times reported late Monday night, while the Washington Post reported that the State Department and National Institutes of Health were hacked. (…)

Technology company SolarWinds, which was the key steppingstone used by the hackers, said up to 18,000 of its customers had downloaded a compromised software update that allowed hackers to spy unnoticed on businesses and agencies for almost nine months. (…)

SolarWinds boasts 300,000 customers globally, including the majority of the United States’ Fortune 500 companies and some of the most sensitive parts of the U.S. and British governments – such as the White House, defence departments and both countries’ signals intelligence agencies.

Because the attackers could use SolarWinds to get inside a network and then create a new backdoor, merely disconnecting the network management program is not enough to boot the hackers out, experts said.

For that reason, thousands of customers are looking for signs of the hackers’ presence and trying to hunt down and disable those extra tools.

Investigators around the world are now scrambling to find out who was hit. (…)

FireEye, a prominent cybersecurity company that was breached in connection with the incident, said in a blog post that other targets included “government, consulting, technology, telecom and extractive entities in North America, Europe, Asia and the Middle East.”

“If it is cyber espionage, then it is one of the most effective cyber espionage campaigns we’ve seen in quite some time,” said John Hultquist, FireEye’s director of intelligence analysis.

BTW: Putin Finally Congratulates Biden on Winning U.S. Presidency

Nerd smile Correlation is not causation:

unnamed (19)

Joe Weisenthal, an editor at Bloomberg.

EXUBERANT NORMALITY

December 14, 2020

The theme for 2021 is normalization.

Now that we can reasonably expect effective vaccination, possibly leading to near-normal profits sometime during 2021, we can normalize equity valuations. Bottom-up estimates for 2021 EPS are all around $169,  corroborated by several buy-side strategists currently using $170 under a vaccination scenario. At 3700, this gives a P/E of 21.8: Even more “normal”, 2022 estimate of $197, 21% above 2019: the P/E is then 18.8. Any way one looks at conventional P/E ratios, they remain at the very high end of their historical range.

image_thumb[42]

image

On the Rule of 20 P/E: on current trailing EPS: 27.5. Using $170: 23.3 at 3700. All the way out to 2022: 20.3. Fair value is only found 2 years out at 1.6% inflation, not a sure bet.

image_thumb[45]

And if you are still interested in CAPE, its latest data point is 35.7 on trailing 10-year EPS of $101.70.

image

On November 30, Robert Shiller and 2 colleagues, perhaps to bring new life to an almost forgotten measure, tried to normalize CAPE with a new twist called the Excess CAPE Yield (ECY), concluding that “equities will continue to look attractive, particularly when compared to bonds”.

This measure is somewhat like the equity market premium and is a useful way to consider the interplay of long-term valuations and interest rates. A higher measure indicates that equities are more attractive. The ECY in the US, for example, is 4%, derived from a CAPE yield of 3% and then subtracting a ten-year real interest rate of -1.0% (adjusted using the preceding ten years’ average inflation rate of 2%).

relates to Shiller Sees Only Rational Exuberance This Time

What is a “higher measure” that indicates that equities are more attractive? The ECY is 4% within a 0-10% range? At what level is it “a higher measure”? It worked on and off prior to 1931, pretty well between 1932 and 1980 and strangely since while hovering between 0% and 5%, well below its historical range. image

image

image

And what does the ECY really have to do with the equities/bonds relationship? Simply adding bond yields may be saying something about equity values at certain levels of interest rates but says little about interest rate trends and future bond returns.

Telling Joe Stock he’s less ugly than Bill Bond may not be received very positively if Joe is not particularly enamored by Bill’s actual look. Objectively, Mr. Bond is not terribly attractive these days. In fact, $17 trillion of world fixed income securities currently change hands at negative nominal yields courtesy of central bankers. Ten-year Treasuries yield almost 1.0% nominal but provide negative returns after inflation. Even U.S. investment grade corps barely break even in real terms.

The only way Mr. Bond gets attractive is if observed through the prism of very slow economic growth and/or deflation, nothing that would make Mr. Stock win a beauty contest…

Gerard Minack argued similarly via a recent Bloomberg column by John Authers about Normalized CAPE:

(…) To some extent, all else equal, lower interest rates should justify paying more for stocks; they mean that bonds, the prime alternative to equities, are more expensive, and they also mean that the future earnings stream from equities can be discounted at a lower rate, making them more valuable.

The questions, then, are to what extent, exactly, do lower bond yields justify higher equity valuations? And critically: Are all other things equal? (…)

(…) But this leads to a question which Gerard Minack, of Minack Advisors, raises this week. Do low interest rates in their own right lead to higher earnings multiples? His answer is no; it’s not rational to bid up stocks just because rates are low. The reason is because not all else is equal. Usually interest rates are low because growth is bad, and when growth is bad that tends to be bad for equities. That leads to a curved relationship between rates and equities over time — when rates come down from very high levels, equity multiples tend to improve, but when rates then drop to very low levels, equity multiples fall because this generally means that the economy is mired in a recession. (…)

Real yields, compared to current inflation, are low at present, but not historically unprecedented. This exercise gives a slightly better correlation (although only slightly), makes the dot-com bubble look like more of an outlier and, sadly, also makes the current point look like more of an outlier. There have been a number of observations with 10-year nominal yields below the rate of inflation in the past, and this is the most expensive that stocks have ever been during such a period (…):

relates to Shiller Sees Only Rational Exuberance This Time

An important lasting problem with the CAPE is its earnings component which can get totally “irrational” in periods of dramatic drops in profits such as in the 2008-09 Great Financial Crisis and the current Great Health Crisis. CAPE’s ten-year averaging seeks to normalize earnings across 2 business cycles but equity markets are quick to normalize “truly abnormal” profit recessions. Carrying such cratered profits over 10 years is irrational, even using interest rates, unless one thinks such high profit cyclicality is the new normal, which should not lead one to pay up for equities.

The other problem is CAPE’s use of “reported EPS” as opposed to “operating EPS” which most rational investors use. The gap between these two series is 32% currently.

The Rule of 20 adjusts trailing EPS with inflation. Let’s use Shiller’s recent approach and adjust it with 10Y Treasury yields:

image_thumb[47]

It morphs into the Rule of 22 (range 17-27) but with much less consistency than the R20 with inflation. This is particularly apparent between 1983 and 2004 when R22 valuations (using interest rates) would have suggested overvalued equities for 20 years whereas the R20 (using inflation) signaled strong undervaluation between 1983 and mid-1987, 1988 to 1991 and 1995 to 1997.

Superimposing both lines, we can easily visualize that using inflation provides a much more consistent and useful valuation range between 16 and 24:

image_thumb[52]

Using interest rates implies adding fluctuating real interest rates to fluctuating profits. Real rates can be subject to various influences including central bank manipulations and investor sentiment. Inflation data offer a far more consistent and objective valuation range.

image_thumb[64]

Everybody knows equities are overvalued and that bonds carry highly unusual risks of losing money, nominal or real.

But everybody also knows that in this highly abnormal Covid19 environment, governments and central banks are totally set to keep economies running and money flowing, whatever it takes.

In FEARFUL FEARLESSNESS on August 31, I observed that major valuation excesses only corrected when a hawkish Fed took it on itself to end the party. This time, Powell and just about every FOMC member have told us that inflation is not even on their radar screen and that lower for longer is now the only mantra. What’s to fear?

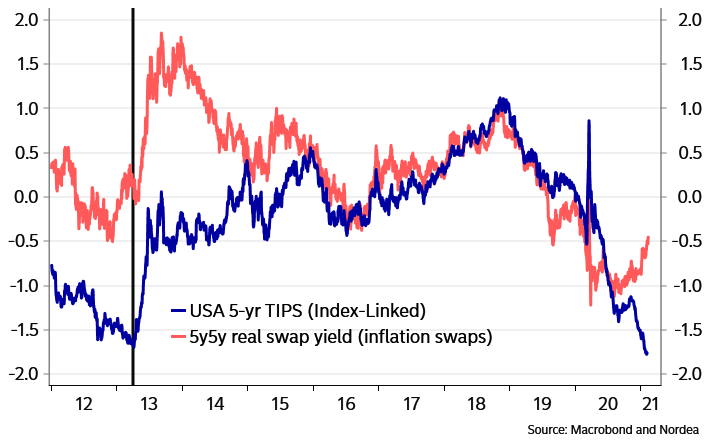
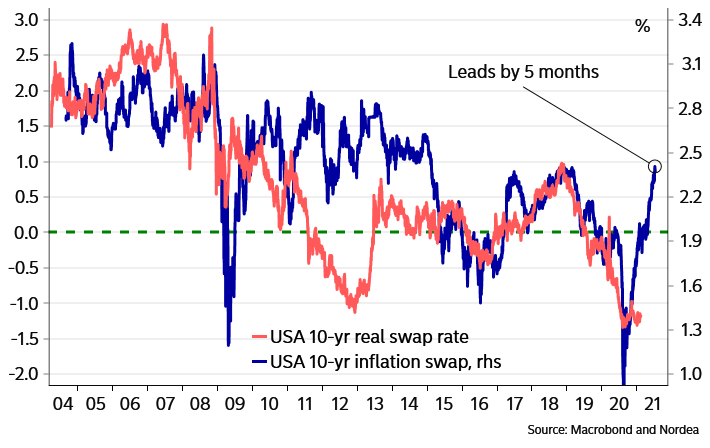
Well, bond investors might still have some say on longer-term rates and the back-to-normal theme seems to be humming here and there. Ten-year Treasury rates are up almost 40 bps since early August, an 82% jump. They were also up 50 bps (+31%) in the fall of 2020.

tnx

Real Treasury yields remain negative, a rather irrational investment unless one thinks they will get even more negative and attract other benchmarked investors seeking relative performances, never mind actually losing client money.

It is thus normal to hunt for higher yields and climb the risk stairs towards some real returns. The red rectangle below is where inflation, or inflation expectations, currently stand, showing that even US investment grade corporates are barely break-even in real terms. One needs to climb all the way down to High Yield debt to get half-decent real yields of 2.0-2.5%.

image
fredgraph - 2020-12-07T144448.349
fredgraph - 2020-12-07T144718.396

But it ain’t totally stupid considering what the CARES act has done to the riskier balance sheets…

US-HY-cash-levels-increasing.png

…and to many S&P 500 companies, recipients of nearly $400 billion of Uncle Sam “pandemic loans” in 2020:

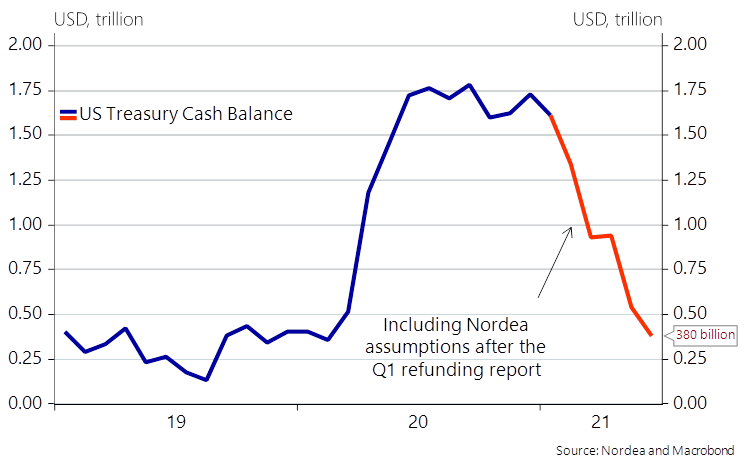
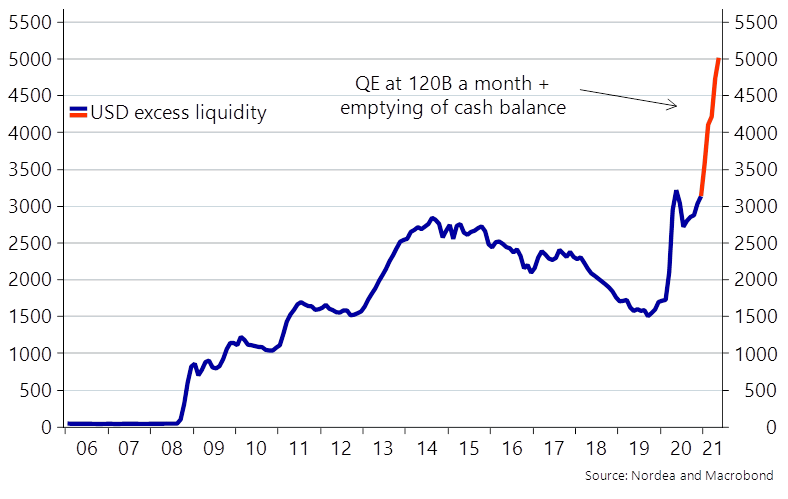
We shall see what happens to this excess money as we move towards immunization and normalization. For now, it is still rising and essentially stalled in bank accounts.

fredgraph - 2020-12-12T073205.165

fredgraph - 2020-12-12T073528.085

This liquidity flush keeps feeding financial markets, thriving on abnormality as never before. Bad normal world news is seen as good for investments, keeping governments and central banks focused on the immediate tasks, whatever the longer term effects.

The Bank for International Settlements, the central banks’ central bank, may be warning, again, that asset prices are disconnected from the real economy, nobody is listening. Claudio Borio, head of the BIS Monetary and Economic Department said last week that

we are moving from the liquidity to the solvency phase of the crisis. We should be expecting more bankruptcies going forward yet credit spreads are quite low by historical standards, and indeed while banks are pricing risk more carefully we don’t see the same in capital markets.

This move towards normality necessarily comes with people and companies paying off accumulated deferred liabilities (e.g. rents, mortgages, interest, payables). Money velocity will rise but excess liquidity will likely diminish.

For most ordinary people, normalization will be very welcome. For the investing crowd, it will mean seeking rationality in some basic, time-endured ratios when money-gushers dry out and normality becomes unsuspected reality:

  • the labor force participation rate, which was finally trending up in 2019, dropped from 63.4% to 61.5%. Among 65-year old and over, it dropped from 26.0% to 24.1%. How will these ratios evolve as labor demand normalizes? Wage rates? Profit margins?

fredgraph - 2020-12-12T081918.882

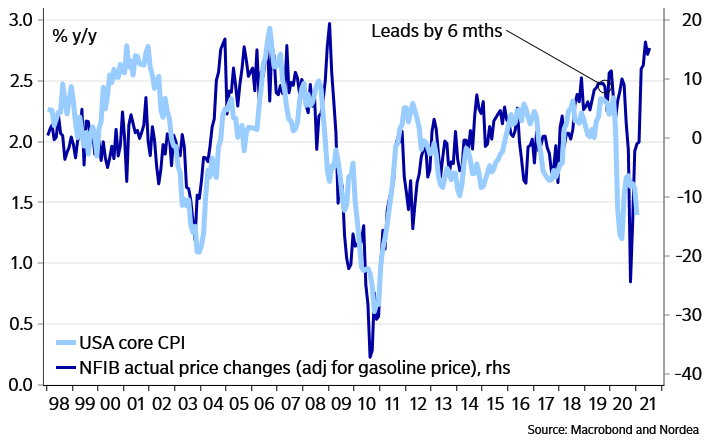
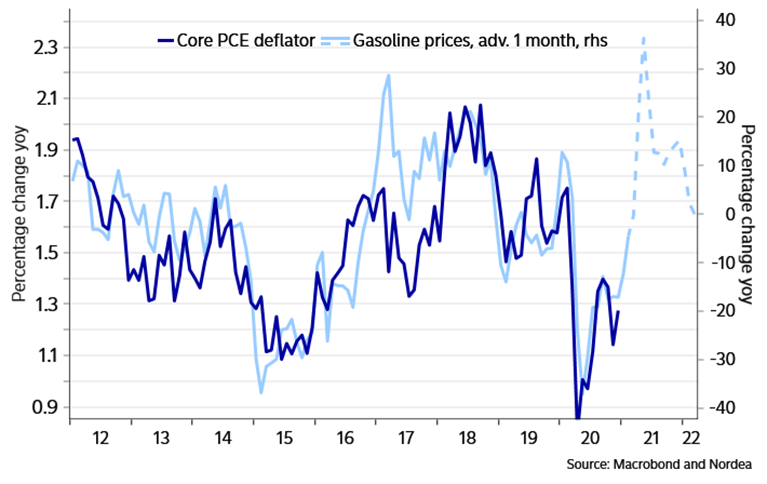
  • core inflation in the USA eased from the 2.0-2.5% pre-pandemic range to 1.6% as services prices stabilized amid widespread lockdowns. But goods inflation went from negative to +3.6% on strong pandemic demand and constrained supply. Many economists expect normalization to unleash demand for services, the supply of which has been reduced by thousands of bankruptcies and closings. The Fed has repeatedly said it will tolerate higher inflation but bond investors may not. Rising long-term rates would boost discount factors, reduce P/E ratios, and push TINA to the sidelines, hurting equity demand.

fredgraph - 2020-12-12T103442.286

This exuberant market sees silver linings everywhere with normalization on the horizon. Even sharply rising Covid19 positivity rates, hospitalizations and deaths can’t bring any adverse investor reactions: bad news can only beget continued official support, even more so now that vaccination is starting and normalization is visible.

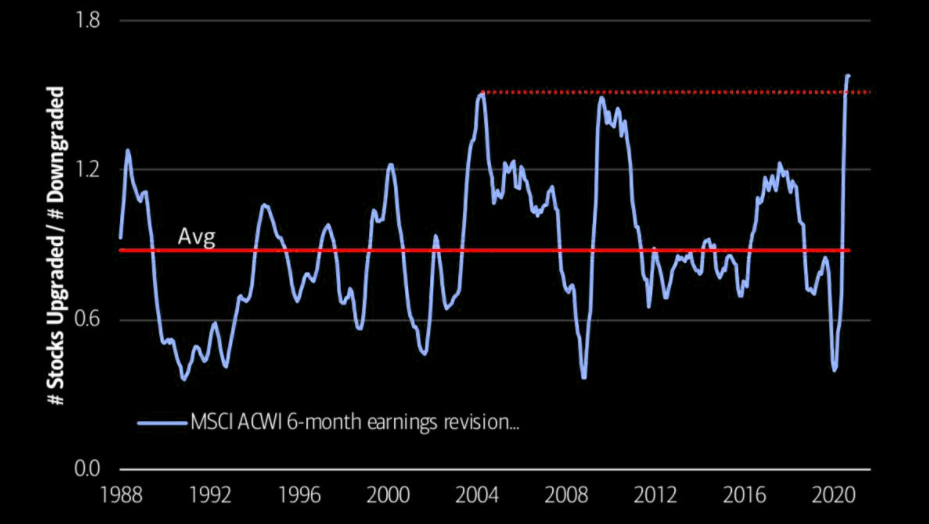
Visibility is not the right word for corporate profits these days: Q3 earnings surprised by 19.5% (!) and ex-Energy profits were almost flat YoY (-1.9%)! Who now wants to believe the Q4 estimates of a 7.5% drop in ex-E earnings?

Actually, who cares about earnings? Just look at these IPOs. Unless you’ve been investing long enough, you would think this is simply normal. SentimenTrader’s Jason Goepfert dug historical data for the younger crowd:

Using Bloomberg data going back to the early 1990s, let’s look at the total number of U.S. listed initial public offerings that showed a negative net income at the time of the offering. If they didn’t report financials at the time, then we ignored the listing.

Over the past year, there have been 88 IPOs that showed a negative number on the net income line. That exceeds all other rolling one-year periods except for 2000. But that year also had quite a few IPOs that were actually making money at the time. If we look at a ratio of money-losing to money-making companies that issued shares, the current environment stands out.

Jason goes on with data on the age of IPO companies (here) and concludes:

When risk appetite is high, equity investors are willing to accept ideas and concepts in lieu of revenue and profit. The only other time when both the average and median age of a newly public company neared this low of an age was 2000. (…) When bankers can feed investor appetites to this degree, and the only concern seems to be finding the next candidate to feed them, investors as a whole have a strong tendency to suffer in the months ahead.

Doug Kass and Crescat Capital also think nothing is even close to normal equity valuations these days:

unnamed - 2020-12-13T092340.292

On December 21, Tesla will electrify the S&P 500, insanely or ludicrously zipping its way among the largest index stock, boasting a more than $600 billion market cap. The highest EPS estimate for 2021 is $5.35 (average $3.80), which is a 113 P/E. No worries, AMZN was selling at 560 times in 2015 and the stock has quintupled since. Will TSLA dominate the EV and solar markets like AMZN dominates the online retail and cloud markets? They are both mainly software companies.

Investors are truly exuberant. Perhaps the world should not normalize too much!

NORMALIZATION AND THE RULE OF 20 STRATEGY

The Rule of 20 Strategy applies strict rules based on valuation (R20 P/E) and trends in earnings and inflation (R20 Fair Value). Now that effective vaccination is underway, we can use normalized earnings instead of the pandemic depressed trailing profits. The only other time normalized earnings were substituted to trailing earnings was in early 2009 when governments and central banks were clearly taking charge putting the end of the financial crisis in reasonably clear sight. In the current situation, up to now, it was too risky to presume that effective vaccines would be found and made widely available so rapidly.

At 3663, the Rule of 20 P/E is 23.1, still at 100% cash, but it would revert to 50% cash at 3630 (R20 P/E of 22.95).