The enemy of knowledge is not ignorance, it’s the illusion of knowledge (Stephen Hawking)

It ain’t what you don’t know that gets you into trouble. It’s what you know for sure that just ain’t so (Mark Twain)

Invest with smart knowledge and objective odds

THE DAILY EDGE: 1 DECEMBER 2020: Manufacturing PMIs

China Manufacturing PMI hits highest level for a decade in November

Chinese manufacturers signalled the strongest improvement in operating conditions for a decade in November, as growth of both output and new orders accelerated to 10-year highs. The sustained and strong upturn in client demand led to the fastest increase in employment since May 2011. At the same time, firms raised their purchasing activity at the steepest rate since January 2011 and increased their inventories of both pre- and post-production goods. Greater market demand contributed to stronger inflationary pressures, however, with both input costs and output charges rising at sharper rates.

The headline seasonally adjusted Purchasing Managers’ Index ™ (PMI ™ ) increased from 53.6 in October to 54.9 in November, to signal the sharpest improvement in conditions since November 2010. The health of the sector has now improved in each of the past seven months, to indicate a sustained and strong recovery from the coronavirus disease 2019 (COVID-19) outbreak earlier in the year.

image

Manufacturing companies in China recorded a sharp and accelerated rise in production during November, with the rate of expansion the quickest for 10 years. Firms frequently attributed the increase to greater new order volumes, as well as a further recovery from the COVID-19 related disruptions seen earlier in the year.

Overall sales likewise expanded at the quickest rate for a decade, which was often linked to a rebound in client demand. Underlying data suggested that the upturn continued to be led by firmer domestic demand, as growth in new export work was not as marked as that seen for total new orders.

image

Overseas demand improved substantially as the measure for
new export orders stayed in expansionary territory for the fourth
month in a row, rising from the previous month. As production overseas was subdued by uncertainties brought by the pandemic, Chinese enterprises saw an increase in export orders. But the improvement in overseas orders was slightly weaker than that of domestic demand.

Increased production requirements and higher inflows of new work led companies to expand their workforce numbers again in November. Though modest, the rate of job creation was the strongest seen since May 2011. Capacity pressures persisted, however, as highlighted by a further rise in outstanding business. Furthermore, the rate of backlog accumulation was the quickest since April.

November data also revealed a substantial increase in purchasing activity, with the rate of growth the steepest since the start of 2011. However, the time taken to receive purchased inputs continued to lengthen amid reports of stock shortages at suppliers.

On the inventories front, stocks of purchases rose further in November, and at the fastest rate since February 2010. Inventories of post-production items meanwhile increased at a rate that, though marginal, was the quickest for 33 months. Panel members often attributed stock building efforts to improved sales and stronger overall market conditions.

Greater demand for inputs placed upward pressure on costs in November. Input prices rose sharply overall, with a number of monitored firms commenting on increased raw material costs, with metals mentioned in particular. Companies raised their selling prices at a quicker pace as a result, though the rate of increase remained below that seen for operating expenses.

Business confidence regarding the 12-month outlook for output remained strongly positive in November, despite easing slightly since October. Optimism was linked to planned company expansions, supportive state policies and hopes that global conditions

Eurozone Manufacturing growth remains strong in November

The seasonally adjusted IHS Markit Eurozone Manufacturing PMI® fell slightly during November but remained at a level indicative of strong growth. Although the headline index slipped to 53.8, from 54.8 in October, it was slightly better than the earlier flash reading and signalled an improvement in manufacturing operating conditions for the fifth successive month. Moreover, growth remained well above the long-run survey average.

image

There was some notable divergence in performance across the broad market groups data during November. On the one hand, the capital and intermediate goods sectors continued to expand at marked monthly rates. However, in contrast, consumer goods producers registered a modest deterioration in operating conditions for the first time in six months.

imageExcept for the Netherlands and Ireland, all countries recorded a weakening of their respective PMIs during the latest survey period. Germany remained the best-performing country, followed by the Netherlands and Ireland.

Solid growth was seen in Austria and Italy, in contrast to marginal contractions recorded in both Spain and France. Greece remained by far the worst-performing in November, contracting at a steep and accelerated rate.

For the fifth successive month an increase in manufacturing production was recorded, although growth eased on October’s two-and-a-half year peak and was the slowest since July. A similar trend was seen for new orders, where growth eased to the weakest in the current five-month sequence amid a slowdown in gains across domestic and external markets.

Indeed, new export orders rose at the slowest pace since August, though growth remained solid. Germany, the Netherlands and Austria recorded the strongest gains in export trade during November.

Some pressure on capacity was signalled by a fourth successive monthly increase in backlogs of work, which continued to rise at a solid pace. Firms instead focused on productivity gains by lowering their staffing levels for a nineteenth successive month. Job losses were most prevalent in Greece, Germany and Austria.

Increased production and order requirements meant that firms continued to increase their purchasing activity, with growth amongst the best seen in the past two-and-a-half years. This served to further add pressure on suppliers, with average lead times for the delivery of inputs deteriorating to the greatest extent for seven months.

Inventories of raw materials and semi-manufactured goods were subsequently utilised wherever possible to ensure production lines could be sustained. Stocks of purchases fell markedly and for a twenty-second successive month in succession. Warehouse inventories were also depleted sharply, with latest data showing the greatest monthly fall since the end of 2009.

On the price front, input cost inflation accelerated to the sharpest recorded by the survey for nearly two years. All countries recorded stronger rises in input prices compared to the previous month.

Efforts to protect margins led to a second successive monthly rise in output prices, with the rate of inflation modest but nonetheless the strongest for a year-and-a-half.

Finally, looking ahead to the coming 12 months, business confidence improved to its highest for over two-and-a-half years. Dutch, Italian and German companies were the most confident manufacturers in November.

Japan Manufacturing PMI reaches highest level since August 2019

The Japanese manufacturing sector moved closer towards stabilisation in November, according to latest PMI® data. The higher headline PMI reading was supported by softer falls in output and new orders, which both declined at only mild rates. Despite the coronavirus disease 2019 (COVID-19) pandemic continuing to disrupt business operations and demand conditions, Japanese manufacturers remained optimistic that production will rise over the coming 12 months.

The headline au Jibun Bank Japan Manufacturing Purchasing Managers’ Index™ (PMI) rose slightly from 48.7 in October to 49.0 in November. The latest reading was the highest since August 2019, and signalled only a marginal deterioration in overall conditions, as the sector continued to take tentative steps towards more stable operating conditions.

image

The slight improvement in the headline index was supported by softer contractions in production and new orders. Output declined at the slowest pace since November 2019 and only modestly overall. Nonetheless, manufacturing firms continued to cite weak client demand as a result of the pandemic as the main factor weighing on production.

Similarly, new orders fell to the least marked extent since May 2019. Lower sales were often attributed to difficult trading conditions as a result of a surge in COVID-19 infections, which had dampened business and client confidence in both domestic and overseas markets. New export sales meanwhile declined after a slight increase in October, as key external markets including Europe imposed more restrictions to halt the spread of the virus.

At the same time, employment levels continued to decrease in November, although at a slightly softer pace compared to October. Firms often cited a lack of demand due to the pandemic as the main driver of job shedding, as well as the non-replacement of voluntary leavers. In line with a lack of new orders, outstanding business fell further in November. While strong overall, the pace of decline was the softest for ten months.

Japanese manufacturers signalled a rise in operating expenses for the sixth consecutive month in the latest survey period. However, the rate of input cost inflation slowed from October and was modest overall. Meanwhile, increased price competition due to the pandemic led to a renewed drop in prices charged in November, following an increase in the previous period.

Amid further falls in new orders and output, buying activity declined again in November, extending the current sequence of decline to 23 months. Manufacturing firms also noted difficulties in sourcing raw materials due to the pandemic, which led to a further deterioration in suppliers’ delivery times. As demand remained depressed, Japanese manufacturing firms indicated that stocks of both pre-production inventories and finished goods were depleted again.

Looking forward, business confidence regarding output over the year ahead remained positive, with expectations underpinned by hopes of an end to the pandemic and a recovery in both domestic and external demand.

(…) Currently, IHS Markit expects industrial production to grow 7.3% in 2021 although this is from a lower base and does not fully recover the output lost to the pandemic.

Virus vaccines offer hope for global economic recovery, OECD says Warning that rebound from pandemic’s economic damage will be patchy and fragmented

Cutting its 2021 global growth forecast to 4.2% from 5% in September, the Paris-based organization said a pattern of outbreaks and lockdowns is likely to continue for some time with rising risks of permanent damage.

There were particularly large downgrades for the euro area and the U.K., with the forecast for the latter slashed to 4.2% from 7.6%. The U.S. projection was lowered to 3.2% from 4%. (…)

Governments should continue to support their economies beyond the end of lockdown measures and avoid “fiscal cliffs,” according to the report. While public debt has soared, the OECD played down concerns, saying that borrowing costs are low.

It did, however, say some spending has been wasted, noting an “absence of correlation between the extent of fiscal aid and the resulting economic performance.” (…)

(…) “As we have emphasized throughout the pandemic, the outlook for the economy is extraordinarily uncertain and will depend, in large part, on the success of efforts to keep the virus in check.” Powell said in prepared remarks for his testimony on Tuesday to the US Senate Committee on Banking, Housing, and Urban Affairs. “The rise in new Covid-19 cases, both here and abroad, is concerning and could prove challenging for the next few months. A full economic recovery is unlikely until people are confident that it is safe to re-engage in a broad range of activities.” (…)

Cities Dealt a Blow as Return to Office Fades U.S. employees started heading back to the office in greater numbers after Labor Day but that pace is stalling now, delivering another blow to economic-recovery hopes in many cities.

(…) About a quarter of employees had returned to work as of Nov. 18, according to Kastle Systems, a security firm that monitors access-card swipes in more than 2,500 office buildings in 10 of the largest U.S. cities.

That rate is up sharply from an April low of less than 15%, which largely consisted of building-maintenance and essential workers. The office return rate climbed steadily during the summer and early fall, but it has flattened out after reaching a high point of 27% in mid-October, Kastle said. The rate for last week was down even more sharply than in previous weeks but likely reflected the Thanksgiving Day holiday. (…)

Metro public-transportation systems in cities such as New York, San Francisco, Boston and Washington, D.C., have lost billions of dollars in revenue from months of employees favoring remote work. (…)

Office holdings have long been a cornerstone investment for major real-estate funds for their steady and reliable income. But values are falling sharply as a growing number of tenants dump sublease space on the market or demand lower rents from their landlords when their leases expire. (…)

As of the beginning of November, 2.3% of office mortgages that were converted into mortgage-backed securities were more than 30 days delinquent, up from 1.7% in February, according to data firm Trepp LLC. (…)

Home prices in cottage country jump 15 to 40 per cent across Canada amid COVID-19

Return of the Obama Economists Biden’s policy advisers were in charge during the secular stagnation years.

The WSJ Editorial Board:

(…) They’re Obama veterans who believe in more spending, more regulation, higher taxes, and easier money. Let’s hope the result is better than what became known as “secular stagnation” during the Obama years. (…)

As Federal Reserve Chair in Mr. Obama’s second term, [Janet Yellen] was slow to raise interest rates and reduce the Fed’s bond purchases. She’ll likely favor a 2009-style policy mix next year with a spending blowout while urging the Fed to monetize it.

Mr. Biden has also signed up Jared Bernstein, an architect of the Obama stimulus who famously predicted in January 2009 that spending would keep unemployment below 8% and hit 7% by autumn of 2010. Not quite. The jobless rate hit 10% in October 2009, stayed at 9.9% through April 2010, and didn’t fall below 7% until November 2013. Mr. Bernstein put his trust in the Keynesian “multiplier” that $1 of new spending yields as much as an extra $1.57 or more of additional GDP. Wrong again. (…)

The overall message of Mr. Biden’s picks is of a progressive team that views government as the leading engine of economic growth. Our guess is that they’ll use the lingering damage from the pandemic to propose a major spending and tax increase in early 2021. (…)

Eurozone inflation remains negative ahead of ECB meeting Inflation in the eurozone remains stable at -0.3% in November. Core inflation: 0.2%. But with inflation this low for quite some time and not much improvement expected ahead, the ECB will certainly take action next week
China state-owned group caught in default storm owes banks billions Revelation that Huachen borrowed $5.1bn could prompt concerns over credit system

The FT viewed a creditor document that revealed that “almost 70 Chinese and foreign banks, as well as trust companies, had Rmb33.5bn ($5.1bn) in outstanding lending to Huachen Automotive Group as of last year.” The FT says that the longstanding belief among investors that local governments in China will always bail out troubled state-backed groups has been shattered, prompting fears about the health of the broader financial system.

OPEC Defers Decision on Output Curbs Cartel to meet Thursday with Russia and its other oil producers to agree on a plan

(…) A key hurdle to a pact remains how to deal with past noncompliance by some countries. Saudi Arabia, the U.A.E. and others in OPEC insist that overproducers, including Russia, Iraq and Nigeria, cut their output more in the first quarter, to make up the difference, delegates said.

Russia pumped 430,000 more barrels a day than agreed in the five months ended Sept. 30, according to an internal OPEC assessment. Moscow doesn’t see any need to cut its output deeper and would even favor a slight increase, people familiar with the discussions said. (…)

Exxon Slashes Spending, Writes Down Assets The struggling oil giant is retreating from a plan to increase spending to boost its oil and gas production by 2025 and preparing to slash the book value of its assets by up to $20 billion.
SENTIMENT WATCH

From Axios:

  • JPMorgan strategists earlier this month said they expect the S&P to reach 4,000 by early next year and raised their 2021 year-end price target to 4,500 — about 878 points, or 24%, above where it closed on Monday.

  • Analysts at Goldman Sachs raised their year-end 2021 target to 4,300 and to 4,600 by the end of 2022.
  • “During most of the bull market since 2009, our projections for the S&P 500 were either the most bullish or among the most bullish of Wall Street’s investment strategists. Now others are getting ahead of us,” longtime market bull Ed Yardeni wrote in a recent note to clients. “We’ll let them have the glory. We would like to see fewer bulls.”
  • Bank of America on Friday doubled down on its call for a 2021 that could disappoint the market’s freshly minted super bulls, noting that its fund manager survey’s “cash rule” was closing in on a sell signal.
    • Further, the bank’s contrarian Bull & Bear indicator showed increasingly thirsty stock traders and its “breadth rule,” which tracks whether global equity markets are overbought or oversold, signaled a sell call on Nov. 11.

    • They expect 2021 to be “a year of vaccine not virus, a year of reopening not lockdown, a year of recovery not recession … a year of asset market rotation not asset market rally.”

image(CNN)

image(Societe Generale)

image
Cryptocurrency has climbed to new record highs

The switch:

unnamed (16)

image(Barron’s)

image

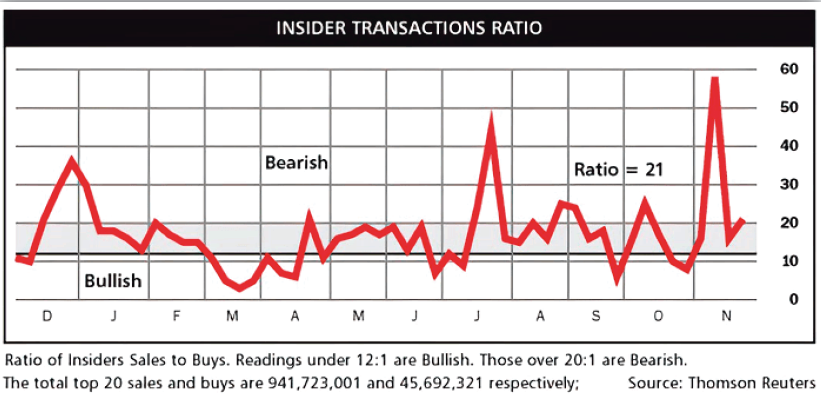
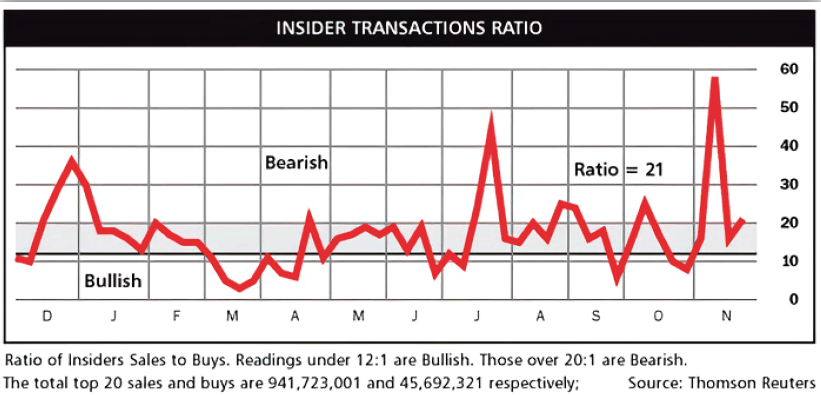
Among sectors tracked by INK, recent insider selling seemed particularly stronger in Energy, Consumer Staples, Financials, Telecom Services and Utes.

DoorDash Sets IPO Terms Pushing Valuation as High as $32 Billion DoorDash said it plans to sell 33 million shares in an initial public offering that could give the food-delivery company a valuation of as much as $32 billion.

The San Francisco company said it expects an offering price of between $75 and $85 a share, adding that a pricing at the $80 midpoint of that range would yield net proceeds of about $2.54 billion. (…)

Airbnb Inc. is expected to target a range of around $30 billion to $33 billion, using a fully diluted share count, when the home-rental startup kicks off its investor roadshow Tuesday, the Journal reported, citing people familiar with the matter.

Almost Daily Grant informs us that DASH’s $32B valuation would be double its valuation at its June private fundraising. And, if you care:

Sales through the first nine months of the year registered at $1.9 billion, more than treble the top line over the same period last year, while net losses narrowed to $149 million compared to $533 million over the first three quarters of 2019.   Nevertheless, persistent red ink appears endemic to the food delivery business, as peer Uber Eats reported adjusted Ebitda of negative $183 million in the third quarter, despite seeing revenues more than double to $1.5 billion.

A tripling in sales was not quite enough to bring black ink to the bottom line…ADG adds this gossip:

For DoorDash, the revelation of extra-legal shenanigans clouds those efforts to push into the black.  Last week, the company paid $2.5 million to settle a lawsuit from Washington D.C. Attorney General Karl Racine alleging that DoorDash helped itself to millions of dollars in driver tips.  In addition to that restitution, the company agreed “to maintain a payment model that ensures all tips go to workers without lowering their base pay, and it will be required to provide clear and easy-to-access information about its policies and payment model to workers and consumers.”

The timing of the settlement is ironic. Founder and chief executive Tony Xu, who owns some 42% of all super voting class B shares, wrote in a founder’s letter accompanying the filing that “fighting for the underdog is part of who I am and what we stand for as a company.”

Tesla to Enter S&P 500 at Full Weight in December The electric-vehicle maker will be added to the broad stock-market gauge before the start of trading Dec. 21, meaning most index-tracking funds that follow the S&P 500 will engage in a flurry of trading the Friday before.

(…) Tesla’s market value has ballooned to about $538 billion, making it the sixth largest company in the U.S. stock market and it would have more than a 1% weighting in the S&P 500. (…) More than $100 billion will be put into motion in coming weeks as passive fund managers and some actively traded mutual funds all benchmarked to the S&P 500 adjust their portfolios to make room for it, traders and fund managers say. (…)

S&P still hasn’t announced what stock Tesla will be replacing, saying it will release that decision after the market closes Dec. 11. (…)

The stock has jumped 39% since its inclusion was announced on Nov. 16 and there has been a frenzy of options trading tied to the shares jumping higher. (…)

State Street’s Mr. Bartolini said at least five of its exchange-traded funds will have to be rebalanced as a result of Tesla’s addition, including the biggest ETF in the world, the SPDR S&P 500 Trust ETF, and its growth-focused ETF, the SPDR Portfolio S&P 500 Growth ETF. (…)

France defies U.S. and starts levying digital tax on tech giants. But will this change with a Biden presidency?

(…) The French tax has been set at 3% of revenue derived from online advertising, the sale of personal data to third parties, and marketplace activities. It is levied on companies with revenue from these activities of more than €750 million globally and €25 million in France.

France isn’t the only European Union country intent on a digital tax. The U.K. has put a national version into law. The U.K. French, Spanish and Italian finance ministers signed a joint letter in August demanding that technology giants, like Google GOOGL, -1.82%, Amazon AMZN, -0.85% and Facebook FB, -0.30%, “pay their fair share of tax.” (…)

The clear hope of European governments is that the U.S. will rejoin the OECD talks, so that an international agreement on global tax can be struck next year. This should not be too difficult: Even the companies targeted by the measure have indicated their preference for a global tax, which would spare them the compliance costs of having to deal with many different national ones. (…)

‘It will change everything’: DeepMind’s AI makes gigantic leap in solving protein structures Google’s deep-learning program for determining the 3D shapes of proteins stands to transform biology, say scientists.

(…) DeepMind’s program, called AlphaFold, outperformed around 100 other teams in a biennial protein-structure prediction challenge called CASP, short for Critical Assessment of Structure Prediction. The results were announced on 30 November, at the start of the conference — held virtually this year — that takes stock of the exercise.

“This is a big deal,” says John Moult, a computational biologist at the University of Maryland in College Park, who co-founded CASP in 1994 to improve computational methods for accurately predicting protein structures. “In some sense the problem is solved.”

The ability to accurately predict protein structures from their amino-acid sequence would be a huge boon to life sciences and medicine. It would vastly accelerate efforts to understand the building blocks of cells and enable quicker and more advanced drug discovery. (…)

“It’s a game changer,” says Andrei Lupas, an evolutionary biologist at the Max Planck Institute for Developmental Biology in Tübingen, Germany, who assessed the performance of different teams in CASP. AlphaFold has already helped him find the structure of a protein that has vexed his lab for a decade, and he expects it will alter how he works and the questions he tackles. “This will change medicine. It will change research. It will change bioengineering. It will change everything,” Lupas adds. (…)

The Wuhan files Leaked documents reveal China’s mishandling of the early stages of Covid-19

THE DAILY EDGE: 30 NOVEMBER 2020

A Speedy Recovery Depends on More Aid. Will Trump Deliver? The economy can’t wait until January for more help for states, businesses and the unemployed.

Alan S. Blinder is professor of economics and public affairs at Princeton and served as vice chairman of the Federal Reserve, 1994-96.

Majority Leader Mitch McConnell sent the Senate home for recess without passing a new coronavirus relief bill. Treasury Secretary Steven Mnuchin has said he will pull the plug on several of the Federal Reserve’s emergency lending facilities. What are these men thinking? (…)

Senators and the public need to understand that it was Cares and the rest that propped up the economy “artificially” as the virus was pulling it down. But now, with Covid-19 raging uncontrolled, most of the Cares money has been spent and more will expire in late December; the Centers for Disease Control and Prevention moratorium on evictions will end Dec. 31; and Treasury intends to end its lending facilities by the end of the year as well. (…)

Don’t think the Federal Reserve can ride to the rescue if Congress fails. Not because the Fed doesn’t want to help. But because there isn’t much more it can do. (…)

So it’s up to Congress and what’s left of the Trump administration. They should be working overtime on a compromise fiscal package in the range of, say, $1 trillion to $2 trillion. (…)

The most recent Census Household Survey (Oct. 28- Nov.9) reveals that 33.7% of Americans find it hard to afford basic expenses, up from 31.9% five weeks ago. Axios lists the programs expiring in December:

  • Unemployment: Over 13 million Americans are relying on weekly unemployment checks through two programs that are weeks away from expiration.
  • Housing: After Dec. 31, homeowners can’t request penalty-free forbearance for federally-backed mortgage payments. The measure also stopped mortgage lenders from starting a foreclosure process.
  • Rent: The CDC order that halted evictions expires next month, too.
  • Student loans: The CARES Act paused payments on government-backed student loans without interest.
  • State aid: Whatever isn’t expended of the $139 billion allocated to states in the CARES Act will disappear at the end of the year.
A growing number of Americans are going hungry 26 million now say they don’t have enough to eat, as the pandemic worsens and holidays near

More Americans are going hungry now than at any point during the deadly coronavirus pandemic, according to a Post analysis of new federal data — a problem created by an economic downturn that has tightened its grip on millions of Americans and compounded by government relief programs that expired or will terminate at the end of the year. Experts say it is likely that there’s more hunger in the United States today than at any point since 1998, when the Census Bureau began collecting comparable data about households’ ability to get enough food.

One in 8 Americans reported they sometimes or often didn’t have enough food to eat in the past week, hitting nearly 26 million American adults, an increase several times greater than the most comparable pre-pandemic figure, according to Census Bureau survey data collected in late October and early November. That number climbed to more than 1 in 6 adults in households with children. (…)

No place has been spared. In one of the nation’s richest counties, not far from Trump National Golf Club in Virginia, Loudoun Hunger Relief provided food to a record 887 households in a single week recently. That’s three times the Leesburg, Va.-based group’s pre-pandemic normal.

“We are continuing to see people who have never used our services before,” said Jennifer Montgomery, the group’s executive director. (…)

Measures of Chinese Economic Activity Signal Widening Recovery Gauges of China’s manufacturing and nonmanufacturing activity climbed to their highest levels in three and eight years, respectively.

The official manufacturing purchasing managers index, a key measure of factory activity, rose to 52.1 in November from 51.4 in October, according to data released Monday by the National Bureau of Statistics. The reading is the highest since September 2017 and topped economists’ expectations for the index to edge up to 51.5 this month.

Meanwhile, China’s nonmanufacturing PMI, which includes services and construction activity, rose in November to 56.4, its highest level since June 2012, from a previous reading of 56.2 in October, the statistics bureau said. (…)

“A lot of restaurants are already full with long lines at the door. People are consuming and factories are already at their full capacity,” said Zhu Chaoping, a Shanghai-based global market strategist for J.P. Morgan Asset Management. The reason, he says: “We see the pandemic is controlled.” (…)

The subindex measuring production increased to 54.7 from 53.9 in October while total new orders, the gauge’s main driver, rose to 53.9 after remaining unchanged for two months at 52.8. And the export-orders component increased to 51.5 in November, up from 51.0, remaining above the 50 mark for three straight months.

Mr. Zhu said he sees room for China’s manufacturing strength to continue in the coming months, pointing to indicators suggesting that inventories are being depleted, which he said could lead to “a wave of restocking.” Mr. Zhu was also encouraged by a small uptick in the manufacturing PMI’s employment subindex, which points to factories hiring more employees to keep up with demand. (…)

OPEC, Russia Alliance Lean Toward Keeping Oil Cuts in Place OPEC and its Russia-led partners are leaning toward extending oil production cuts for another two to three months, according to officials familiar with the discussions, a move they hope will keep markets tight even as prices start to recover.
The World Is Bingeing on Debt—and Smashing Records Companies and governments have issued a record $9.7 trillion of bonds and other debt this year, as extraordinary support from the Fed and other central banks has fueled a borrowing bonanza.

(…) The total covers the year to Nov. 26 and includes nearly $5.1 trillion of corporate bonds, as well as some kinds of loans, including riskier leveraged loans, according to Refinitiv. Both figures already exceed those for any prior full year.

More broadly, the Institute of International Finance recently said global debt had risen $15 trillion to $272 trillion in the first nine months of this year, and is set to hit $277 trillion by year-end—a record 365% of world gross domestic product. The IIF is an industry group representing hundreds of financial institutions. Its figures are broader, and include household debt. (…)

American companies with investment-grade credit ratings have issued more than $1.4 trillion of debt this year, up 54% over the same period in 2019, Refinitiv data show. (…) Among riskier borrowers, U.S. junk-bond issuance has soared 70% to $337 billion, Refinitiv data shows. American deals make up the majority of sub-investment-grade debt globally. (…)

Emerging government debt has risen nearly 10 percentage points to 61% of GDP this year, its largest one-year increase since the late 1980s, and the pandemic has made a string of financial crises more likely, Mr. Kose said.

image

Hoisington Investment Management, led by Dr. Lacy Hunt, argues that

(…) high debt levels undermine economic growth. This causality is supported by the law of diminishing returns, derived from the universally applicable production function. Historical declines in economic growth rates have coincided with record levels of public and private debt. Total public and private debt jumped from 167.2% of GDP in 1980 to 364.0% in 2019, with an estimated record 405% at the end of this year. Gross government debt as a percent of GDP accelerated from 32.6% in 1980 to 106.9% in 2019 to an estimated 127% by the end of this calendar year.

As proof of this connection, each additional dollar of debt in 1980 generated a rise in GDP of 60 cents, up from 54 cents in 1940. The 1980’s was the last decade for the productivity of debt to rise. Since then this ratio has dropped sharply, from 42 cents in 1989 to 27 cents in 2019. (…)

image

Gavyn Davies, chairman of Fulcrum Asset Management, says in today’s FT that while “previous waves of debt have frequently ended in global financial meltdowns, including in Latin America in the 1980s, Asia in the mid-1990s and US housing in the 2000s” recent actions by central banks “ have made debt crises far less likely.” He believes that “Janet Yellen will keep the facilities operating by using the Exchange Stabilisation Fund in any new emergency. A final contrast with the 2008 financial crisis is that households now account for a much smaller fraction of the extra global debt, and the banking sector seems better capitalised and less leveraged.”

And while high corporate debt is very concerning, “a far more dangerous, systemic debt crisis probably requires a reversal of secular stagnation, and a rise in world inflation, forcing the Fed to tighten monetary policy significantly. Luckily, that still seems a very long way off.”

House to Vote on Booting Chinese Stocks From U.S. Over Audit Rules Lawmakers next week are likely to force Chinese companies with shares traded on American exchanges to finally comply with audit-oversight rules—or leave U.S. markets altogether.

(…) The legislation, if it becomes law, would give Chinese companies and their auditors three years to comply with inspection requirements before they could be kicked off the New York Stock Exchange or Nasdaq Stock Market. (…) More than 170 companies based in China or Hong Kong have completed IPOs in the U.S. since January 2014, raising about $58.7 billion, according to data from S&P Global Market Intelligence. (…)

Typically, when the NYSE or Nasdaq delists companies, their shares continue to be traded over the counter, so investors can keep buying and selling them. But Mr. Kennedy’s bill would also ban OTC trading of Chinese companies whose audits hadn’t been inspected after three years. (…)

Some companies have already said they would switch to non-U.S. exchanges if the legislation passes. E-commerce giant Alibaba, which is listed on the NYSE with a secondary listing on the Hong Kong stock exchange, has said the legislation could force its U.S. investors to convert their holdings into Hong Kong shares. But some investors will have trouble doing that, since not all U.S. brokerages offer access to foreign stocks. (…)

“They could use the threat of an impending delisting to take the company private at a low price,” said Jesse Fried, a law professor at Harvard University. “Then this law would have made U.S. investors worse off.”

Following up on KKR’s Henry McVey views expressed in the Nov. 27 Daily Edge:

Pointing up China Opens Its Bond Market—With Unknown Consequences for World The nation’s entry into the World Trade Organization rocked global commerce. The financial markets could be next.
(…) Global pension funds, starved for yield in a low-growth world, will now have access to safe government debt that pays more than 3%. And if officials deliver on their pledges to open up, reinforced in the Communist leadership’s 2021-25 five-year plan outlined in October, Chinese investors may soon find it a lot easier to snap up shares in Apple, Starbucks, or Tesla—not just their phones, cappuccinos, and cars. The Chinese could join their government, which has long been a major buyer of overseas assets such as Treasuries, as a powerful source of funding.

“China will turn from an exporter of goods to an exporter of capital, with significant consequences, of course, for the world,” says Stephen Jen, who runs Eurizon SLJ Capital, a hedge fund and advisory firm in London. (…)

Jen, who started his career at Morgan Stanley covering the impact of the Asian financial crisis on the foreign exchange market, sees China’s capital market opening as the biggest structural change to international finance since the launch of the euro.

Sustained inflows of foreign capital could make Beijing comfortable about loosening the controls that have bottled up domestic money in China for so long. Indeed, it would probably have to; otherwise the yuan would strengthen, eroding the country’s export competitiveness. That would let loose a wave of Chinese savings on the world—Jen estimates there’s as much as $5 trillion of pent-up Chinese demand for investments outside China. That could resemble the petrodollars that flowed from oil-exporting countries in the 1970s, which ended up financing a huge, and tragically unsustainable, borrowing spree by Latin American nations. (…)

“The demand is off the charts for anything liquid with a little bit of pickup in yield over Treasuries,” he says. “People are willing to pay up for liquidity, and that’s the key thing that’s improving in the Chinese onshore market. So inevitably we’ll be pushed in that direction.”

China’s central government bonds are now included, or on a phased path to inclusion, in the three key international bond indexes that investors use as benchmarks compiled by FTSE Russell, JPMorgan Chase, and Bloomberg Barclays (part of Bloomberg LP, the owner of Bloomberg Markets). About $5.3 trillion in assets tracks these indexes, according to estimates from Goldman Sachs Group Inc. Passive index-tracking funds will need to buy Chinese bonds to match the benchmarks. Some active managers, concerned about transaction costs, may steer clear; others are likely to overweight China because of the attractive yields.

China’s bond yields look more like those of emerging markets—in the FTSE World Government Bond Index benchmark they will be second highest after Mexico’s—yet investors will probably view them as developed-market securities, Goldman analysts say. After pulling in $230 billion from foreign investors to its fixed-income market in the past five years, China will see about $770 billion more in the next five, Goldman analysts including Kenneth Ho estimated in October.

(…) the money will need to come from somewhere. Overseas investors held almost 13% of Japanese government bonds and more than 30% of Treasuries at the end of June. About one-quarter of euro region government bonds are held by investors outside the currency union, according to estimates from Commerzbank AG. (…)

Washington, in particular, could find itself competing with Beijing for overseas capital. China’s current account is barely positive relative to the size of its economy, even with its large trade surpluses with the U.S. It runs vast deficits in the trade of services, and some economists predict it will in the future run current-account deficits. If that happens, China would need to pull in money from abroad, just as the U.S. has for decades. (…)

“The harder the U.S. tries to isolate China, the more efforts China should make in opening up,” says Yao Wei, chief China economist at Société Générale SA in Paris. “Allowing in more foreign investments will further deepen China’s integration into global financial markets, which will make decoupling more difficult.”

Chinese regulators hope that opening their bond market will improve how credit gets allocated. The nation’s Communist leadership has sought to transition the economy to a more market-based system in which investors and credit analysts price funding for different borrowers according to their risk. Policymakers hope that will stem the buildup of stressed and defaulting loans, reduce excess capacity, and result in more productive investment. (…)

Right on cue, last Saturday:

China Should Further Open Up Finance Sector, PBOC Official Says More liberalization in the financial sector would provide extra support to the real economy, according to Liu Guiping, vice governor of the People’s Bank of China. He was speaking at a forum on Saturday organized by the China Finance Society.

More on the USD from Bloomberg:

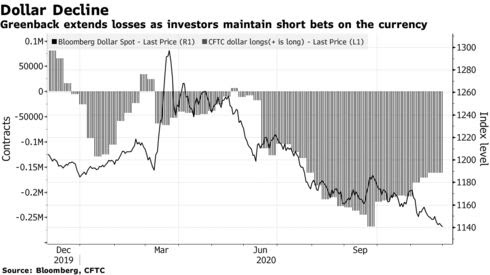
The dollar’s protracted slump is spurring G-10 peers to test two-year highs, underlining how it went from a haven asset as virus fears peaked to a weakening currency expected to fall further in 2021.

  • The Bloomberg Dollar Index is set for a 2.7% drop this month, taking the plunge to 12% from a March high. China’s economic rebound and bets on a vaccine are bringing key levels into play for currencies from the Aussie to the euro and Canada’s loonie.
  • Citigroup sees the dollar dropping up to 20% next year as vaccines become widely available. Goldman favors shorting the currency against the Australian dollar and loonie. Record U.S. infections and division over a new stimulus are also adding pressure on the world’s reserve currency.

Trump to add China’s chipmaker SMIC, oil and gas producer CNOOC to blacklist

EARNINGS WATCH

W now have 487 reports, an 85% beat rate and a +19.4% surprise factor.

Q3 earnings are seen down 6.5% compared with -21.4% expected on Oct. 1. Revenues are down 0.9% (-4.4% on Oct. 1).

Q4 earnings are seen down 11.1% compared with -13.6% expected on Oct.1. Revenues: -1.5%.

Trailing EPS are now $142.35. Full year 2020 estimate: $137.72. 2021: $168.63.

Pre-announcements remain favorable:

image

TECHNICALS WATCH

News on health and politics cheered investors last week. Risk appetite clearly rose and broadened as just about every type of stock rose, small, large, value, growth, tech, spec and spac. The all-inclusive NYSE topped its January peak.

Remarkably, the S&P 500 equal-weight index handily exceeded its previous high to end the week 15.5% above its October low. Meanwhile, its weighted sibling only manage a marginal topping for an 11.4% gain for the same period. Nasdaq could not make it back to its September 2 high but its 10.9% gain in November suggests this is not a rotation out of tech but rather a broadening of investor appetite.

spy

rsp

SENTIMENT WATCH

David Rosenberg in the National Post: “Bullish sentiment is simply off the charts. Last week’s Investors Intelligence data showed the bull camp expanding to 59.2 per cent from 53.6 per cent, while the bear share dwindled to 19.4 per cent from 20.6 per cent. We are back to an extreme gap of 40 percentage points between bulls and bears. Caveat emptor.”

Ed Yardeni has the chart on the II Bull/Bear gap…

image

…and that of the AAII crowd:

image

But he also has this one showing that corrections are now considered highly improbable…Highly improbable.

image

Finally, he’s got the II Bears + Correction chart:

image

And one last one FYI:

image

Rosenberg goes on:

The biggest risk right now, obviously, is the spreading virus. We have now seen 100,000 cases or more in the United States in each of the past 10 days. They are soon on their way to over 200,000 in the next 60 days as winter arrives. These numbers have soared threefold since early October, to record highs, and are rising substantially in 48 of the 50 states. Shutdowns at the state level are also coming back. (…)

Now, I have gone on record and stated that we are in a depression — not a recession, but a depression. And I think the dynamics of a depression are different than they are in a recession, because depressions invoke a secular change in behaviour. Classic business cycle recessions are forgotten about within a year after they end. At a minimum, depressions entail a prolonged period of weak economic growth, widespread excess capacity and a fundamental shift in attitudes towards spending and credit. (…)

Aging demographics and a massive debt overhang will act as significant constraints on aggregate demand growth that will outlast the brief boost to domestic demand we’ll get once the vaccine arrives.

Coming out of this pandemic, however, I do see some bullish secular themes emerging. As we go into an era of elevated personal savings rates, people are going to focus on what they need, not what they want. Anything related to e-commerce, 5G, cloud services and wiring up your home to become your new office is in a budding new secular growth phase. Delivery services have now become essential. I should tack on that grocery chains with online services come out of this as a winner. Microsoft has become a utility. One could argue that Amazon has become a utility. One could also argue that Google has become a utility. It’s apparent to me that you want to have exposure to health care, because this clearly is an under-invested area. Though, as I have said, I’d prefer to pick these plays up at better prices than we have today, and I would be an avid buyer of defensive-growth on any significant pullback. (…)

He concludes advising to focus your investments on what is scarce globally: growth, yield, safety and inexpensive assets.

Moderna plans to seek clearance for its shot in the U.S. and Europe today after analysis showed it was highly effective, with no serious safety problems. (Bloomberg)

The move toward value is in full swing (Via Axios)

San Francisco’s apartment vacancy rate has more than doubled since last year as tenants desert the market, which had some of the world’s most expensive housing before people scattered during the pandemic, the S.F. Chronicle reports (subscription).

unnamed (15)

Lightning This Year’s Hurricane Season Smashes All Kinds of Records 2020 was a season of superlatives, including a record-breaking 30 named storms forming over the Atlantic basin
(…) The previous record-holding year, 2005, had 28 storms: 21 were named using the year’s official alphabetical list; six storms were named using letters from the Greek alphabet; and there was one storm that went unnamed after it was identified in a postseason review.

The years 2020 and 2005 are the only times on record that the National Hurricane Center has had to use the Greek alphabet to name storms, as is protocol when the official names list is exhausted.

Tropical Storm Cristobal set a record for the earliest appearance of a C-named storm on June 2, while Tropical Storm Edouard set a record for the earliest appearance of an E-named storm on July 6. Every storm since Edouard also set the record for earliest appearance of a storm with its particular letter.

The pace was so fast that the National Hurricane Center’s 21-moniker list for 2020 was exhausted by Sept. 18.

Just four days earlier, the National Hurricane Center logged something that meteorologists have recorded only once before: five or more tropical cyclones with winds of 30 miles an hour or greater in the Atlantic basin simultaneously. (…)

A record number of named storms also made landfall in the U.S. in 2020. There were 12 this season, surpassing the record set when nine made landfall in the 1916 season, said Phil Klotzbach, a research scientist with the Department of Atmospheric Science at Colorado State University. (…)

The year 2020 also ranks as one of the more extreme hurricane seasons according to a metric called accumulated cyclone energy, or ACE, which measures the frequency, intensity and duration of storms in a season. (…) In all, November saw 20 named storm days, tying it with 1932 for the most named storm days recorded in the Atlantic in a November. (…)

Cumberland Advisors’ David Kotok recently posted a really interesting commentary by Bob Bunting, CEO of the Climate Adaptation Center. Some excerpts:

(…) The process from disturbance to hurricane or major hurricane usually takes days, but things are changing! As the climate has warmed, worldwide temperatures have steadily increased since 1850, and almost all the years of the 21st century so far are among the top 20 warmest, so hurricanes now have warmer seas to feed energy into them. In 2017 I coined a term to describe what I believe is a step function in rapid hurricane development. I call it Explosive Development; NOAA uses that term Rapid Intensification, which means an increase in wind speed of 35 mph in a tropical storm or hurricane within a 24 hour period. But the term doesn’t quite capture the meaning in a way the public can relate to, so at the Climate Adaptation Center we call are using explosive development.

Just this year, nine storms have exhibited this explosive behavior, and some have set intensification records, including Laura, Eta, and Delta, all of which made US landfall. It’s been a record year for US direct hits by tropical storms. Twelve have struck the US, and the season is not over yet! Up until now, the highest number of storm hits in the US was nine in 1916.

Eta intensified from a tropical depression to 155-mph sustained winds in just 36 hours! Imagine if Eta had done that just off the coast of the US and then hit a major metro area. (…)

The trend toward more rapidly developing storms may be far from peaking. Researchers at MIT, led by colleague Dr. Kerry Emanuel, used a computer study that compared hurricanes generated from 1979 to 2005 and then, based on expected climate warming by 2100, ran another simulation. The frequency of storms rapidly intensifying near a coastline with an increase in wind intensity of 70 mph or more in a 24-hour period increased from one such storm in a hundred years to one every 5–10 years. That’s an increase of 10 to 20 times and further confirms my own predictions on this subject. Other scientists have done similar work, and while details differ, all studies lead to the same general conclusion. The risk of catastrophe is rising along populated coastlines of North America; risk management is becoming an ever more urgent activity; and that is what we need to get about doing!

Hurricanes are also displaying two other changes in characteristics that are adding to risk. The first is that they are slowing down because the Earth is warming faster at the poles than at the equator. As that happens, the temperature difference between pole and equator decreases, slowing the steering winds that move weather systems. Hurricanes are stalling more frequently. We saw that with Harvey in Texas, Florence in the Carolinas, Dorian over the Bahamas, and Eta over Central America and the Gulf of Mexico. In each case, not only did storm winds do more damage but also rainfall caused epic flooding. Harvey set a world record of over 60 inches, and Eta probably dumped a similar amount in Central America. (…)

If that scenario were not enough, also consider that these storms that rapidly intensify often have “pinhole eye” structures that are just 10 to 15 miles wide. Eta’s was 10 miles wide; Laura’s was 20 miles wide. These small eyes concentrate the wind; and when they come ashore, they are like large EF3 tornadoes. Hurricane Michael was also a rapid intensifier with CAT 5 force and a 10-mile-wide eye. It wiped out Mexico Beach in Florida just two years ago, doing $8 billion in damage in a relatively unpopulated area.

Damage to a major US city or cities could top $1 trillion if they were hit by a rapidly intensifying Cat 4 or Cat 5 storm. The stage could be set for a mass casualty event. Are we ready?

Still not convinced? From 1980 to 2000 there were a total of five Category 5 storms in the Atlantic basin. The basin includes the Gulf of Mexico, the Caribbean, and the Atlantic Ocean. Since 2000, there have been 14 Category 5 hurricanes; and should Hurricane Eta be reclassified as a Category 5, as I suspect it will when site surveys are complete, then the total will be 15. (…)