Unemployment Claims Hold at High Level The number of applications for unemployment benefits has held at just under 900,000 a week this month, suggesting the labor-market recovery is stalling as layoffs restrain hiring gains six months into the pandemic.
Jobless claims increased slightly to 870,000 last week from 866,000 a week earlier, according to Thursday’s Labor Department report. (…)
One reason is that layoffs have continued at a high rate. Some employers that held on to workers at the beginning of the economic crisis are now reducing their head counts because of persistently weak demand. A rise in coronavirus cases this summer triggered new business restrictions and related layoffs, and some small businesses that had relied on government aid to keep workers on payrolls had to cut staff when that money ran dry. The Labor Department will provide an updated look at the jobs market in September on Oct. 2.
At the same time, many workers are returning to their previous jobs or finding new ones, but not at a high enough rate to offset overall job losses from earlier in the pandemic. Re-employment has contributed to a decline in the number of people collecting unemployment benefits through regular state programs, which cover most workers. So-called continuing claims decreased by 167,000 to about 12.6 million for the week ended Sept. 12. (…)
Millions of workers are collecting jobless benefits through a federal pandemic program for the self-employed, gig workers and others not typically eligible for unemployment aid. At the beginning of September, about 11.5 million people were claiming benefits through this program, a decrease of about 3 million from a week earlier, driven by a large drop in California, according to the Labor Department. Many economists are skeptical about the accuracy of pandemic claims figures, given the sharp revisions to the numbers and widespread unemployment fraud tied to the program. (…)

(Data: Department of Labor; Chart: Andrew Witherspoon/Axios)
Homebase data suggests a levelling off in jobs
This coronavirus dataset is based on Homebase data for over 60,000 businesses and 1 million hourly employees active in the US in January 2020. All the rates compare employment that day vs. the median for that day of the week for the period January 4, 2020 – January 31, 2020. (ING)
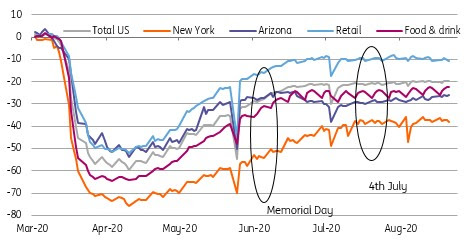
This coronavirus dataset is based on Homebase data for over 60,000 businesses and 1 million hourly employees active in the US in January 2020. All the rates compare employment that day vs. the median for that day of the week for the period Jan 4, 2020 – Jan 31, 2020.
Source: Bloomberg, ING
- JPMorgan cut its U.S. growth forecast, joining Goldman in citing the failure to seal a fiscal deal. The firm sees 2.5% annualized growth next quarter, down from 3.5% in an earlier estimate. The bank also trimmed its first-quarter outlook to 2% from 2.5% and expects GDP to rise 2.3% in 2021 after a 4.2% drop this year. A “blue wave” of Democratic wins for the presidency, House and Senate would see a larger fiscal impulse to demand in 2021. (Bloomberg)
-
Democrats Prepare New Coronavirus Aid Proposal A scaled-down package on coronavirus aid of about $2.4 trillion would include assistance to airlines, restaurants and small businesses. Republicans doubt a deal is doable before Election Day.
U.S. New Home Sales Strengthen Unexpectedly in August, But Prices Ease
Sales of new single-family homes increased 4.8% during August (43.2% y/y) to 1.011 million (SAAR) from 965,000 in July, revised from 901,000. Sales also increased sharply in June to 841,000, revised from 791,000. The Action Economics Forecast Survey expected a decline in sales to 893,000.
Purchases of new homes were mixed across the country. The South led the strength with a 13.4% jump (50.0% y/y) to 636,000, the highest sales level since December 2005. Sales in the Northeast rose 5.0% to 42,000 (27.3% y/y), though that remained below the June high of 53,000. Elsewhere in the country, sales eased m/m. In the Midwest, sales fell 21.4% to 99,000 (+54.7% y/y), although that reversed only part of July’s 59.5% rise. Sales in the West slipped 1.7% to 234,000 (+26.5% y/y) and remained just below the January high.
The median price of a new home eased 4.6% (-4.3% y/y) to $312,800 in August. The average price of a new home slipped 0.8% (-6.0% y/y) to $369,000 in July. These prices are not seasonally adjusted.
The months’ supply of new homes on the market plunged again in August to 3.3 months, down from the April high of 6.8 months.

Flash PMI surveys hint at cooling of global economic recovery in September
Flash PMI surveys for the four largest developed economies (the US, Eurozone, Japan and UK), which collectively account for approximately half of global GDP, indicated further growth in September, but also signalled that the expansion lost some of its momentum. The G4 economies’ flash PMI output index* fell from 52.6 in August to 51.6 in September.
Note that the decline in the index merely points to an easing in the rate of expansion rather than a contraction. The historical relationship of the flash PMI with global GDP suggests that the latest reading is broadly consistent with the global economy growing at an annual rate of 2.2%, down from a signal of 2.6% growth in August.
Note also that this does not mean GDP was 2.2% higher than a year ago in September, but merely indicates that the global economy is expanding at a rate equivalent to 2.2% per annum. At such a modest pace, it would take many months, if not years, to recoup the huge loss of output that occurred during the height of the pandemic, when lockdowns in many countries led to record low PMI readings. (…)
IHS Markit’s Global COVID-19 Containment Index (which takes a weighted basket of restriction measures in each country to gauge the degree of ‘lockdown’) has fallen less than previously expected in August and September, reflecting a slower than previously planned re-opening of economies. For example, the index (for which readings of 100 signal full virus-fighting lockdowns and zero indicates no restrictions), has fallen markedly from a peak of 64 back in April, but at 32 in September is far higher than the level of 21 that had been expected for September based on government’s plans to reopen their economies back in June.
The reopening of economies has been especially slower than previously anticipated in all G4 economies, as rising infection rates have derailed the loosening of restrictions on social mobility and mixing. In all cases, containment measures are expected to at least remain stable through to the end of the year, but many governments continue to report that further containment may be necessary if infection rates rise. (…)
Rising employment was only evident in the US, which was also the only major economy to see backlogs of work increase to any significant extent. These gains hint that the US upturn appears to have longer legs than other G4 economies.

CHINA: SEPTEMBER SALES MANAGERS INDEX SHOWS INCREASING SIGNS OF RESURGENT GROWTH
“Are your sales higher / the same / lower than last month”.
Respondents have become increasingly positive over the past few months, as would be expected as the impact of Covid-19 gradually recedes. September is the fifth successive month of Index figures over 50, with each month higher than the previous one. The September Index reading is now well over the 50 “zero growth” level and at an 11 month high, reflecting the fact that an increasing number of panelists are seeing modest growth emerging from the wreckage of the months most affected by the closedown. However indications of significant real growth (as opposed to relative growth compared with the previous months) are still relatively few, suggesting that renewed growth is not evident in all sectors of economic activity.
The Jobs Index question asks whether staffing levels are higher or lower than in the same period a year earlier.
Overall the balance of replies shows considerable improvement, and the Staffing Levels Index is now at an 8 month high, with Manufacturing employment levels starting to approach the levels seen a year ago. However employment in the Services sectors still lags some way behind levels seen prior to the Covid-19 close down.

CHINA: BUSINESS CONFIDENCE INDEX
2020 Global Corporate Defaults Continue to Rise The pace of global corporate defaults remains high despite signs of economic recovery in many parts of the world following the coronavirus-related crisis.
(…) All 2020 defaulters had speculative-grade IDRs at the beginning of the year, with the vast majority concentrated in the ‘CCC’-‘C’ range. (…)


USD142 Bil. of Bank Debt at Elevated Risk of Losing Investment Grade USD142 billion of ‘BBB-‘ rated bank debt could be at elevated risk of a downgrade to sub-investment grade. A further USD150 billion could be at risk of falling below IG should there be a marked deterioration in our baseline expectations.

VIRUS UPDATE
Youth accounted for 20% of coronavirus cases this summer
The CDC says people in their 20s accounted for more than 20% of all COVID cases between June and August, bringing the median age of coronavirus patients to 37, down from 46 in the spring.
- Why it matters, from Axios’ Marisa Fernandez: Young people are less vulnerable to serious illness. But they contributed to community spread over the summer — meaning they likely infected older, higher-risk people, especially in the South.
Now this, also via Axios:
In the era of social distancing, President Trump tweeted these two pics from his rallies this week: Above, Pittsburgh on Tuesday. Below, Jacksonville last night.


Cuomo says New York officials will do separate vaccine review US state’s governor warns federal process for approving jab has become too politicised
- “I’m not going to trust the federal government’s opinion, and I wouldn’t recommend to New Yorkers, based on the federal government’s opinion,” said Cuomo.
Covid Scientists Find a Turning Point in Life-Threatening Cases
(…) increasing evidence suggests that a significant minority of Covid-19 patients get very ill because of an impaired interferon response. Twin landmark studies published Thursday in the journal Science showed that insufficient interferon may lurk at a dangerous turning point in SARS-CoV-2 infections.
“It looks like this virus has one big trick,” said Shane Crotty, a professor in the Center for Infectious Disease and Vaccine Research at the La Jolla Institute for Immunology in California. “That big trick is to avoid the initial innate immune response for a significant period of time and, in particular, avoid an early type-1 interferon response.” (…)
The possibility that interferon may help some people is enticing because it appears most efficacious in the early stages of infection, when life-threatening respiratory failure could still be averted. Dozens of studies of interferon treatment are now recruiting Covid-19 patients. (…)
DEATH COUNTS
From the FT (free to read):
There are concerns, however, that reported Covid-19 deaths are not capturing the true impact of coronavirus on mortality around the world. The FT has gathered and analysed data on excess mortality — the numbers of deaths over and above the historical average — across the globe, and has found that numbers of deaths in some countries are more than 50 per cent higher than usual. In many countries, these excess deaths exceed reported numbers of Covid-19 deaths by large margins.
The picture is even starker in the hardest-hit cities and regions. In Ecuador’s Guayas province, there have been 10,000 more deaths than normal since the start of March, an increase of more than 300 per cent. London has seen overall deaths more than double, and New York City’s total death numbers since mid-March are more than four times the norm.
There are several different ways of comparing excess deaths figures between countries. In absolute numbers, more people than would usually be expected have died in the in the US than in any of the other countries for which recent all-cause mortality data is available.

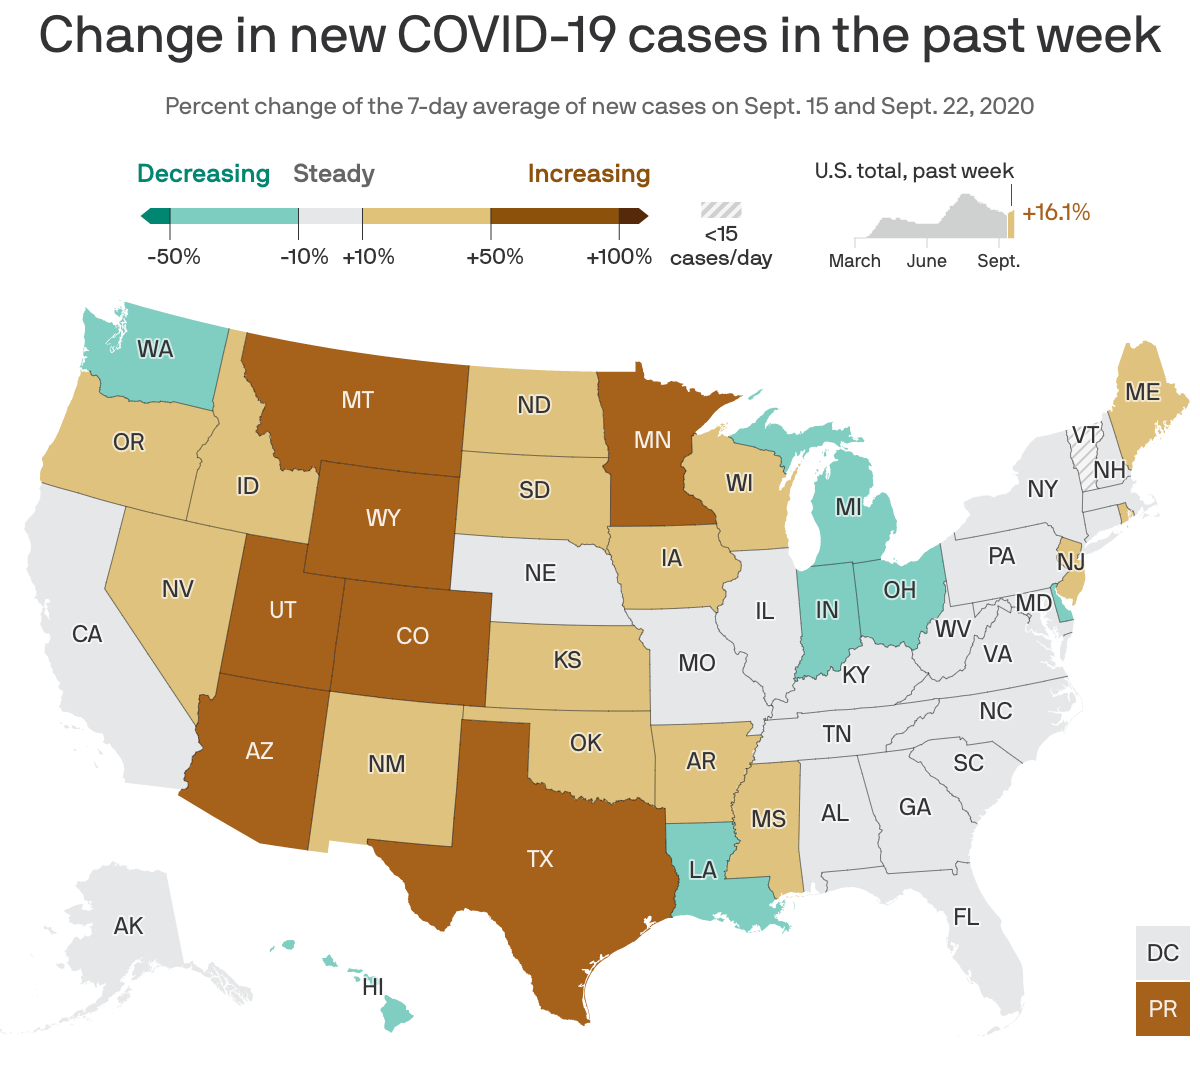
U.S. cases are now doubled their late spring level while hospitalizations, which follow cases with a lag, are at their same June level. The number of daily deaths, which tend to lag hospitalizations, are 55% above their June level. Almost at 200k deaths so far, the U.S. could soon find itself at a 1000 deaths per day.

EQUITIES
Palantir Expected to Be Valued at Nearly $22 Billion in IPO Palantir Technologies is expected to fetch a lofty valuation in its transition to a public company despite an unusually aggressive governance structure, in the latest sign of investors’ voracious appetite for new shares.
The data-mining-software specialist is eschewing the traditional IPO route and going public through a direct listing, in which a company floats its existing shares on a public exchange and lets the market determine the price. Ahead of a debut planned for September 30, Palantir’s bankers have told investors the shares could start trading around $10 apiece, according to people familiar with the matter. That equates to a market valuation of nearly $22 billion on a fully diluted basis.
In the private markets over the past year, Palantir’s stock has trended higher. The volume-weighted average price in August was $7.31 and in September, $9.17. (…)
Palantir makes software used by numerous government agencies—including tools to help track terrorism suspects—as well as businesses to help sort and analyze data.
The strong demand for the money-losing company’s stock is all the more remarkable given that its founders have put in place one of the most aggressive governance structures ever seen. The shares of Palantir’s three co-founders—billionaire investor Peter Thiel, Chief Executive Alex Karp and President Stephen Cohen—are structured so they could become more potent as the men sell down their stakes, according to securities filings. Through a unique feature of the voting structure, Mr. Cohen, for example, could still effectively control the company by owning just 0.5% of the shares. (…)
This year is shaping up to be one of the busiest years for IPOs on record, as investors leap at opportunities to invest in fast-growing technology upstarts. Issuers had taken in $95 billion from U.S.-listed IPOs through the end of Wednesday, exceeding the $84 billion raised at this point in 2000, the previous record year, according to Dealogic.
Newly public shares in many cases are soaring, rising an average of 22% on their first day of trading. That is the best average first-day performance since the tech boom. (…)
For fiscal year 2020, Palantir said it anticipates revenue growth of 42% to roughly $1.1 billion.
Like many other highly valued tech companies before going public, Palantir has never made a profit. For 2019, it reported a net loss of $579.6 million, about the same as in 2018. The first half of 2020 showed improvement, with a $164 million loss compared with a $274 million deficit in the same period in 2019.
Some potential investors say that even if they find the company’s voting structure egregious, they think Palantir will keep growing and the stock will go up over time.
The structure of a direct listing typically allows existing shareholders and employees to sell most or all of their shares immediately rather than wait for the mandated lockup of 180 days in most traditional IPOs. Palantir is taking steps to limit the supply of stock on the market by only allowing existing holders to sell 20% of their shares until early next year. That scarcity could serve to bolster the stock price.
Even after a run up, Palantir’s stock could start trading around where it raised funding five years ago. Since it was founded in 2003, Palantir has raised more than $3 billion and become one of the highest-valued startups when a 2015 funding round put its valuation at $20 billion.
Bloomberg notes that “research firm PitchBook this month valued Palantir at just $8.8 billion.”
Note also that Palantir has been around 17 years and has never made a profits. From the S-1:
We have incurred losses each year since our inception, we expect our operating expenses to increase, and we may not become profitable in the future.
We have incurred losses each year since our inception (…) and we may never achieve or maintain profitability. In addition, our operating expenses have increased over time. As we continue to expand our business, industry verticals, and the breadth of our operations, upgrade our infrastructure, hire additional employees, expand into new markets, invest in research and development, invest in sales and marketing, including expanding our sales organization, lease more real estate to accommodate our anticipated future growth, and incur costs associated with general administration, including expenses related to being a public company, we expect that our costs of revenue and operating expenses will continue to increase.
To the extent we are successful in increasing our customer base, we may also incur increased losses because the costs associated with acquiring and growing our customers via our Acquire, Expand, and Scale business model and with research and development are generally incurred upfront, while our revenue from customer contracts is generally recognized over the contract term. Furthermore, our sales model often requires us to spend months and invest significant resources working with customers on pilot deployments at no or low cost to them, which may not result in any future revenue. We may not be able to increase our revenue at a rate sufficient to offset increases in our costs of revenue and operating expenses in the near term or at all, which would prevent us from achieving or maintaining profitability in the future. Any failure by us to achieve, and then sustain or increase, profitability on a consistent basis could adversely affect our business, financial condition, and results of operations.
U.S. stocks see third-biggest outflow ever.
And this won’t help:
TIGHTENING MARGIN!
Wednesday, I received this email from Interactive Brokers:
Dear Client,
As you’ve likely observed, elevated option implied volatilities indicate that the markets will be confronting elevated volatility both before and after the November 2020 election. IBKR shares that sentiment and believe it’s appropriate to start controlling leverage in a measured fashion in advance.Consequently, to protect IBKR and its customers, IBKR will increase margin requirements by as much as 35% above normal margin requirements leading up to the November U.S. election. To illustrate, consider a Reg. T margin account with stock XYZ having an Initial Margin requirement of 50% and a Maintenance Margin requirement of 25%. With the increase fully implemented, the new requirements would be 67.5% Initial and 33.75% Maintenance.
This will be implemented gradually each day, increasing Initial margin requirements from normal levels starting September 28th to a rate that will be 35% higher by October 23rd. Maintenance margin requirements will increase in a similar manner between October 5th and October 30th. The new requirements will be implemented each day, after the market closes in New York, and will be effective the next trading day.
IBKR may make additional changes to the margin on certain products, or all products, depending on volatility. This includes changes built into the standard margin model as well as any new house margin requirements that may be imposed.

A Bet on Europe Is a Bet on Drugs, Against Tech Five of Europe’s top 10 companies by market value are now in health care, while none are banks or major oil companies
Healthcare accounts for a quarter of the Stoxx Europe 50 index—almost as much as the almost 28% represented by information technology in the S&P 500. Five of Europe’s top 10 companies by market value are now drug producers: Novartis, Roche, AstraZeneca, Sanofi and Denmark’s Novo Nordisk. This trend isn’t new, but it has been turbocharged by this year’s pandemic-driven downturn, which has highlighted the social relevance of the drug industry as well as its typically recession-proof profit profile. (…)
There are mixed lessons here for those hoping for happier days from European stocks, which have underperformed U.S. ones almost continuously since the 2009 financial crisis. Healthcare should continue to benefit from demographics, but the region is still more exposed to problem industries such as oil and gas than the U.S.
The elephant in the room—or not in Europe’s case—remains the technology sector. Contrarian investors who want to bet that 2020 marks the final gasps of a tech bubble like the year 2000 would do well to buy a European tracker fund. Most will prefer to be more selective.
STOXX 600 EARNINGS BY REFINITIV
- Second quarter earnings are expected to decrease 51.3% from Q2 2019. Excluding the Energy sector, earnings are expected to decrease 40.3%.
- Second quarter revenue is expected to decrease 20.1% from Q2 2019. Excluding the Energy sector, revenues are expected to decrease 12.6%.



 What have these 15-21 year-olds just learned we haven’t learned yet?


 JPMorgan will pay a record $1 billion to settle charges of metals and Treasury manipulation after prosecutors charged that its desk acted as an illicit enterprise within the bank for almost a decade. (