- The World Health Organization has warned that the pandemic is far from over. Director-General Tedros Adhanom Ghebreyesus said Wednesday that in the previous 24 hours, 106,000 new coronavirus cases had been reported to the United Nations health organization from around the world, the highest single-day total since the outbreak began.
- Brazil emerges as a top global coronavirus hotspot Experts predict death toll will top 100,000 in the coming months
- Spanish minister suggests foreign visitors could return this summer
- AstraZeneca books orders for 400m doses of Oxford vaccine Drugmaker also secures $1bn in funding from US government to aid development
PANDENOMICS
Fed’s Bullard Doesn’t See Coronavirus Second Wave as Major Threat
(…) When it comes to managing risks around the pandemic, “so much has been said about this already, that I think as soon as something would pop up we’d be all over that as a society, pounce on it at that point and keep it under control,” Mr. Bullard said Wednesday. “So I’m relatively optimistic about the second-wave scenario because I think we are not naive about that.” (…)
What’s happened is “a big shock and, yes, the economy numbers are going to look very bad by historical standards,” Mr. Bullard said. “But on the other hand I think we are more or less on track for where we would have expected to be at this point,” given the aggressive policy response and “we have every chance of a good recovery in the second half,” he said.
The official added, “I don’t see any reason why 2021 couldn’t be a great year.” (…) (WSJ)
Yet, the Fed’s own economists are able to think of a few potential caveats:
Fed staff economists laid out a baseline scenario in which restrictions on social interactions would gradually ease, boosting economic growth and reducing unemployment. But in a sign of the extreme uncertainty facing forecasters, they said their more pessimistic projection “was no less plausible than the baseline forecast.”
Officials worried that temporary layoffs could become permanent if there were additional infection waves this year and that a “large number of small businesses” wouldn’t be able to endure a long-lasting shock.
Even after social-distancing restrictions end, some business models “may no longer be economically viable,” officials said, and spending in sectors such as entertainment and travel that demand greater human interaction could remain weak. (…)
Officials said high levels of business debt could exacerbate any stress on the banks in the current downturn, and some believed regulators “should encourage banks to prepare for possible downside scenarios” by limiting capital distributions to shareholders, the minutes said. “Indeed, historical loss models might understate losses in this context,” they said.
The minutes didn’t show any discussion around policies to cut interest rates below zero, an idea that has been the source of speculation by some investors even though Fed officials have more recently said they have no interest in it. (WSJ)
- Fed’s Rosengren Warns Premature Reopening of Economy Carries Risk
- Strong demand for US 20-year bond to fund record spending Treasury offloads $20bn at yield of 1.22% after public bids worth $50bn
- UK sells negative-yielding government bonds for first time ‘Symbolic moment’ coincides with debate on whether BoE should move to negative rates
Bank of Canada says downward pressure on inflation likely once shutdown ends
(…) Deputy governor Timothy Lane said Canada would likely emerge with both demand and supply weaker than before. The scarring associated with the shutdown could lower productivity, which tends to result in higher inflation.
“But the Bank’s analysis suggests that the decline in demand stemming in part from weaker business and consumer confidence is likely to have a larger effect. On balance, there is likely to be downward pressure on inflation,” he said in a speech to a Winnipeg business audience via video.
Lane reiterated that the bank expected second quarter growth to plunge anywhere between 15 and 30 percent from its level in late 2019.
The various shocks caused by the crisis “are likely to result in damage to Canada’s productive capacity that may be profound and long-lasting,” he said. (…)
Canada’s central bank said in April it expected inflation to dive near 0 per cent in the second quarter.
Statistics Canada said Wednesday the consumer price index for April fell 0.2 per cent compared with a year ago as gasoline prices plunged by 39.3 per cent, the largest year-over-year decline on record.
The overall drop in the annual rate was the first year-over-year decline since September 2009.
The reading compared with a year-over-year increase of 0.9 per cent in March, when the pandemic first started to affect the broader economy. (…)
Excluding energy, Statistics Canada said CPI rose 1.6 per cent. (…) the average of the three core measures of inflation tracked by the Bank of Canada was 1.8 per cent. (…)
(…) In April, the EMU inflation posted a -0.2% change month-to-month against a core rate that was flat. Sequentially from one-year to six-months to three-months, headline inflation has been falling starting with a 12-month pace of 0.3% and ending the sequence with a three-month annualized pace of -1.7%. The core on the same timeline also shows persistent deceleration, falling from a 12-month annualized pace of 1% to just 0.2% over a three-month pace. (…)
- Major layoffs at big companies including Uber and Airbnb, as well a host of smaller startups, have shaken any sense that the tech industry is insulated from the broader employment destruction.
- Millions of people are behind on their credit-card and auto-loan payments, the latest sign of the coronavirus pandemic’s financial devastation.
- Some vulnerable Senate Republicans expressed frustration over the party’s go-slow approach on the next round of coronavirus relief, urging quicker action to counter the pandemic as re-election concerns start to play a more prominent role on Capitol Hill.
- Nearly half of adults live in households that have lost income in the two months since the coronavirus pandemic led to a nationwide economic shutdown and more than a third expect to lose income over the next four weeks, the Census Bureau said.
- Biggest US mall shows threat to mortgage-backed bonds Vast Mall of America falls behind on payments that help underpin $500bn bond market
WTO goods barometer flashes red as COVID-19 disrupts world trade
The volume of world merchandise trade is likely to fall precipitously in the first half of 2020 as the COVID-19 pandemic disrupts the global economy, according to the WTO Goods Trade Barometer released on 20 May. The index currently stands at 87.6, far below the baseline value of 100, suggesting a sharp contraction in world trade extending into the second quarter. This is the lowest value on record since the indicator was launched in July 2016. (…)
This measure is consistent with the WTO’s trade forecast issued on 8 April 2020, which estimated that world merchandise trade could decline by between 13% and 32% in 2020, depending on the duration of the pandemic and the effectiveness of policy responses.

An early trade report from South Korea, a bellwether for global commerce, showed exports may be set to drop more than 20% in May for a second month. Meanwhile, Japan’s overseas shipments also plunged by more than a fifth in April and a purchasing managers index showed manufacturing activity weakening further in May.

FLASH PMIs
Eurozone economic downturn shows signs of easing as lockdowns lift
The flash IHS Markit Eurozone Composite PMI rose from an all-time low of 13.6 in April to 30.5 in May, its highest since February. By remaining well below the 50.0 no-change level, the PMI registered a third successive monthly fall in output and continued to indicate a rate of contraction in excess of anything seen prior to the COVID-19 outbreak. The prior low of 36.2 was seen during the peak of the global financial crisis in February 2009. (…)
The service sector business activity index picked up from 12.0 in April to 28.7, its highest since February, but social distancing and other virus-related lockdown measures continued to hit businesses such as hotels, restaurants, travel and tourism and other consumer-facing firms especially hard, resulting in the third-steepest decline ever recorded.
The factory sector’s output index meanwhile rose from 18.1 in April to 35.4 in May, albeit likewise still indicating a rapid rate of decline.
Jobs consequently continued to be cut at a rate unprecedented prior to the COVID-19 lockdowns, the rate of staff cuts easing only modestly compared to April’s record. Similar rates of job shedding were seen in services and manufacturing, as firms in both sectors sought to cut capacity in line with weaker demand. (…)
Forward-looking indicators improved, though merely from low bases. Overall inflows of new business fell to the third-greatest extent ever seen by the surveys as demand slumped further across both manufacturing and services, yet showed the smallest decline for three months to add to signs that the downturn has bottomed out.
Expectations of output in the coming 12 months meanwhile rose for a second successive month from March’s all-time low, albeit with the number of pessimists continuing to exceed optimists and the overall level of sentiment remaining below anything recorded before the pandemic.
Average prices charged for goods and services fell sharply for a third successive month as companies offered discounts to help stimulate sales, registering one of the largest monthly falls on record. While the rate of price cutting eased slightly in the service sector, prices charged for goods continued to fall at the fastest rate since October 2009.
Price cuts were again often facilitated by lower costs. Having fallen in April to an extent not seen since July 2009, input costs dropped markedly again in May, the rate of decline moderating only slightly in services but reaching the fastest for over four years in manufacturing. (…)


Severe economic downturn continues in Japan
Latest PMI data provide yet another shocking insight into the devastating impact of the COVID-19 outbreak. While the rate of decline in services activity has eased very slightly, plummeting demand for goods is finally catching up with the manufacturing sector, which posted an accelerated decline in production during May.
Taking the April and May PMI surveys together, we see that both are indicative of GDP falling at an annual rate in excess of 10%. It is clear that the economy is going to contract for a third successive quarter, with the hit to Q2 likely to be potentially as large as 20% on the previous year.
Nevertheless, the dynamics in the economy are clearly evolving. As Japan eases the state of emergency measures, the services economy can begin its gradual recovery. However, the damage to the manufacturing sector could continue to worsen as global trade conditions deteriorate and the global economic recovery is slow.


Markit does not have a flash PMI for China but World Economics has its own SMI survey:
CHINA SALES MANAGERS REPORT CONTINUING RECOVERY IN MAY
Sales managers report that most companies are now operational and back to near capacity potential. The problem is now demand and not capacity constraints. Export markets remain depressed as clients in many western countries are still in lockdown. However overall the Chinese economy is showing remarkable resilience, with most schools, factories, restaurants and stores now open.
CHINA: SALES GROWTH INDEX
Markit’s U.S. flash PMI will be released mid-morning. Here’s the U.S. SMI:
MAY SALES DATA SHOW FURTHER PLUNGE IN U.S. ECONOMIC ACTIVITY
All U.S. Sales Managers Indexes hit all-time survey lows in May reflecting the deep impact of the Coronavirus lockdowns. Points of special note from the U.S. survey data include very low levels of Business Confidence and Sales. The Staffing Index came in at an extremely low level reflecting the millions of continuing job losses.
UNITED STATES & CHINA: SALES GROWTH INDEX

China debt: how big is it, who owns it and what is next? The Institute of International Finance (IFF) estimated that China’s total debt hit 317 per cent of gross domestic product (GDP) in the first quarter of 2020
(…) The Institute of International Finance (IFF) estimated that China’s total domestic debt hit 317 per cent of gross domestic product (GDP) in the first quarter of 2020, up from 300 per cent in the last quarter of 2019 – the largest quarterly increase on record.
China’s National Institution for Finance and Development, a government-linked think tank, put the nation’s overall debt at 245.4 per cent of GDP at the end of 2019, up 6.1 percentage points from the previous year. (…)
China’s domestic debt has been growing at an average annual rate of around 20 per cent since 2008, faster than its gross domestic product (GDP) growth. (…)
But as China’s growth has slowed, there are growing concerns that many of these debts are at risk of default, which could trigger a systemic crisis in China’s state-dominated financial system. (…)
The coronavirus pandemic is likely to slow regional economies even further, driving down local governments’ revenue and impairing their ability to pay off and refinance debt, with the likelihood that some regional economies will have to increase their debt burden. There were already signs of a ripple effect among China’s small banks as the central government had to step in during 2019 to bail out or partially rescue a number of institutions – such as Baoshang Bank and the Bank of Jinzhou – for the first time since the 1990s.
China has asked its banks to extend borrowing to small businesses which may add more bad debts to the financial system going forward because companies may struggle to generate enough revenue due to a poor demand and weak growth prospects. (…)
Bidding Wars Are Back in Housing Market Stung by Pandemic
While sales are way down, the lack of inventory has propped up prices and led to bidding wars, even as economic fallout from the pandemic mounts and real estate agents adjust to new public health guidelines that have made it more difficult to market homes. (…)
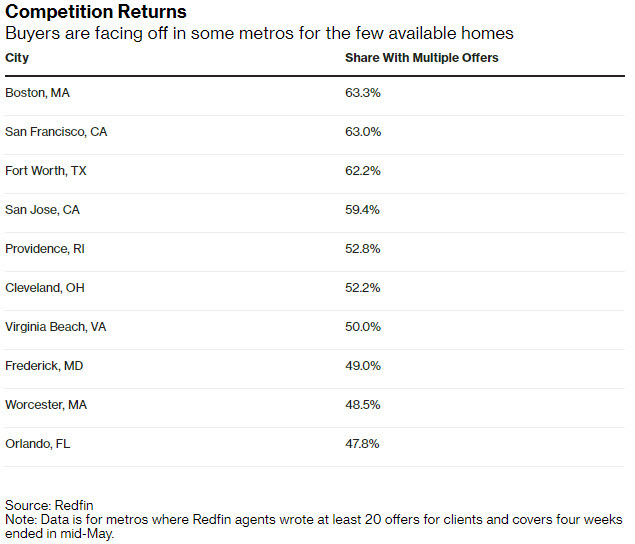
The supply-demand imbalance meant that roughly 40% of homebuyers that Redfin agents worked with recently faced competition when they tried to purchase a home. The rate was even higher in cities like San Francisco, Boston and even Fort Worth, Texas, where more than 60% of properties the company’s clients bid on received multiple offers.
PANDEMONIUM
Trump Points Finger at China’s Xi, Escalating Fight Over Virus Trump suggested Xi is behind a “disinformation and propaganda attack on the United States and Europe.”
-
What Xi knew: pressure builds on China’s leader | Free to read President faces scrutiny over early management of the pandemic as Beijing contemplates resetting economic targets
Destined for conflict? Xi Jinping, Donald Trump and the Thucydides trap Tense relations with the US and the question of whether armed confrontation can be avoided will loom large when China’s political elites meet
(…) While observers generally agree that an all-out war between the nuclear-armed nations is improbable, there are potential risks for a limited military conflict. (…)
Speaking at the World Economic Forum in Davos in January 2017, Xi said the Thucydides trap “can be avoided … as long as we maintain communication and treat each other with sincerity”.
But since then, the devastating Covid-19 pandemic has driven the deeply fraught US-China relations to the brink of an all-out confrontation as a result of strategic distrust and misperception, said Wang Jisi, president of Peking University’s Institute of International and Strategic Studies.
“China and the US are shifting from an all-around competition to a full-scale confrontation, with little room for compromise and manoeuvring,” Wang said in a speech in late March. “We cannot rule out the possibility that the two powers may fall into the Thucydides trap.”
That seems to sum up the tone of recent communications from the US side. Trump has vowed to “take whatever actions that are necessary” to seek reparations and hold China accountable for the Covid-19 disease that was first identified in the city of Wuhan at the end of last year. His top aides, especially Secretary of State Mike Pompeo and Defence Secretary Mark Esper, have been particularly blunt.
During the Munich Security Conference in February , Esper described China as a rising threat to the world order and urged countries to side with the US in preparing for “high intensity conflict against China”. (…)
The deterioration of US-China ties has clearly alarmed Xi and his top aides. On April 8, the Chinese leader issued an unusually stark warning that “we must get ready for the worst-case scenarios” in light of unprecedented external adversity and challenges, according to Xinhua. (…)
The China Institutes of Contemporary International Relations (CICIR), affiliated with the Ministry of State Security, said Beijing may need to prepare for armed confrontation with Washington amid the worst anti-China backlash since the Tiananmen crackdown in 1989, according to Reuters, which cited an internal report.
The report warned that China’s overseas investments, especially the ambitious Belt and Road Initiative, could fall victim to rising anti-Chinese sentiments, while the US may accelerate efforts to counter Beijing’s expanding clout by increasing financial and military support for regional allies. (…)
Seth Jaffe, assistant professor of political science and international affairs at John Cabot University in Rome and an expert on Greek history, said the Chinese think tank report was “profoundly concerning”.
“The acrimonious narratives surrounding Covid-19 are currently reshaping the attitudes of leaders and populations alike, which is leading to harder-line strategic postures, as evidenced by the hawkish CICIR report,” he said. “In this way, the virus blame game is stirring up nationalistic pride and grievance, narrowing the space for political leaders to manoeuvre, and creating zero-sum dynamics that invite future conflict – a vicious cycle.” (…)
He said an international incident would put Trump and Xi on a reputational collision course, with each leader facing pressure to stand up to the other and not back down, given the mistrust and heated rhetoric.
“The danger, then, is an unforeseen spark, which could set off a frightening movement up the escalation ladder,” he added. (…)
Anybody having read about events prior to WWI knows what this last sentence means.
Pompeo slams ‘brutal’ Beijing over pandemic, 5G and Taiwan
America’s top diplomat launched a verbal salvo against China on Wednesday that was anything but diplomatic, attacking Beijing for its policies on health, defence, Taiwan and 5G and its “brutal” regime as he expressed US concern over certifying Hong Kong’s autonomy. (…)
Under the Hong Kong Human Rights and Democracy Act of 2019, the US has until the end of this month to assess whether Hong Kong remains suitably autonomous from China, a prerequisite for extending the city’s preferential US trading and investment privileges. (…)
Earlier on Wednesday, Trump lashed out on Twitter at “some wacko in China” for “blaming everybody other than China for the Virus which has now killed hundreds of thousands of people”, he wrote. “Please explain to this dope that it was the ‘incompetence of China’, and nothing else, that did this mass Worldwide killing!” (…)
China’s military seeks bigger budget amid growing threat of US conflict
Senate Bill Could Force Chinese Companies to Drop U.S. Listings Chinese companies could be forced to give up their listings on American stock exchanges under legislation approved unanimously by the Senate, aimed at addressing longstanding investor-protection concerns.
(…) At the heart of the dispute is China’s unwillingness to grant routine access to audit records sought by American regulators. Companies that sell shares publicly in the U.S. are legally required to be audited by firms that are inspected by the Public Company Accounting Oversight Board, an audit watchdog. (…)
Chinese companies have raised over $66 billion through U.S. initial public offerings since 1997, according to data from S&P Global Market Intelligence. There were 25 IPOs of Chinese companies in 2019, about 18% of all deals, according to data compiled by University of Florida professor Jay Ritter.
The legislation approved by the Senate would require the SEC to prohibit trading in any shares where the company’s auditor hasn’t faced a PCAOB inspection for three consecutive years. It also would require the companies to disclose whether they are owned or controlled by a governmental entity. (…)
TECHNICALS WATCH
13/34–Week EMA Trend Chart (CMG Wealth):


