Saudis Plan Big Oil Output Hike, Beginning All-Out Price War
Saudi Arabia plans to boost oil output next month to well above 10 million barrels a day, as the kingdom responds aggressively to the collapse of its OPEC+ alliance with Russia.
The world’s largest oil exporter engaged in an all-out price war on Saturday by slashing pricing for its crude by the most in more than 30 years. State energy giant Saudi Aramco is offering unprecedented discounts in Asia, Europe and the U.S. to entice refiners to use Saudi crude.
At the same time, Saudi Arabia has privately told some market participants it could raise production much higher if needed, even going to a record 12 million barrels a day, according to people familiar with the conversations, who asked not to be named to protect commercial relations. With demand ravaged by the coronavirus outbreak, opening the taps would throw the oil market into chaos.
(…) in a notice to buyers sent Saturday, Aramco announced it was slashing most official prices by $6-$8 a barrel across all regions. The dramatic move will resonate beyond Saudi Arabia. The kingdom’s pricing decision affects about 14 million barrels a day of oil exports, as other producers in the Persian Gulf region follow its lead in setting prices for their own shipments.
In one of the most significant pricing moves, Aramco widened the discount for its flagship Arab Light crude to refiners in northwest Europe by a hefty $8 a barrel, offering it at $10.25 a barrel less than the Brent benchmark. In contrast, Urals, the Russian flagship crude blend, trades at a discount of about $2 a barrel less than Brent. Traders said the Saudi move was a direct attack at the ability of Russian companies to sell crude in Europe. (…)

A supply-driven drop in oil prices would normally be a positive for global growth, cutting costs for businesses and putting more money in consumers’ pockets. This time, that might not be the case, according to Bloomberg Economics: Producers will still lose — though evidently Saudi Arabia sees long-term benefits from squeezing higher-cost competitors. Consumers will gain, but with the risk of a coronavirus-induced shutdown looming, they might not have the motive or opportunity to divert their energy savings to other spending.
-
Goldman Sachs: The latest shoe to drop is the sharp decline in oil prices. Our Commodities Research team expects the combination of virus-induced economic weakness and the price war between OPEC and Russia to push Brent prices down to $30/barrel, near the early-2016 lows and down more than 50% from the average level of the past year. Economists often emphasize the positive effects of lower oil prices for the consumer via higher real income, which are real. But in some economies—most importantly the US—they are largely or entirely offset by the negative effects on the oil-producing sector and the associated hit to oil-exposed credit and equity names. Besides, the hit to headline inflation—a small part of which will pass through to core—also increases the urgency for central banks to ease policy further.
-
Putin Dumps MBS to Start a War on America’s Shale Oil Industry
(…) It’s a disaster for U.S. frackers including Chesapeake Energy Corp. and Whiting Petroleum Corp., who were already trading at distressed levels — and makes more defaults and bankruptcies all but certain. (…) Banks were already poised to cut credit lines after writing off as much as $1 billion in shale loans last year, more than they have in 30 years of making them. (…)
But never before has so much U.S. output been in such peril — and never has demand for that supply been so uncertain. (…)
American shale companies are largely responsible for years of swelling world supply. Indirectly, they’ve been supported by OPEC nations and their allies cutting production to prop up prices. But the key Saudi-Russia “bromance,” as it was once described by Citigroup Inc. oil analyst Ed Morse, is over. No longer is Russia willing to bail out U.S. shale. (…)
A rationalization of the hundreds of independent U.S. producers currently active appears inevitable, according to Ian Nieboer, managing director of RS Energy, now part of Enverus.
“What we’re going to end up with is a major hollowing out of the industry,” he said.
-
Oil price war spells danger for US junk bonds Saudi Arabia’s expected production rise set to squeeze heavily indebted US shale producers
Goldman Sachs:
- in 2014 the average OPEC budget breakeven was $20-40/bl below the FCF breakeven (post-capex and dividends) of Big Oils and US E&Ps. Today, that cost positioning has reversed, with OPEC breakevens $20-30/bl higher than for Big Oils and the US E&Ps, making a price war more painful for OPEC than for most listed companies;

- Big Oils’ balance sheets can withstand two years of oil prices <$40/bl before going to the top of its historical gearing range, suggesting strong resilience and ability to consolidate the industry in a time of turbulence
- US shale oil could decline almost 3 mn blsd within a year, if all investment stopped
CHINA’S REBOOT
In Friday’s Daily Edge, I posted on a piece from the South China Morning Post suggesting that China may have ‘no new virus cases’ outside Hubei epicentre by mid-March, supported by another article informing us that The WHO sent 25 international experts to China to conclude that
“This decline in COVID-19 cases across China is real,” the report says. The authors conclude this from their own experience on site, declining hospital visits in the affected regions, the increasing number of unoccupied hospital beds, and the problems of Chinese scientists to recruit enough newly infected for the clinical studies of the numerous drug trials.
The March 7 editorial of the very serious The Lancet confirmed these findings:
By striking contrast, the WHO-China joint mission report calls China’s vigorous public health measures toward this new coronavirus probably the most “ambitious, agile and aggressive disease containment effort in history”. China seems to have avoided a substantial number of cases and fatalities, although there have been severe effects on the nation’s economy. (…) China’s success rests largely with a strong administrative system that it can mobilise in times of threat, combined with the ready agreement of the Chinese people to obey stringent public health procedures. Although other nations lack China’s command-and-control political economy, there are important lessons that presidents and prime ministers can learn from China’s experience. The signs are that those lessons have not been learned. (…)
So far, evidence suggests that the colossal public health efforts of the Chinese Government have saved thousands of lives. (…)
Yesterday in the NYT:
To the surprise of some, the country that concealed and mismanaged the initial outbreak appears to be bringing it under control, at least by its own official figures. The number of new cases reported has fallen dramatically in recent days even as infections are surging in other countries. The World Health Organization has praised Beijing’s response.
Officials reported only 99 new cases on Saturday, down from around 2,000 a day just weeks ago, and for the second day in a row, none were detected in Hubei Province outside of its capital, Wuhan, the center of the outbreak. (…)
But there is also concern that China’s numbers may be flawed and incomplete. The real test will be whether the virus flares again when children return to classrooms and workers to factories, and commuters start taking buses and subways. (…)
Some experts are increasingly wondering if China’s lockdown will become pointless the more widespread the virus becomes. Given the global spread of the virus and the difficulty of spotting mild cases, they say, it is unlikely that it will ever be completely eliminated — even in China.
“I do think the declining case numbers likely mean that all these incredible measures that have been taken are probably having an effect,” said Marc Lipsitch, an epidemiologist at the Harvard T.H. Chan School of Public Health. “But I don’t think zero is zero.”
Nomura estimated in a research report on Monday about 61.6% of the firms hardest hit by the health crisis in China have resumed work as of March 8, and 74.1% in the broader economy.
China reported on Monday no locally-transmitted cases of infection on the mainland outside of the central province of Hubei, the epicenter of the outbreak, for the second straight day.
But the authorities continue to be mindful of risks stemming from foreign visitors and Chinese nationals traveling back to China from affected regions. (…)
Calls at Chinese ports rose rapidly since the second week after the prolonged Lunar New Year holiday and have surpassed 2019 levels by end-February, according to data tracked by Clarksons Research, a maritime brokerage and consultancy. China represents 22% of seaborne imports and 33% of shipbuilding capacity in the world. (…)
With the easing of cross-region and intra-city travel curbs, the transportation ministry told a news conference on Saturday that all migrant workers were expected to return to their workplaces by early April. (…)
Average daily passenger volumes at metros across the country reached 15 million last week, up 46.5% from the prior week, but the figure is merely a forth of the level before the coronavirus outbreak, data compiled by the China Association of Metros showed.
Daily passenger flows in Beijing, the capital city in China, are only at 15% of the pre-holiday level.
As of Monday, only nine of mainland China’s 31 regions have not lowered emergency response levels on the epidemic, including Beijing.
The “China Economic Recovery Index” (CERI) compiled by WeBank, a digital bank initiated by China’s tech giant Tencent, based on aggregated mobility data, suggests that around 68% of business activities, including manufacturing and consumption, have resumed. (…)
Ping An Bank estimated that the average utilization rate at its 600 small- and micro-businesses clients across the country was 47.3% as of Monday, up from 8% in the prior week, reaching to a normal operation level. (…)
But outside China, it’s getting worse:
Confirmed Coronavirus Cases Outside China Tripled in Past Week The total number of cases of the virus that causes Covid-19 surpassed 110,000, with infections in 108 countries and regions.
The total number of confirmed coronavirus cases was more than 110,000 Monday, with infections in 108 countries and regions, according to data compiled by Johns Hopkins University. There were 29,306 cases outside mainland China, versus around 10,000 a week ago. The U.S. tally rose to 554 cases, with 21 deaths.
(…) the total number of confirmed infections in Italy climbed to 7,375 over the weekend, almost catching up with South Korea’s 7,478 cases. (…)
In China, health authorities reported 40 new cases on the mainland in the past day, bringing its total number of confirmed infections to 80,735, up about 1% from a week ago. (…)
In recent days, major cities including Shanghai and Beijing have seen people returning to malls, shops reopening and other business activities gradually resuming. On Monday, Shanghai government officials said some major tourist spots and sports facilities had reopened after being closed for more than a month.
Walt Disney Co.’s Shanghai Disney Resort said it would partially resume operations as a first step in reopening in phases, while the main Shanghai Disneyland theme park would remain closed until further notice. (…)
On Monday, South Korean Vice Health Minister Kim Ganglip said the spread of the coronavirus appears to be slowing in the country but that new infections could come from people returning from abroad.
The country added 165 cases, the lowest daily new numbers since Feb. 25, according to the Korea Centers for Disease Control and Prevention. (…) Japan reported 488 cases on Monday, up 33 from a day earlier.
In the NYT:
(…) The “draconian” quarantine measures taken by China, while they’ve worked to prevent a broader advance of the disease beyond Wuhan province, are “something we never would be able to do” in the U.S., he added. Italy also imposed more stringent travel restrictions early Sunday.
“I don’t imagine that the degree of the draconian nature of what the Chinese did would ever be either feasible, applicable, doable or whatever you want to call it in the United States,” Fauci said in an interview with CBS’s “60 Minutes” (…)
Gottlieb, who departed as Trump’s FDA commissioner in April, said Sunday on CBS’s “Face the Nation” that the U.S. is “past the point of containment and broad mitigation strategies.”
“The next few weeks will change the complexion in this country,”said Gottlieb, who’s now a special partner at New Enterprise Associates, a venture capital firm that invests in the health-care and biotech sectors. “We’ll get through this, but it’s going to be a hard period. We’re looking at two months, probably, of difficulty.” (…)
BTW:
Coronavirus case at CPAC threatens to upend Trump’s routine
A growing sense of concern and uncertainty about the reach of the novel coronavirus has begun to take hold in the White House, after an attendee at a recent political conference where President Trump spoke tested positive for covid-19, the disease caused by the virus.
Trump was photographed shaking hands with Matt Schlapp, the chairman of the American Conservative Union, who confirmed that he had been in direct contact with the infected man during the Conservative Political Action Conference last month.
The handshake at CPAC put Trump just two degrees of separation away from the virus that he has sought to minimize as it has rocked financial markets and tested his leadership skills. (…)
“What we’ve ascertained from having literally thousands of interactions with attendees and people associated with the conference and government officials is there is no indication of any sick people or new cases,” [Schlapp] said. “To date, this seems extremely isolated with one sick person.”
Schlapp confirmed that he had personally interacted with the infected man, whose name has not been released, early in the four-day conference. He greeted Trump, Vice President Pence and several other senior administration officials after what he described as a brief interaction with the infected attendee. (…)
Sen. Ted Cruz (R-Tex.) said in a statement Sunday that he “briefly interacted” with the infected person while at CPAC and would self-quarantine at his Texas home “out of an abundance of caution.” He said he does not have any symptoms associated with the virus.
Rep. Paul A. Gosar (R-Ariz.) tweeted Sunday that he and three of his staff members are under self-quarantine “after sustained contact at CPAC” with the person who has the virus. He added: “We are all asymptomatic and feel great.”
Reminder:
- The coronavirus very easily transmits among humans.
- Infected people may not have any symptoms for up to 14 days, sometimes longer, but are contagious nonetheless.
- The well attended CPAC conference was held February 26 to 29 and included children and spouses with lots of hand shaking and close conversations.
- There are no signs yet that politicians have stopped crowd gathering and hand shaking.
(…) “I’m not concerned at all,” Trump said Saturday when asked about the potential threat posed to the White House by the coronavirus.
He also pledged to keep holding “tremendous” political rallies, even as top public health officials within his government have called for millions of Americans to avoid large crowds and major events to reduce the risk of being infected.
White House officials have said they expect the outbreak to spread significantly throughout the country in the coming days, dominating headlines and limiting the president’s ability to maintain his typical routine. (…)
Coronavirus Spread Could Halt Robust U.S. Job Gains Economists largely dismissed February’s hiring growth as a less important economic indicator than usual
(…) Economists largely dismissed February’s robust monthly job gain of 273,000 as a less important economic indicator than usual. Most companies reported February employee head-counts before concerns escalated that the epidemic would hit U.S. economic growth.
The U.S. economy gained an average of 243,000 jobs a month from December through February, up from average monthly job growth of 178,000 in 2019. (…)
Services industries that help drive the U.S. economy—including air transportation, restaurants, entertainment and retail—would suffer the most from the spread of the virus, according to economic research firm Capital Economics.
Some of those sectors saw particularly strong job gains in February before cases of the infection began rising in the U.S., according to Friday’s jobs report from the Labor Department. Leisure-and-hospitality companies added 51,000 jobs in February, and restaurants added 53,000 to payrolls. (…)
Wages were up 3.0% in February from a year earlier, remaining within the narrow range of the past year and a half, but still a solid pace considering inflation is low. (…)
Let’s not completely dismiss this pre-covid-19 employment report. First, payrolls rose a strong 273k in February and were revised up 85k in the previous 2 months for a 3-month average monthly pace of +243k vs +211k as previously reported, and +170k for all of 2019. While warm weather certainly helped in Jan.-Feb., the reality is that the labor market was strengthening in Q4’19 and into 2020.
As a result, the payrolls index, a measure of spending power from labor, abruptly interrupted its 2019 slowdown last month, rising 4.7% YoY after +4.0% in both December and January, helping sustain spending power early in 2020.

Stronger employment growth more than offset slower wage growth, a plus for the overall economy and a plus for corporate margins right when demand is getting impacted by the Covid-19 outbreak.
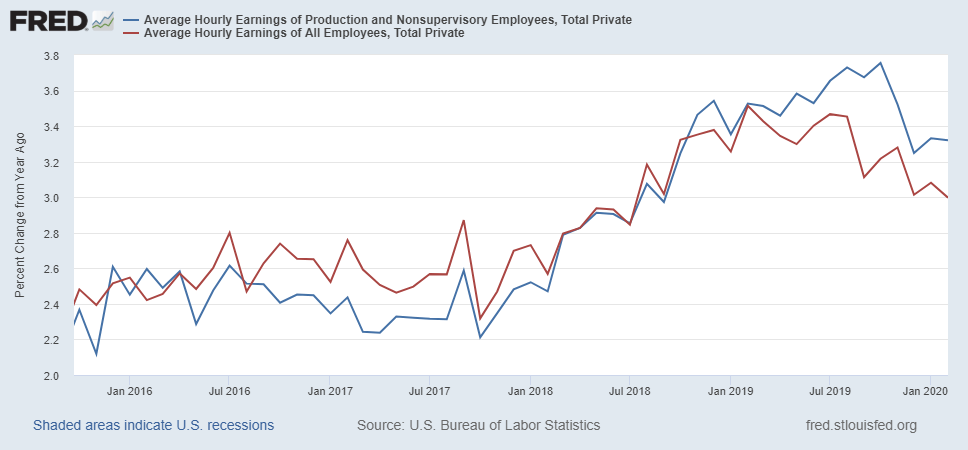
We know the labor market will get weaker in the next several months but the stronger base will help.
Not adjusting for seasonal swings, the Labor Department recorded 16.3 million people working last month in the leisure and hospitality sector—a category that includes hotel workers, waiters and the like. In a typical year, that job count would increase by 10% by July as seasonal workers such as beach-town restaurant workers, stadium hot-dog vendors and camp counselors get hired. It seems quite unlikely that anywhere close to 1.6 million leisure and hospitality workers will be added by this summer.
Then there are airline workers to think of—United Airlines earlier this week said that it would freeze hiring through June. Or workers in major U.S. ports, which have seen a sharp drop in incoming traffic. (WSJ)
The Art of the Unreasonable Trade Deal Chinese private-sector firms, out trillions of yuan thanks to the coronavirus, are in no position to massively ramp up imports
(…) Achieving the ambitious purchase commitments in the deal always seemed like a stretch, but the huge hit to corporate cash flow from the coronavirus—up to four trillion yuan ($577 billion) by some estimates—may make it next to impossible.
The problem is that private-sector Chinese companies, rather than state firms, are the big buyers of U.S. manufactured goods. Private firms also are the most at risk from the coronavirus cash drought since they usually can’t borrow cheaply like their state-owned peers. Big new energy and agriculture purchase commitments in the trade deal—$31 billion in the first year—get the most attention. But the larger commitment for 2020 actually concerns manufactured goods: $33 billion worth. (…)
To make matters even worse, the trade deal didn’t actually remove most of the Chinese tariffs added to U.S. goods during the trade war. As of mid-February, the overall average tariff rate on U.S. manufactured goods was 16% in China, according to the Peterson Institute researchers—up from 6.9% in 2018 before the trade war, and compared with just 5.2% for the rest of the world.
That doesn’t amount to a huge flashing buy signal for private-sector Chinese companies that, unlike some of their state-owned peers, actually need to worry about profitability—especially now. (…)
The U.S. is willing to show China some flexibility on its pledges to boost American imports as long as Beijing ensures exports don’t surge when production returns to full strength and widen the trade imbalance between the world’s two largest economies, people familiar with the discussions said.
Given Beijing’s focus on containing the coronavirus outbreak and the country’s lagging demand for American imports, U.S. officials have told their Chinese counterparts that the purchasing boost, signed in January with specific target dates and commodities, could start off slowly, according to people in Washington and Beijing with knowledge of the discussions.
But that understanding comes with some conditions, according to these people. The Trump administration has made clear that this is only an option as long as there isn’t a jump in Chinese exports when virus-related industrial shutdowns end. (…)
Europe Braces for Economic Impact of Italy’s Lockdown Italy’s quarantine and the prospect of other European countries following Rome’s move will challenge politicians and policy makers like no postwar financial shock.
Plunge in Rates Scrambles Fed’s Stimulus Playbook Decline in long-term bond yields also helps explain why calls for stronger fiscal policy response could grow louder
(…) with long-term rates tumbling to new lows, the Fed “may not be able to use the tools that it used 10 years ago. This is an elephant in the room,” said Andrew Levin, a former Fed economist who now teaches at Dartmouth College.
[Boston Fed President, Eric] Rosengren, who spoke Friday at a conference on central banking, said greater fiscal stimulus is the “obvious alternative” to monetary policy in the current environment. “It’s actually surprising we’re not having more conferences now on fiscal policy,” he said. (…)
White House economic adviser Lawrence Kudlow said Friday the administration was considering “timely and targeted” measures aimed at helping workers and sectors affected by coronavirus. That includes measures such as deferring taxes for the industries hardest hit by the virus—primarily hospitality and travel, an administration official said. (…)
Mr. Rosengren said that, without a stronger fiscal response, the Fed would need to ask Congress for new tools to spur growth, such as allowing the central bank to purchase a broader range of securities or assets than the government-guaranteed bonds currently allowed under law. (…)
Fed officials have already ruled out negative rates, an innovation that has been deployed by central banks in Japan and Europe but never in the U.S. Many Fed officials have said they see significant, harmful side effects from such policies in the U.S.
Negative rates would “pose a significant challenge for banks,” said Mr. Rosengren. “We need banks to be healthy enough to provide credit and liquidity in challenging economic times.”
Trump’s Aides Drafting Economic Measures to Combat Virus Fallout
The Virus Aftermath Won’t Be Like a Hurricane Even if recession is avoided, recovery is likely to be U-shaped and uncomfortably long
(…) In the third quarter, [economists] look for growth to resume, but, says Deutsche’s global head of economic research Peter Hooper, “there is no question there will be an overall loss of consumption and investment activity that does not come back.”
Like most of his peers, Mr. Hooper believes the U.S. will skirt a recession. That is by no means a given, though. The risk of a downturn is very real. (…)
One key question: Will the lifting of quarantines and other restrictions lead to fresh outbreaks in China? That could make the resumption of Chinese manufacturing uneven.
Moreover, the spread of the virus to other countries making goods the U.S. depends upon, such as South Korea, is only making supply-chain problems worse. Shortages of key manufacturing components as well as finished goods could be a persistent problem for American businesses, sapping the strength of any recovery. (…)
Already, people are canceling travel plans and avoiding gatherings. How bad the economic damage gets will ultimately depend on how far such social-distancing measures extend and what types of measures state and local governments might adopt to stem coronavirus’s spread.
(…) Americans may only become increasingly cautious, placing spending at further risk. (…) signs that the epidemic are starting to be contained probably won’t lead to people, businesses and authorities to abruptly lower their guards. Rather, they will continue to engage in many of the cautious behaviors that helped arrest the virus’s spread. Scattered outbreaks may only reinforce that message.
So there will be no sudden booking of vacations and no immediate resumption of major business conventions.
No V, in other words. The coronavirus epidemic will weaken the economy, and that weakness is likely to last an uncomfortably long time.
Fed Stores Dollars Arriving From Asia as Coronavirus Precaution The Federal Reserve has begun holding dollars it receives from Asia before recirculating them amid concerns over the spreading coronavirus outbreak, a spokeswoman confirmed Friday.
The Fed’s 12 regional reserve banks will store currency shipments from Asia for at least seven to 10 days, the spokeswoman said. She emphasized the move is precautionary.
The Fed’s action follows moves by central banks in China and South Korea to quarantine bank notes in domestic circulation. The Fed spokeswoman, and a counterpart at the European Central Bank, said no such plans were contemplated for now. (…)
Cash is used for 80% of all physical retail transactions in Germany and 86% in Italy, according to a 2017 survey by the ECB. That compares with just 30% for the U.S. in the same year, according to a survey by the Federal Reserve Bank of San Francisco. (…)
EARNINGS WATCH
Earnings still matter, at least knowing where we are. From Refinitiv/IBES:
Through Mar. 6, 492 companies in the S&P 500 Index have reported earnings for Q4 2019. Of these companies, 69.9% reported earnings above analyst expectations and 20.9% reported earnings below analyst expectations. In a typical quarter (since 1994), 65% of companies beat estimates and 20% miss estimates. Over the past four quarters, 74% of companies beat the estimates and 19% missed estimates.
In aggregate, companies are reporting earnings that are 4.6% above estimates, which compares to a long-term (since 1994) average surprise factor of 3.3% and the average surprise factor over the prior four quarters of 4.9%.
Of these companies, 63.4% reported revenue above analyst expectations and 36.6% reported revenue below analyst expectations. In a typical quarter (since 2002), 60% of companies beat estimates and 40% miss estimates. Over the past four quarters, 58% of companies beat the estimates and 42% missed estimates.
In aggregate, companies are reporting revenue that are 1.6% above estimates, which compares to a long-term (since 2002) average surprise factor of 1.5% and the average surprise factor over the prior four quarters of 1.0%.
The estimated earnings growth rate for the S&P 500 for 19Q4 is 3.1%. If the energy sector is excluded, the growth rate improves to 6.0%. The estimated revenue growth rate for the S&P 500 for 19Q4 is 5.8%. If the energy sector is excluded, the growth rate improves to 7.1%.
The estimated earnings growth rate for the S&P 500 for 20Q1 is 1.8%. If the energy sector is excluded, the growth rate improves to 2.0%. Two weeks ago, these estimates were +4.4% and +4.3% respectively.
Cyclicals are most impacted with Financials (!) and Tech least affected according to analysts, so far…


Pre-announcements don’t look so bad in total but, since Feb. 21, we got 11 negatives and 4 positives, a 2.8x ratio. I suspect many companies have been waiting for more clarity, likely to be dispatched in the next week. That trend is not a sentiment booster.

Actually, investors will be in the dark on earnings for a while.
 China may have ‘no new virus cases’ outside Hubei epicentre by mid-March
 Reservations for domestic flights and hotels in China are recovering
 MESSAGE TO HARRISON W.