The enemy of knowledge is not ignorance, it’s the illusion of knowledge (Stephen Hawking)

It ain’t what you don’t know that gets you into trouble. It’s what you know for sure that just ain’t so (Mark Twain)

Invest with smart knowledge and objective odds

THE DAILY EDGE: 24 FEBRUARY 2020: Caution!

Stocks Slide as Virus Cases Accelerate Outside of Asia Global stocks fell as investors grappled with the potential economic fallout from mounting coronavirus infections in South Korea and other countries outside China.
  • Total China cases at 77,150, up by 409; death toll 2,592
  • Worldwide death toll 2,624; total cases 79,440
  • Afghanistan, Bahrain, Kuwait confirm first cases; 12 dead in Iran

(…) In Italy (…) more than 50,000 people weren’t allowed to leave their towns under a quarantine in effect Sunday. The outbreak’s epicenter within the country is just miles from Milan, the engine of Italy’s economy, and led to trade shows, soccer matches and other public events being canceled. (…)

South Korea on Sunday raised its infectious-disease alert to red—the highest level—for the first time since the H1N1 swine flu outbreak in 2009. (…)

“This will also put the hosting of Tokyo Summer Olympic Games under scrutiny, as Japan now has the highest number of infections outside of China alongside an aging population.” (…)

(…) Zhao Jianping, a doctor heading a team working in Hubei, said on Thursday that there had been cases in which patients tested positive after they had seemingly recovered. “This is dangerous,” Zhao was quoted as saying by Southern People Weekly magazine. “Where do you put those patients? You cannot send them home, because they might infect others, but you cannot put them in hospital because resources are stretched.” (…)

MORE CENTRAL BANK STIMULUS COMING
US Flash PMI signals first fall in business activity since 2013

Adjusted for seasonal factors, the Composite PMI Output Index (covering both manufacturing and services) slumped to 49.6 in February, down from 53.3 in the opening month of 2020.

Weakness was primarily seen in the service sector, where the first drop in activity for four years was reported, but manufacturing production also ground almost to a halt due to a near-stalling of orders.

New orders meanwhile fell for the first time in over a decade. The deterioration was in part linked to the coronavirus outbreak, manifesting itself in weakened demand across sectors such as travel and tourism, as well as via falling exports and supply chain disruptions. Exports of goods and services both fell at increased rates in February. However, companies also reported greater caution in respect to spending due to worries about a wider economic slowdown and uncertainty ahead of the presidential election later this year.

Compared with official data, statistical analysis indicates that the survey indices are consistent with GDP growth slowing from just above 2% in January to a crawl of just 0.6% in February. Manufacturing output is meanwhile indicated to be falling at a quarterly rate of 0.8% (roughly 3.2% annualised). Note that any IHS Markit PMI manufacturing output index below 53.7 is indicative of the official (Fed) measure of manufacturing production declining on a quarterly basis.

(…) the marked slump in the headline composite PMI in February is a warning that the coronavirus outbreak is having a material impact on the US economy, both through reduced service sector activity and via lost manufacturing exports and supply chain delays. As such, the PMI has moved further into territory that would be historically consistent with an easing bias at the FOMC. The big question for policymakers will be how long the PMI remains in such weak territory. (…)

Xi Pledges Easier Monetary Policy for Economy Pummeled by Virus

Fiscal policy will be more proactive, while construction projects will be accelerated, according to a statement issued after a Politburo meeting chaired by President Xi Jinping on Feb. 21.

The central bank will free up part of the reserves of some commercial lenders to unleash long-term funding to the economy, and consider adjusting the benchmark deposit rate at an appropriate time, Deputy Governor Liu Guoqiang said in a separate statement. (…)

Flash Australia PMI signals deeper downturn amid adverse weather, coronavirus

Eurozone:

Our colleagues in the European economic forecasting team expect eurozone GDP increase 0.9% this year, 1.0% in 2021, and 1.2% in 2022. On this basis, we assume no additional policy easing from the ECB in 2020, albeit with the current highly accommodative policy stance set to continue for a considerable period of time.

However, the next Governing Council meeting on 12th March is likely to see the ECB tweak its assessment of downside risks to the growth outlook to reflect the increased uncertainty stemming from the COVID-19 outbreak and restate, perhaps more forcibly, that it stands ready to adjust all of its policy instruments if necessary. The bottom line is that the ECB is going to want to have more time and information to gauge the significance of the COVID-19 outbreak and its consequences. It will therefore keep options open until it has a better grasp of the potential economic effects on the eurozone and their longevity.  (…)

German manufacturing exports fell during February at a marked and accelerated rate, whilst there was clear evidence of supply-chain disruption stemming from the COVID-19 related shutdowns in China (average lead times for the delivery of inputs to manufacturers deteriorated for the first time in over a year during February).

Subsequently, the German nowcast for Q1 GDP has been revised a little lower to -0.17%, from a previous estimate of -0.14%. Whilst we believe that official GDP growth in the first quarter will surely benefit from compensating rebounds in both industrial production and retail sales, which were driven markedly lower in December due to calendar-related distortions, the latest nowcast and PMI figures reinforce our view that the underlying performance of the German economy remains weak. (Markit)

Home Sales Sluggish as Lack of Inventory Frustrates Buyers U.S. home sales sputtered in January, the latest sign that some of the lowest interest rates in half a century are failing to offset the high prices and limited inventory keeping many buyers on the sidelines.

Existing home sales fell 1.3% in January compared with December at a seasonally adjusted annual rate of 5.46 million, the National Association of Realtors said Friday.

That compared with economists’ expectations for a 2% decline last month.

Existing-home sales were up 9.6% in January from a year earlier. (…) NAR said the housing inventory level was the lowest for January since 1999. (…)

Limited housing stock has contributed to higher home prices, with the median sales price for an existing home in January up 6.8% from the prior year at $266,300.

Inventory has been tight at the cheaper end of the market. Homes priced from $100,000 to $250,000 experienced a 10.3% drop in inventory from a year earlier in January. Meanwhile, homes in the $250,000 to $500,000 range saw inventory fall 6%. (…)

image(Haver Analytics)

(…) the slowest pace we’ve seen in 18 months, as the seasonal winddown wears on through the winter.

Rents are likely to maintain an upward streak throughout 2020, as the number of renters continues to rise in the U.S. The demand for apartments is high, including among those renting by choice. 157% more Americans who earn over $150K per year began renting this past decade, showing a preference for a more flexible and comfort-driven lifestyle. (…)

Saudis Weigh Breaking Oil Alliance With Russia as Virus Crimps Demand Saudi Arabia is considering a break from its four-year oil production alliance with Russia, as China’s coronavirus outbreak contributes to a drop in global oil demand, according to people familiar with the matter.

The Saudi kingdom, Kuwait and the United Arab Emirates—which collectively represent over half of OPEC’s production capacity—are holding talks this week to discuss a possible joint output cut of as much as 300,000 barrels a day, said the people.

The coronavirus outbreak has created a rift in the partnership between Russia and the Saudi-led Organization of the Petroleum Exporting Countries. The two sides have collaborated since December 2016 in an effort to balance global oil supply amid a surge of crude from U.S. shale producers. If the Saudis, Kuwait and the U.A.E. break with the Russians, the split could further weaken OPEC’s ability to influence oil prices. (…)

At an emergency meeting earlier in February, Russia rejected a Saudi push to deepen the alliance’s existing oil production curbs by 600,000 barrels a day.

Russian officials still don’t see a need for reductions, the people familiar with the matter said. Russian delegates say business activity in China is recovering and the impact of the virus on oil demand is limited, the people said.

Saudi exports to China have remained stable since the crisis began, though sales from other OPEC members have shown weakness, according to commodities-data provider Kpler. (…)

The International Energy Agency warned Feb. 13 that demand for oil is likely to be 435,000 barrels a day less in the current quarter compared with a year ago. Vitol Group, the world’s largest independent oil trader, cut its forecast demand for the quarter to 98.3 million barrels a day, down 2.2 million barrels a day from its previous forecast for the period. Under either scenario, a quarterly decline would be the first since the height of the global financial crisis.

However, Moscow says weakened demand would be offset by reduced supply resulting from Libya’s oil shutdown and new sanctions targeting Venezuela’s crude sales, one person familiar with the matter said.

Libya’s oil output has fallen to 120,000 barrels a day from 1.2 million daily barrels since a renegade general shut pipelines and oil ports in January in a dispute with the central government.

The U.S. on Tuesday imposed sanctions on a subsidiary of Russian state-run company Rosneft Oil Co. that had become the main marketer of banned Venezuelan crude. The new restrictions could cut Venezuelan exports by 600,000 barrels a day, said energy consulting firm FGE, which sees the market tightening by June as a result of the Libyan and Venezuelan disruptions.

Trump Says Farmers Might Get More Aid President Trump said the U.S. would consider a third round of aid payments for American farmers who have borne the brunt of retaliation for U.S. tariffs for much of the past two years.

(…) If farmers “need additional aid until such time as the trade deals with China, Mexico, Canada and others fully kick in, that aid will be provided by the federal government,” the president said on Twitter on Friday. (…)

The U.S. authorized a $12 billion program in 2018 and a $16 billion program in 2019.

The president has described the programs as being funded with tariff revenue and said a third program would be similarly funded. (…) The previous farm-aid programs weren’t directly funded by tariffs, however, but through a Depression-era Department of Agriculture program that is currently authorized to spend up to $30 billion a year to aid farmers amid poor farm conditions. Using the USDA program requires no congressional vote.

But corn stocks are going in the opposite direction, ballooning to the highest in three decades. And the president’s hints for more farmer aid could make the disconnect between the two even more pronounced.

Soybean reserves will fall 25% in the coming season to the lowest since 2016-17, the U.S. Department of Agriculture forecast at its outlook forum in Arlington, Virginia. Higher exports, especially to top importer China, will add to increased domestic demand to eat up stocks.

Meanwhile, the government forecast corn inventories will jump about 29% to 2.637 billion bushels as farmers plant more. That would be the highest in 33 years.

Current prices and yield prospects have increased bets that farmers will sow the yellow grain over the oilseed. The USDA on Thursday said corn plantings would likely climb to the highest in four years. While soybean acres should also rise, they are projected to stay below pre-trade war levels. (…)

“The farmer will plant like crazy,” Joe Davis, a director at brokerage Futures International, said in a message. “Trump is almost wanting the farmer to be happy and plant.”

EARNINGS WATCH

Punch We need to be careful with recent backward looking data as COVID-19 has the capability to completely change the picture.

From Refinitiv/IBES:

Through Feb. 21, 437 companies in the S&P 500 Index have reported earnings for Q4 2019. Of these companies, 70.5% reported earnings above analyst expectations and 19.9% reported earnings below analyst expectations. In a typical quarter (since 1994), 65% of companies beat estimates and 20% miss estimates. Over the past four quarters, 74% of companies beat the estimates and 19% missed estimates.

In aggregate, companies are reporting earnings that are 5.0% above estimates, which compares to a long-term (since 1994) average surprise factor of 3.3% and the average surprise factor over the prior four quarters of 4.9%.

Of these companies, 64.7% reported revenue above analyst expectations and 35.3% reported revenue below analyst expectations. In a typical quarter (since 2002), 60% of companies beat estimates and 40% miss estimates. Over the past four quarters, 58% of companies beat the estimates and 42% missed estimates.

In aggregate, companies are reporting revenue that are 1.0% above estimates, which compares to a long-term (since 2002) average surprise factor of 1.5% and the average surprise factor over the prior four quarters of 1.0%.

The estimated earnings growth rate for the S&P 500 for 19Q4 is 3.2%. If the energy sector is excluded, the growth rate improves to 6.1%. The estimated revenue growth rate for the S&P 500 for 19Q4 is 5.1%. If the energy sector is excluded, the growth rate improves to 6.3%.

The estimated earnings growth rate for the S&P 500 for 20Q1 is 3.2%. If the energy sector is excluded, the growth rate declines to 3.0%.

Analysts continue to ratchet down their Q1’20 and 2020 numbers,and at an accelerating rate:

image

image

Overall, pre announcements look ok BUT, in just the last week, 8 of the 10 new pre-announcements were negative:image

Q4 2019 U.S. RETAIL SCORECARD

Fifty seven percent of companies in the Refinitiv Retail/Restaurant Index have reported Q4 2019 EPS. Of the 119 companies in the index that have reported earnings to date, 71% have reported earnings above analyst expectations, 6% reported earnings in line with expectations and 23% reported earnings below expectations. The Q4 2019 blended earnings growth estimate is 8.0%.

The Q4 2019 blended revenue growth estimate is 4.6%. Fifty eight percent have reported revenue above analyst expectations and 42% reported revenue below expectations.

A Look at Leverage, Market Cycles, and Current Valuations

TECHNICALS WATCH

  • NDR Crowd Sentiment Poll (Ned Davis Research via CMG Wealth)

  • CAUTION

It has been a while since Lowry’s Research flagged caution. After Friday’s close, Lowry’s explained that while Adv-Dec lines still show broad participation in the market rally, the quality of the rally, “the strength or ‘intensity’ of the Demand supporting rising prices” is “providing a reason for caution about the market’s short-term outlook.” Specifically, nearly half of stocks are trading below their 10-day moving averages and 53% are below their 30-dmas.

“While a lack of intensity is not necessarily fatal to a market advance, this lack can leave a rally especially vulnerable to a rise in selling”, happening today. However, Lowry’s says that down volume on recent declines has been relatively light, concluding that “any near-term pullback would serve only as an interruption in an ongoing bull market still headed for new highs in the months ahead.”

My own caution here is to be aware that medium and long-terms are made up of a sequence of short-terms. Given the potential damage of COVID-19, I would be prudent buying the dips until they get into more reasonable valuation ranges.

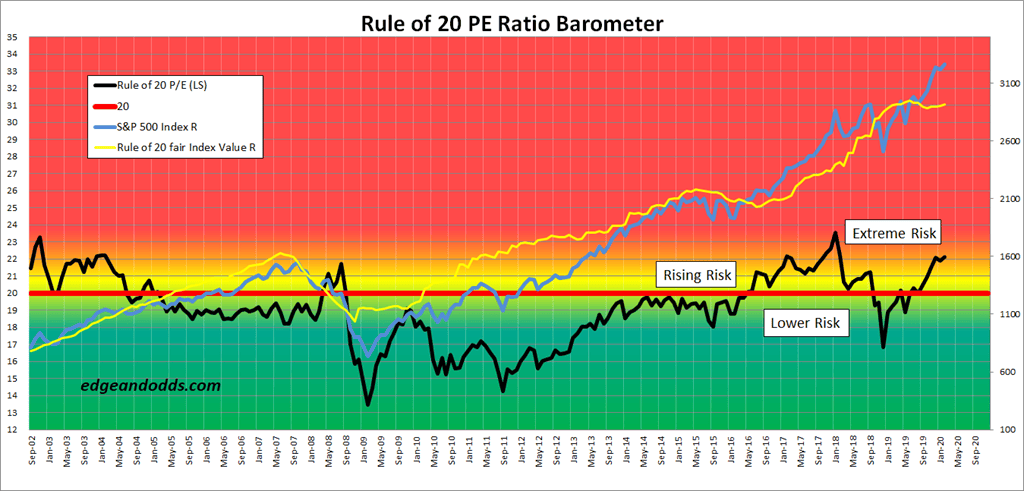
At today’s preopening of 3265 (charted below), the Rule of 20 P/E is 22.1 (recent peak 22.87). Fair Value at current trailing earnings ($164.60) and inflation (2.27%) is 2918 (R20 P/E = 20.0), 10.6% lower.
image

The December 2018 low was reached at a R20 P/E of 16.85 (2400) and the May 2019 low at 18.88 (2735). Technically, the 50-dma is at 3268, the 100-dma at 3155 (R20 = 21.4) and the 200-dma at 3038 R20= 20.7).

THE DAILY EDGE: 21 FEBRUARY 2020

U.S. Leading Economic Indicators Show Surprising Improvement

The Conference Board’s Composite Index of Leading Economic Indicators strengthened 0.8% during January following an unrevised 0.3% December decline. It was the largest increase since October 2017. (…)

Last month’s strength was paced by large increases in the weekly initial claims for unemployment insurance and the building permits components. The factory orders for nondefense capital goods, stock prices, the yield spread between 10-year Treasuries & Fed Funds, consumer expectations for business/economic conditions, consumer goods orders and the leading credit index also contributed positively to the index. The length of the average workweek had a neutral effect and the ISM new orders index contributed negatively to the index change.

Three-month growth in the leading index improved to 2.5% (AR) following three straight negative readings. The y/y change of 0.9% compared to a 6.5% high in September 2018.

The Index of Coincident Economic Indicators rose 0.1% during January after holding steady in December, revised from 0.1%. The y/y change of 1.1% was the weakest since September 2016. (…) Three-month growth in the coincident index of 1.9% (AR) remained down from 2.3% in August.

The Index of Lagging Economic Indicators held steady during January after an unrevised 0.1% dip in December. (…) Three-month growth in the lagging index fell to 0.7% from 4.2% six months earlier.

The ratio of coincident-to-lagging economic indicators is considered another leading indicator of economic activity. It increased to a four-month high.

Charts from Advisor Perspectives:

Conference Board's LEI

As we can see, the LEI has historically dropped below its six-month moving average anywhere between 2 to 15 months before a recession. The latest reading of this smoothed rate-of-change suggests no near-term recession risk.

Smoothed LEI

Here is a twelve-month smoothed out version, which further eliminates the whipsaws:

FLASH PMIs
USA: Output contracts for the first time since October 2013

Private sector firms across the U.S. signalled a slight decline in business activity in February. The overall contraction was driven by a notable worsening of service sector performance, where output fell for the first time in four years.

Adjusted for seasonal factors, the IHS Markit Flash U.S. Composite PMI Output Index posted 49.6 in February, down from 53.3 Surprised smile in the opening month of 2020. Although only fractional, the decrease in business activity brought to an end a near-four year sequence of expansion following a contraction in service sector output and a slower rise in manufacturing production amid supplier delays following the outbreak of coronavirus.

 image

New orders received by private sector firms fell for the first time since data collection began in October 2009. The fractional decline in new business stemmed from weak client demand across the service sector and the slowest rise in manufacturing new order volumes for nine months. Private sector companies continued to struggle to attract foreign client demand as new export orders fell for the second month running.

Employment continued to increase midway through the first quarter, albeit at the slowest pace in the current four-month sequence of growth. Manufacturers and service providers alike registered a rise in workforce numbers, although the pace of job creation eased in both monitored sectors.

Inflationary pressures softened in February. The rate of increase in cost burdens eased to the slowest since last October amid reports of lower demand for inputs. As a result, private sector companies raised their output charges at the softest pace for three months.

Business confidence strengthened to an eight-month high in February but remained historically subdued as firms highlighted ongoing global uncertainty and the outbreak of coronavirus.

The seasonally adjusted IHS Markit Flash U.S. Services PMI™ Business Activity Index registered 49.4 in February, down from 53.4 in January. The latest data signalled the first decline in business activity for four years and a notable turnaround from the solid output expansion seen in the opening month of the year.

The contraction in output was in part driven by a renewed decrease in new business across the service sector. Although only fractional overall, the rate of decline was the strongest in the series history (since October 2009). New export orders also fell as firms reported greater hesitancy among clients to place orders amid speculation regarding coronavirus.

Pressure on capacity was reduced in February, as the level of outstanding business fell. As a result, services companies increased their workforce numbers at a softer rate. That said, business confidence reached the strongest since last June.

At the same time, input prices rose at the slowest pace in the current five-month sequence of inflation and was only slight overall. In an effort to remain competitive, firms raised their output charges only fractionally.

Goods producers noted only a slight improvement in operating conditions in February, as signalled by a fall in the IHS Markit Flash U.S. Manufacturing Purchasing Managers’ Index™ (PMI™) from 51.9 to 50.8 midway through the first quarter. The improvement in the health of the manufacturing sector was the slowest since last August.

The lower headline index reading was partially driven by slower expansions in production and new orders. The upturn in output was the softest since last July, with firms stating that weak demand conditions and delays in deliveries following the outbreak of the coronavirus in China had dented production growth.

Although output expectations improved and reached a ten-month high, business confidence remained relatively muted as firms suggested uncertainty surrounding the impact of coronavirus had weighed on optimism and could further impact production.

Meanwhile, inflationary pressures remained historically subdued midway through the first quarter amid a slower rise in cost burdens. Firms only raised their charges fractionally as they sought to remain competitive and boost sales.

Chris Williamson, Chief Business Economist at IHS Markit:

With the exception of the government-shutdown of 2013, US business activity contracted for the first time since the global financial crisis in February. Weakness was primarily seen in the service sector, where the first drop in activity for four years was reported, but manufacturing production also ground almost to a halt due to a near-stalling of orders.

Total new orders fell for the first time in over a decade. The deterioration in was in part linked to the coronavirus outbreak, manifesting itself in weakened demand across sectors such as travel and tourism, as well as via falling exports and supply chain disruptions. However, companies also reported increased caution in respect to spending due to worries about a wider economic slowdown and uncertainty ahead of the presidential election later this year.

The survey data are consistent with GDP growth slowing from just above 2% in January to a crawl of just 0.6% in February. However, the February survey also saw a notable upturn in business sentiment about the year ahead, reflecting widespread optimism that the current slowdown will prove short-lived.

Eurozone business bucks virus impact as growth hits six-month high

The eurozone economy grew at its fastest rate in six months during February, according to flash PMI® data. Although remaining weak, the rate of expansion accelerated for a third straight month despite signs of demand being dampened and production being stymied by the coronavirus outbreak.

At 51.6 in February, the ‘flash’ IHS Markit Eurozone Composite PMI rose from 51.3 in January to indicate the largest monthly increase in business activity since last August. Growth was centered on the services sector, where business grew at the joint-fastest rate seen over the past six months. Manufacturing meanwhile remained in decline, although the rate of contraction in output eased to the mildest seen over the past eight months.

image

The overall rate of expansion remained only modest, however, largely due to subdued new business growth. New orders rose at a rate equal to January’s seven-month high, yet the rise was insufficient to prevent backlogs of work continuing to decline slightly, hinting at persistent excess capacity.

Inflows of new business into the service sector grew at a fractionally weaker rate than seen in the prior two months, the slowdown in part linked to travel, tourism and some areas of business reportedly being disrupted by the coronavirus outbreak.

New orders placed at manufacturers meanwhile fell for a seventeenth successive month. More encouragingly, the overall drop in factory orders was the smallest for 15 months as firming demand from domestic customers helped offset a stronger decline in export orders.

A notable development constraining manufacturing in February was a marked lengthening of supplier delivery times, with delays for inputs the most widespread since December 2018, attributed in many cases to supply chain issues arising from the COVID-19 outbreak.

The ongoing relative weakness of new business growth meant employment continued to rise at a weaker pace than seen throughout most of last year, sustaining the softest spell of job creation seen for five years, albeit with the rate of job creation still up on December’s low. Service sector payroll gains slipped to a 13-month low, but job losses in manufacturing eased to the lowest for three months.

The flash February PMI data also showed inflationary pressures cooling slightly. Average input prices rose at a pace slightly weaker than January’s eight-month high, while average selling prices for goods and services rose at the joint-slowest rate for over three years. Inflation trends continued to vary by sector: service sector costs and prices rose but factory costs and charges continued to fall, with average prices charged for goods dropping at the fastest rate for almost four years.

Finally, expectations of output growth over the coming year dipped from January’s 16-month high, though remained well above the average seen in 2019 and up markedly from the low plumbed last August. Sentiment softened in both services and manufacturing.

(…) The flash PMI has climbed to a six-month high, consistent with GDP growing at a quarterly rate approaching 0.2%. (…)

Japan: Private sector output declines at strongest pace since April 2014

Latest PMI data dash any hopes of a first quarter recovery in Japan and significantly raise the prospect of a technical recession in the world’s third largest economy.

Japan’s economy has gone into 2020 still reliant on services and consumer-centred markets to pick up the slack from the industrial sector. However, fourth quarter GDP disconcertingly showed that the sales tax hike and devasting typhoon in October severely dented consumption, and flash data indicate that domestic demand is still yet to fully recover. New business at services companies fell at the strongest rate since June 2016, with survey evidence implying that the coronavirus outbreak has hit tourism particularly hard in Japan, a key source of demand for services. Overall, February flash PMI data stack the odds heavily against Q1 growth, despite Abe’s best efforts to stimulate the economy after the sales tax hike.

image

Daimler warns of “significant adverse effects” of virus outbreak

“Risks for the Daimler Group may not only affect the development of unit sales, but may also lead to significant adverse effects on production, the procurement market and the supply chain,” the Stuttgart-based company said in its annual report bit.ly/2SJHGOi.

It also noted that the epidemic posed a risk for economic growth in China, other Asian countries and worldwide. (…)

Global Stocks Slip on Signs of Coronavirus’s Economic Impact Stocks fell on early signs of the coronavirus outbreak curtailing economic growth in some markets and evidence that the epidemic is claiming more lives outside China.

Investors may be underestimating the impact of the outbreak on U.S. companies’ earnings as economic activity slows in China and tourism takes a hit, Goldman Sachs Group warned. More than 75,000 people have been diagnosed with coronavirus, and over 2,000 have died globally. South Korea reported its first fatality, while two patients in Iran also died and confirmed cases began to climb in Beijing.

Preliminary figures for Japan’s February manufacturing activity meanwhile showed the sharpest contraction in more than seven years, Deutsche Bank said. Data on the country’s services sector fell to the lowest since April 2014 as the spread of coronavirus hurt tourism, according to IHS Markit. (…)

(…) businesses say the recent upheaval is causing them to rethink their supply chains. Outdoor-fireplace maker Blue Rooster Co., which imports cast-metal parts from China and then assembles them in Minnesota, is now looking at bringing nearly 90% of its production in-house. Currently two of its three main suppliers in China are offline. (…)

Source: World Economics

More supply chains problems:

Canadian ports on two coasts congested due to rail blockades Ships have suspended calls at the Port of Halifax and dozens of cargo vessels are sitting at anchor near the Port of Vancouver as freight shipments have been halted across much of the country
China Says No Turning Point; Korea Infections Jump: Virus Update

The coronavirus outbreak accelerated outside China, with South Korea reporting a surge in infections. China adjusted the number of cases for the third time this month, raising more questions over the reliability of the data.

The epidemic in China has been tentatively contained but hasn’t reached a turning point yet, according to China Central Television, which cited a politburo meeting. Infections in China topped 75,000.

South Korea reported 48 more cases, taking the total number to 204. Neighboring Japan is also seeing outbreaks in several unconnected areas. Singapore reported recoveries outpacing new cases. (…)

A BULL CASE?

From David R. Kotok, Chairman and Chief Investment Officer, Cumberland Advisors:

(…) COVID19 has put all central banks on the stimulus track, and the growth of world liquidity is driving stock prices higher and keeping bond yields very low. At Cumberland we are nearly fully invested in our US ETF strategies, and our quantitative strategies are fully invested and positioned offensively. (…)

So add low interest rates to suppressed inflation (temporarily) coupled with slowing worldwide growth, and we get a powerful upward force for stock prices. Our upside target for the S&P 500 Index is now 3600 or higher.

Let’s think of that in the following way. We reduce the 2020 earnings estimate because of coronavirus shocks. We are taking our estimate for the 2020 calendar year down to $165 with a plus or minus range of $4. But we are also lowering the equity risk premium (ERP), which translates into raising the P/E of those earnings. Here’s why.

Older models of ERP calculations would have kept you out of the stock market for some time now and would still keep you out. Why? Because they were derived when both inflation and interest rates were higher. Does a 300-basis-point ERP apply when the running 10-year Treasury yield is around 1.5-2%? It did apply when that yield was 4%. But should it now be reduced?

We think the answer is yes, if one believes the 10-year yield is now likely to hover around 2% or even lower. The coronavirus has pushed out any rise in interest rates and has added a lot of liquidity fuel from central banks. So we believe the ERP must be smaller now.

Consider what it would mean if the ERP were 200 instead of 300 basis points. Apply a 25 running P/E to our earnings estimate. 4% earnings yield minus 200 basis points of ERP is the base case for a 25 p/e.  It is easy to see how the S&P 500 can trade between 3600 and 4000 even as the coronavirus reduces 2020 earnings. Please note that at that S&P 500 level, the yield on the S&P index is about equal to or above the yield on the 10-year Treasury.

So, we’re leaning to full investment in our portfolios. We don’t like a natural disaster that is sickening many and killing folks every day. We think the spread of the virus will continue. We’ve seen credible estimates as high as an eventual 4-5 million cases and a baseline 2% to 4% fatalities rate worldwide.

But the investment outlook now is for a massive central bank liquidity response, and that means higher multiples for stock markets around the world.

Of course, things could change at any time. The same is true for our managed portfolios.

FYI, a 25 P/E, or a 4% earnings yield (red line below), has very rarely been seen since 1927 and never proved to be in a buy-low environment, to say the least.

image

True, interest rates have also rarely been so low, but when they were nearly as low as currently, the earnings yield, and the ERP, were much higher. Not to say we cannot see 3600, 4000 even, but I would not say these levels are “easy to see”.

Also consider that the correlation between the Earning Yield and 10Y Treasury yields is 20.3% since 1927. BTW, the correlation between the S&P 500 price and trailing EPS is 98.2%. I wonder what “an eventual 4-5 million cases and a baseline 2% to 4% fatalities rate worldwide” would do to economies, earnings and investor confidence. Not to mention what an ever rising USD will do to foreign earnings of S&P 500 companies.

fredgraph (62)
EARNINGS WATCH

We now have 437 reports in, a 70% beat rate and a +5.0% surprise factor.

Q4 earnings are now expected up 3.2% vs –0.3% on Jan. 1. Revenues are up 5.1% vs +4.1% on Jan. 1.

Q1’20 earnings are seen up 3.2%, much slower than the +6.3% of Jan. 1. Q2 forecasts are also trimmed, from +7.2% to +6.0%. Still, full year earnings are seen up 7.7% (vs +9.7% on Jan. 1), a sharp acceleration from +2.0% in 2019.

Pre-announcements remain generally positive compared to Q1’19 and Q4’19 but the last few days were mainly on the negative side…

Trailing EPS are now $164.60. At 3338, the Rule of 20 P/E is 22.55.

Mom and Pop Are On Epic Stock Buying Spree Fueled by Free Trades Small investors are back in a big way.

(…) While it’s tough to know what’s causing what — bull markets are fueled by new converts but also lure them — trading volume at online and discount brokers has exploded. TD Ameritrade Holding Corp., which started offering free trading in October, has seen million-trade days multiplying at a record pace.

Discount brokerages' trading volume explode

(…) “I’ll invest smaller amounts. Before I never really invested anything less than $1,000, $500 minimum,” he said in a phone interview. “Now if I have enough to buy an extra share, I’ll do it. I’ll do like $300.” (…)

“The fact that we have been in a bull market for a long time, people are just optimistic. Things are going up and they continue to go up.” (…)

“There’s sometimes no fundamental reason for it. It just is based on perception — a perception based on narratives that run only an inch deep,” he said in note. “Let’s see how much longer it persists. This kind of activity often unwinds much faster than the wind up.”

Bob Farrell’s Rule #5: “The public buys the most at the top and the least at the bottom”