The enemy of knowledge is not ignorance, it’s the illusion of knowledge (Stephen Hawking)

It ain’t what you don’t know that gets you into trouble. It’s what you know for sure that just ain’t so (Mark Twain)

Invest with smart knowledge and objective odds

THE DAILY EDGE: 15 AUGUST 2019

U.S. Retail, Factory Data Top Estimates in Positive Signs

The value of overall retail sales climbed 0.7% in July after a downwardly revised 0.3% increase in the prior month, according to Commerce Department figures released Thursday. The New York Fed’s Empire State index for August, which covers manufacturers in New York, bucked expectations for a decline, while a similar gauge for the Philadelphia Fed’s region fell by less than projected. (…)

U.S. retail sales post fifth-straight gain after several volatile months

China Signals U.S. Tariff Delay Not Enough to Stop Retaliation

(…) top negotiators held a phone call earlier this week and the U.S. delayed the imposition of some of the new tariffs. Negotiators also agreed to have another phone call in the coming two weeks and people familiar said earlier the Chinese delegation is sticking to their plan to travel to the U.S. in September for face-to-face meetings.

The statement indicates that China doesn’t think the U.S. delaying some of the tariffs is enough, said Zhou Xiaoming, a former Ministry of Commerce official and diplomat. China is very serious and is sticking to the position that no new tariffs should be imposed at all, he said, adding that China’s retaliation “may not be limited to tariffs.” (…)

Less than 12 hours before the Chinese statement on retaliation, Trump appeared to float the possibility of another meeting with Xi. In a flurry of tweets, Trump defended his tariffs decisions, praised Xi and urged the Chinese president to “humanely” resolve the protests that have gripped Hong Kong for more than two months.

He ended the posts with an apparent overture to Xi — writing “Personal meeting?” — without clarifying whether he was suggesting another summit. (…)

Manhattan, Brooklyn Rents Soar to New Highs Manhattan and Brooklyn rents in July surged to their highest levels in at least a decade, turning the hunt for an apartment into a madcap ordeal for some renters.

In Brooklyn the median rent rose to $3,000 a month, a record. Manhattan rents hit $3,595 a month, which was only $100 a month below the record set in February 2009, according to a market report by Douglas Elliman Real Estate. (…)

He said median Manhattan rents, after taking into account landlord concessions, spiked 6.5% from the figure in July 2018, the biggest such increase in about four years. In Brooklyn, the comparable figure was up 3.1%. (…)

EARNINGS WATCH
Earnings Outlook for S&P 500 Companies Looks Bleak Wall Street analysts have cut third-quarter profit estimates, painting a bleak picture for investors already grappling with a trade war, economic weakness and ominous signs from the bond market

(…) At best, earnings across the companies in the S&P 500 will grow 1.5% this year, FactSet projects, far short of estimates for growth of more than 6% that analysts initially forecast in January. Worse, a few analysts predict earnings could end up contracting for 2019 as a whole.

Dozens of companies including Eastman Chemical Co. EMN -5.17% , Macy’s Inc.M -13.22% and Caterpillar Inc. CAT -3.19% have issued downbeat outlooks for the rest of the year, contributing to the pullback in profit expectations.

“Everyone in April and through the beginning of May thought that the economy was going to get better in the back half of the year, trade war was going to sort of settle, certainly not escalate,” Eastman Chemical Chief Executive Mark Costa said on an earnings call last month. “And now we’re just in a very different world where I don’t think that’s true….There’s not a lot of signs of economic recovery coming in the second half.” (…)

Analysts’ latest revisions show the S&P 500 faces a 3.15% contraction in third-quarter earnings from a year earlier, according to FactSet. And for the fourth quarter, the S&P 500 is now on track to increase profits by less than 4%, down from the nearly 10% growth rate analysts expected at the beginning of the year. (…)

Tariffs aren’t the only factor to blame for the weaker outlooks. Second-quarter profit margins across all S&P 500 sectors are down from a year earlier, according to FactSet. Rising labor and commodity costs, as well as a strong dollar, have helped to dent profits. (…)

The S&P 500 has slumped 4.7% in August, including Wednesday’s 2.9% drop, leaving the broad index roughly where it was 12 months ago. And moves in the bond market have signaled an economic slowdown could be on the horizon. (…)

Refinitiv/IBES has other stats:

Q3 earnings are seen down 1.6% (-0.2% ex-Energy), Full year 2019: +1.7%.

Pre-announcements: 58 negative vs 53 at the same time during Q2. Positives: 19 vs 15.

The S&P 500 Tends to Rise After an Inverted Yield Curve An inverted yield curve in the Treasury market is scaring investors. Yet the S&P 500 actually tends to gain following such a signal.

(…) According to Dow Jones Market Data, the index has gained an average of 2.53% three months after the yield curve first inverted between 1978 and 2005. Six months after the start of these inversions, the broad stock index’s gains were an average of 4.87%. A year afterward, the index gained an average of 13.48%. Two and three years out, the S&P rose an average of 14.73% and 16.41%, respectively.

Three months after yields inverted on Dec. 20, 2005, the S&P gained 4.16%. Six months afterward, it was up 1.76%, and a year on it increased 13.62%. Two years later, it was up 18.44%. Three years on, it dropped 28.65% amid the financial crisis.

Sometimes, the S&P 500 has dipped in the short term. When the curve inverted on May 26, 1998, the index was down 0.90% three months later, but six months afterward was up 8.49%. It also fell three and six months after the start of the inversion on Aug. 17, 1978, but a year later was up 3.06%.

The biggest S&P 500 increase three years following the start of an inverted yield curve was tied to a Dec. 9, 1988 inversion. The S&P continued to post gains, and three years later ended 36.54% higher.

I have not done the verification but beware of averages.

TECHNICALS WATCH

CMG Wealth’s technical indicators are mostly positive, including this 13/34–Week EMA Trend Chart:

STOCKS VS BONDS

SentimenTrader’s stock/bond ratio is –3.1 as of yesterday’s close. This ratio normally fluctuates between –2.0 and +2.0. It rarely gets above +3.0 or below –3.0. “When the ratio hits -3, it suggests that stocks are deeply undervalued relative to bonds, and we rarely see a more extreme condition.”

Recent times at –3.0 or below, FYI:

  • May 31, 2019
  • December 17, 2018
  • June 27, 2016
  • August 24, 2015
  • June 1, 2012
  • August 4, 2011
  • October 6, 2008
  • …

THE DAILY EDGE: 14 AUGUST 2019: The Puppets Show

THE PUPPETS SHOW

So,

  • this data-dependent Fed embarks on a well telegraphed and “transparent” tightening path, only to completely pivot after equity markets tank fearing recession.
  • Data-dependency gives way to pre-emptive easing as FOMC voters fret about the trade war and a possible escalation that might create a recession. The last FOMC minutes used the words “risks” and “uncertainties” 48 times.
  • This pivot also gets justified by the stubborn inflation that, from the Fed’s lens, refuses to even attempt to point towards the magical 2.0% level.
  • The Fed officially cuts by 25 points, telling us that the economy is still humming nicely and that this is merely a “mid-cycle” adjustment, 10 years into the recovery.
  • Investors and Trump both loudly express their disagreement with the Fed’s action and words.
  • For good measure, reading Powell’s trembling lips, Trump goes against his advisors and announces 10% tariffs on an additional $300B of Chinese exports of primarily consumer goods effective September 1.
  • China “retaliates” by stopping to support the renminbi which briefly eases above the so-called 7.0 threshold. Mnuchin immediately declared China a currency manipulator, just 2 few months after the Treasury officially said it was not.
  • Equities sink again and bond prices skyrocket.
  • Somebody must have told Trump that September 1 is the start of the most important period for retailers. Since the U.S. economy only holds by the consumer nails, timing for these new tariffs is not optimal, Mr. President.
  • “The office of the U.S. Trade Representative on Tuesday said it would instead delay the new tariffs on many major categories of items, including smartphones, laptop computers and toys, until Dec. 15. The USTR said some products would be removed from the tariff lists entirely, based on health, safety, national-security and other factors. The list of excluded items includes some of the biggest-ticket items facing tariffs. Cellphones and laptops alone represent about $80 billion of trade.” (WSJ)
  • Only Trump knows why this announcement went untweeted, unlike virtually every other ones, but markets nonetheless took the USTR word for cash and spiked up.
  • The same morning, the BLS releases the July CPI data. Just about every measure is up by 0.3% MoM and 2.0%+ YoY. Even the ever deflating Core Goods have appreciated in price by +0.2% in July after +0.4% in June.

So,

  • the trade war is not escalating after all. Postponing the next hike to “December 15” probably means December 15, 2020, at the earliest.
  • But it’s also not de-escalating and U.S. importers increasingly struggle with the continuing 25% tariffs.
  • Inflation is at, even above, the Fed’s target by many measures and there is increasing evidence that tariffs are being passed on.

What will the Fed do now that there is no escalation but there is apparent inflation in the numbers? Let’s watch Mr. Market. He’s pulling all the strings, from Eccles building to the White House.

Meanwhile, the Chinese totally understand what’s going on and let the puppets perform their act while they can.

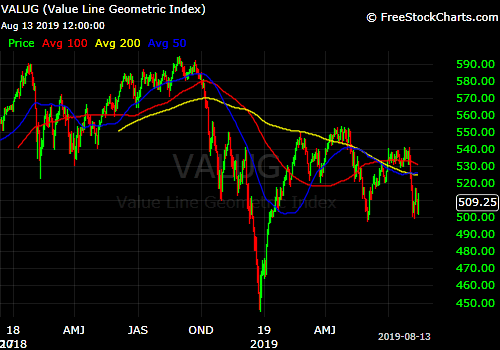
But financial markets don’t seem to know much more than the puppets where this economy is going:

w5000

 valug iwm

image

Here’s what we do know:

  • The S&P 500 Index is at 19.8 on the Rule of 20 P/E on today’s pre-opening of 2890, only slightly undervalued.
  • The Rule of 20 Fair Value is 2922 based on trailing EPS of $164.25 and inflation of 2.2%.
  • Fair Value peaked at 2952 in June and has declined in each of the last 2 months as trailing EPS have stalled while inflation has crept up.
  • The Q2 earnings season is almost over so trailing EPS are likely to remain stable for 2-3 months.
  • Inflation seems to be creeping up, threatening a third consecutive decline in month-end Fair Value.

Three consecutive monthly declines in the Rule of 20 Fair Value (yellow line) is a rather rare phenomenon. When it has happened, it has generally not been received warmly by equity investors unless inflation quickly receded (e.g.: 01/84, 08/87, 12/89, 02/01, 08/08). Equities do prefer rising earnings and stable or declining inflation.

image

image

As of Monday night, we had 453 S&P 500 company reports in, a 73% beat rate, a +5.6% surprise factor and a blended +2.9% earnings growth rate, bettering the +0.3% expected growth rate on July 1. Earnings are hanging in. Q3 estimates are –1.6%, down from +0.8% on July 1 and Q4 estimates are +5.1%, down from +7.2%. Unless Q3 results beat significantly, trailing EPS will decline over the next 3 months.

But there is also the rising inflation risk. This Cleveland Fed table gives the trends:

image

The sticky-price consumer price index (CPI)—a weighted basket of items that change price relatively slowly—rose 3.4% annualized in July, following a 3.0% increase in June. On a year-over-year basis, the series is up 2.5%. The core sticky-price index rose 3.4% annualized in July, and its 12-month percent change was 2.5%.

The flexible cut of the CPI—a weighted basket of items that change price relatively frequently—jumped 6.4% annualized in July, and is up 0.3% YoY.

The Atlanta Fed also has a wage growth tracker. Breaking out?

image

China’s Growth Struggles Mount China reported a raft of weak economic data, adding to evidence that the world’s second-largest economy is slowing further as it remains locked in a trade war with the U.S.

(…) Industrial production rose at its slowest pace since the beginning of 2009, increasing 4.8% in July from a year earlier compared with a 6.3% rise in June, the National Bureau of Statistics said Wednesday. (…) Retail sales—a gauge of consumption—rose 7.6% in the period, down from a 9.8% increase in June, as car dealers finished unloading inventories ahead of new emissions standards. (…)

Urban unemployment shot up to 5.3% in July, matching a record high in February, data from the statistics bureau showed. (…) China International Capital Corp. said in a research report in July that the nation’s industrial sector has lost five million jobs in the past year, attributing 1.8 million to 1.9 million jobs losses to the trade war with the U.S. (…)

There are a lot more stats in this Reuters’ piece. Some charts from Bloomberg via Zerohedge:

U.S. to Back More Condo Loans Aimed at First-Time Buyers The Trump administration is vastly expanding the scope of condominium purchases eligible for lower-down-payment loans.

(…) The FHA now insures a million home loans made by banks and other private lenders, the vast majority of which are for single-family homes. With the new rules, the agency estimates it could insure as many as 60,000 additional condo loans each year, on top of the 16,000 condo loans it backed in 2018. (…)

“FHA is already a higher risk program,” Mr. Stevens said. “Layer that on top of a higher-risk product called the condominium and you definitely have to prepare yourself for the fact that in the next correction you’re going to take more losses at FHA than anywhere else.”

Mr. Stevens said condos are a dicier proposition because units in a building can be turned into rentals, which tend to be less-well-maintained. A single foreclosure in a condo building can affect other units as windows aren’t washed, balconies aren’t painted and maintenance dues aren’t paid. (…)