The enemy of knowledge is not ignorance, it’s the illusion of knowledge (Stephen Hawking)

It ain’t what you don’t know that gets you into trouble. It’s what you know for sure that just ain’t so (Mark Twain)

Invest with smart knowledge and objective odds

THE DAILY EDGE: 5 AUGUST 2019: Recession Watch

RECESSION WATCH
Steady Jobs Growth Keeps U.S.’s Record Expansion on Track Employers added jobs at a steady pace in July and unemployment held at a historically low level, providing a solid foundation for the decadelong U.S. expansion at a time of global headwinds.

Completely reassuring headline from the WSJ.

David Rosenberg, who keeps looking for a recession through the economic fog, claims that payrolls actually declined 210k in July because the workweek shrank 0.3% to 34.3 hours, “equivalent to a job loss of 375k”. Tackling manufacturing more specifically,

a 0.7% contraction in the workweek (to 40.4 hours) and a 5.9% drop in overtime hours (to 3.2 hours) actually means that (in person-equivalent terms) jobs declined 79k last month. This spells contraction for the upcoming industrial production report and comports nicely with the downbeat tone of the ISM report that was released yesterday. Not just that, but the work-based income figure –average weekly earnings- was flat last month and negative in real terms. That suggest that the 4-handle on real consumer spending in the second quarter GDP report was little more than aberration, and always had to be taken in the context of two prior quarter of 1%-ish growth.

Here is all you have to know. The index of aggregate hours worked for production and nonsupervisory employees has dipped at a 0.7% annual rate over the past six months. My friends, that is recession factoid. This actually is weaker than the near-flat pace in December 2007 that represented the peak in that cycle. The current six-month trajectory precisely matches the rate of change in total labor input in December 2000 and this led to the 2001 recession by three months. Go back to July 1990, when that recession actually began, and the trend in aggregate hours worked was right where it is today. Ignore the hood (the headline print) and focus on the engine (the entire labor input).

Follows a 35-year chart proving his points, except that there is more to know: 2 other occurrences proved to be false alarms, rather disturbing against only 3 good calls. A good economist, but unable to sport a statistician label.

National Bank Financial: Soaring full-time employment lifts wages

The U.S. economy and its labour market continue to defy doomsayers. Coming just one week after consensus-topping Q2 GDP results, employment reports for July suggest the expansion has legs. While showing downward revisions to prior months, the establishment survey was nonetheless encouraging given overall healthy gains (+164K). Those concerned about a downturn may feel reassured by continued gains in cyclical sectors such as construction and manufacturing but also in temporary employment which is a decent leading indicator. Wage inflation also picked up as hourly earnings climbed to 3.2% on a year-on-year basis.

The household survey showed even more impressive job creation (+283K), allowing the jobless rate to remain unchanged at 3.7% (i.e. close to 50-year lows) despite an uptick in the participation rate. Full-time employment soared, taking its share of overall employment to almost 83%. As today’s Hot Chart shows, this increasing share coincides with the ramp up in wage inflation. That should not be surprising considering full-time positions tend to be better remunerated. All in all, this morning’s jobs reports are consistent with continued expansion and higher inflation pressures. While that validates the Federal Reserve’s current stance of being careful with rate cuts, the escalating trade war between the U.S. and China could force the FOMC’s hand into being more aggressive than it would have liked.

Unfortunately, full time employment has proven to be a lagging indicator as employers tend to first part with part-timers when things get tougher.

I tend to focus on a combination of all the above mentioned indicators, considering that people don’t buy goods and services with hours and workweeks but with weekly checks. It so happens that trends in consumer spending correlates quite well with trends in aggregate weekly payrolls (jobs x hours x wages). Not a clean recession indicator, but given that the U.S. consumer seems to be the only growth engine in the world, very much worth following.

image

There is a definite slowdown in weekly payrolls growth, from 5.7% YoY in January to 4.4% in July, the causes of the decline being split almost evenly between jobs and hours as wages were roughly unchanged. Total inflation being fairly steady in the 1.5-1.7% range, consumer expenditures also slowed, with the spending brakes all applied last December. 

A similar “preventive spending cut” was seen in the fall of 2015 after the 60% collapse in oil prices as workers in oil-sensitive sectors braced for tougher times. This year, many Americans likely prepared for the government shutdown (Dec. 22- Jan. 25) and to took a cue from investors and fretted about trade wars and a possible economic slowdown, until Powell pivoted right after Christmas.

The growth in month-over-month nominal aggregate weekly payrolls has been very volatile this year but its annualized growth rate over the first 7 months and the last 3 months has been steady at 3.2%. At a constant savings rate, consumer spending should thus rise 3-4% in nominal dollars or 1.5-2.5% in real terms, barely enough to sustain an economy running on this sole cylinder. If I were a FOMC voter focused on risk management I would work with these premises and ease monetary policy going into the important spending season from Back-to-School to Thanksgiving to Christmas.

image

Even more so given that the odds of a quick and agreeable resolution to the China-USA trade war are getting slimmer by the tweets.

Even more so given that Americans have shown a growing preference for savings since the Great Financial Crisis and the Lower-For-Longer interest rate policy.

Forecasting the savings rate is as important as it is challenging. Imagine if Americans were to go back to saving 10-12% of their income. Not that stupid an idea considering aging demographics, health care costs, negative real savings rate, unfunded pension plans when they exist and youths’ distaste for overconsumption. Trying to list factors favouring lower savings is much more demanding.

image

The savings rate averaged 7.1% since 2013 but it rose to 7.7% on average in 2018 and 8.3% in the first half of 2019.

For me, here is all I have to know: unless job and hours growth accelerates meaningfully, real aggregate weekly payrolls should not be growing faster than 2.5% and rising savings could really hurt this economy. From my lens, the risks to the forecast for the U.S. consumer economy seem to be generally tilted to the downside.

From the July U. of Michigan Survey of Consumers:

Consumer sentiment remained unchanged in late July from the mid-month reading, with all component questions showing only small and offsetting changes. Economic confidence has been remarkably stable since the start of 2017, despite ongoing trade uncertainties. The resilience displayed has been primarily due to a renewed sense of personal financial optimism. Indeed, recent surveys have recorded the most favorable net personal financial expectations since May 2003. Positive job and income prospects, gains in net household wealth, and low inflation have bolstered optimism. At present, consumers do not anticipate a rapid acceleration in income growth rates, nor do they expect significant changes in inflation and unemployment rates.

Consumers have not ignored mounting policy uncertainties as they have begun to take precautionary measures to increase savings and reduce debt. Favorable buying attitudes toward homes and vehicles have significantly receded from their cyclical peaks despite declining interest rates.

To conclude on Friday’s employment report, the Household Survey (HS-red line) shows employment growth slowing much faster than the more widely followed Payroll Survey (PS-blue). These lines will eventually meet again and let’s hope that the more volatile HS line (+0.9% YoY in Q2, +0.8% in July) is the one reaching out.

image

Pointing up Note also that the YoY growth in employment for the important 25-54-year main breadwinners (black) actually turned negative in July. This group, comprising 64% of all employment, has lost 519k workers since peaking in October 2018. Over the last 50 years, the YoY rate of growth in this cohort has turned negative 13 times and only twice this was not immediately before or during a recession. Rosenberg seems to have missed that one…

image

One more scary chart from CMG Wealth:

Last week, the New York Federal Reserve Bank published an update to their recession probability index, indicating an increase in the probability of a U.S. recession in the next 12 months. It’s important to note that, every time since 1960 that this index breached 30%, a recession occurred.  Best guess within the next six to nine months.

image

Also scarier and scarier:

Trump Ordered New Chinese Tariffs Over Advisers’ Objections President Trump overruled advisers to ramp up tariffs on China after a heated exchange in which he insisted it was the best way to make China comply with demands.

(…) Mr. Trump, who has speculated the Chinese may be waiting to negotiate with a possible Democratic successor, says a strong U.S. economy gives Washington the upper hand if the dispute drags on. But advisers argued that a new round of tariffs could hurt the U.S. economy and further strain relations with China. (…)

After returning, the trade negotiators and other top advisers congregated early Thursday afternoon in the Oval Office to brief Mr. Trump on the talks. Messrs. Lighthizer and Mnuchin conveyed that they didn’t yield the kind of results that Mr. Trump had intended, the people said.

Mr. Trump, who had a re-election rally scheduled in Ohio later that day, wanted to be able to assure farmers—who have been hardest hit by the trade fight as China scaled back purchases of U.S. corn, soybeans and pork—that he had at least secured concrete commitments from the Chinese that they would boost their purchases of U.S. agricultural exports.

But to his frustration, Messrs. Lighthizer and Mnuchin couldn’t give him any guarantees. (…)

All of them [6 advisers], save Mr. Navarro, a China hawk, adamantly objected to the tariffs, the people said. That spurred a debate lasting nearly two hours, one of the people said. Beijing insists that tariffs must be dropped in return for concessions demanded by the U.S.

The president said his patience had worn thin and stood by his argument that tariffs were the best form of leverage, the person said. (…)

The decision followed weeks of advice from some of Mr. Trump’s advisers, including his son-in-law Jared Kushner, to put China talks on the back burner, according to the people and a former administration official.

The president’s advisers urged Mr. Trump to focus on other trade pacts, including the pending deal with Canada and Mexico, which still needs congressional approval, as well as talks with Japan, which in recent weeks have gained momentum, these people said. (…)

Elsewhere in the WSJ:

Trump’s “trade war with China has failed and he is doubling down on a failing strategy,” said Edward Alden, a senior fellow at the Council on Foreign Relations. “The whole purpose of the tariffs was to force China to make structural changes to its economy. But the tariffs have failed to do that. China is prepared to live with the pain rather than make the changes the U.S. wants.”

China Hits Back at Trump by Weakening Yuan, Halting Crop Imports

China responded to Donald Trump’s tariff threat with another escalation of the trade war on Monday, letting the yuan tumble to the weakest level in more than a decade and asking state-owned companies to suspend imports of U.S. agricultural products. (…)

In a rare statement, the central bank attributed the yuan move to protectionism and expectations of additional tariffs on Chinese goods, while saying it can still maintain a steady currency.

By linking today’s devaluation with the renewed tariff threat, the PBOC “has effectively weaponized the exchange rate,” said Julian Evans-Pritchard at Capital Economics in Singapore. “The fact that they have now stopped defending 7 against the dollar suggests that they have all but abandoned hopes for a trade deal.” (…)

Tweetless way of ending the trade conversations…

Powell’s Off-the-Cuff Approach Leaves Investors on Edge The highly uncertain U.S. economic outlook is complicating Federal Reserve Chairman Jerome Powell’s effort to bring a more plain-spoken style to communicating with the public.

(…) Before last week’s Fed meeting, officials had argued that lower rates were needed to immunize the economy against the effects of slower global growth and trade uncertainty and to boost low inflation.

That left many market participants expecting a rate cut and an open door to more reductions over coming months.

So some investors were jarred when Mr. Powell described the quarter-percentage-point cut in the Fed’s benchmark rate as a more technical “mid-cycle adjustment,” leaving them to wonder if he was ruling out more reductions. (…)

Punch “The Fed keeps overconfidently predicting the future of an unpredictable economy,” said Lawrence Summers, who served as Treasury secretary under President Clinton. “More communication given the inevitable errors means less credibility as the Fed runs from one side of the boat to the other.” (…)

Higher Prices Drive Sales for Restaurants, Food Makers McDonald’s, Mondelez and Chipotle are among companies charging more; ‘U.S. consumer continues to be strong’

(…) The restaurants subset of the S&P 500 has risen 32.2% this year through Friday, while the broader index has gained 17%. (…) “We are seeing no resistance,” to the higher prices, Chipotle’s Chief Financial Officer Jack Hartung said in an interview last month. (…)

Prices at McDonald’s restaurants in the U.S. have risen by about 2% on average in each of the past several quarters, helping to push up sales overall as guest counts have fallen. (…)

High five TDn2K’s July 11 Restaurant Industry Snapshot

The restaurant industry experienced a summertime slowdown, with comp sales down -0.01 percent in June [and comp traffic down 3.1% with only 55% of markets posting positive sales compared to 78% in May]. As long as traffic counts continue to suffer, sustained sales growth is unlikely for restaurants. Relying on menu price increases will not keep the industry afloat for long, especially as chains keep adding new units, giving guests more dining options.

Brands that post positive sales results tend to have higher to-go sales than the rest of the industry, signaling an opportunity for restaurants. The trend of consumers shifting preferences toward off-premise dining does not appear to be going away.

TECHNICALS WATCH

Lowry’s Research says that “In the intermediate term, the balance of Supply and Demand, as represented by Lowry’s Selling Pressure and Buying Power Indexes, remains positive, with Demand dominant to Supply.  However, the short-term trends of each measure are showing some degradation.” Degradation very close to a crossing point. “A signal in the next few weeks would be a sign of short-term weakness and caution, but based on the probabilities, would not signal calling for all out defensive measures.”

For now, a retreat back to its 200-dma (2787) would set the S&P 500 Index back 4.8%.

EARNINGS WATCH

Can earnings support this weak market? Refinitiv provides the facts:

Through August 2, 380 companies in the S&P 500 Index have reported earnings for Q2 2019. Of these companies, 73.9% reported earnings above analyst expectations and 18.2% reported earnings below analyst expectations. In a typical quarter (since 1994), 65% of companies beat estimates and 20% miss estimates. Over the past four quarters, 76% of companies beat the estimates and 18% missed estimates.

In aggregate, companies are reporting earnings that are 6.0% above estimates, which compares to a long-term (since 1994) average surprise factor of 3.3% and the average surprise factor over the prior four quarters of 5.3%.

Of these companies, 59.0% reported revenues above analyst expectations and 41.0% reported revenues below analyst expectations. In a typical quarter (since 2002), 60% of companies beat estimates and 40% miss estimates. Over the past four quarters, 63% of companies beat the estimates and 37% missed estimates.

In aggregate, companies are reporting revenues that are 1.0% above estimates, which compares to a long-term (since 2002) average surprise factor of 1.5% and the average surprise factor over the prior four quarters of 1.0%.

The estimated earnings growth rate for the S&P 500 for 19Q2 is 2.7%. If the energy sector is excluded, the growth rate improves to 3.4%. The estimated earnings growth rate for the S&P 500 for 19Q3 is -0.7%. If the energy sector is excluded, the growth rate improves to 0.6%.

The estimated revenue growth rate for the S&P 500 for 19Q2 is 4.5%. If the energy sector is excluded, the growth rate improves to 4.9%.

These better results have prompted analysts to revise their estimates upward, at least for large caps:

imageimage

Preannouncements for Q3 are better than they were at the same stage during Q2. However, let’s hear from consumer-centric and technology reporters which comprise 31% and 19% of remaining S&P 500 companies to report. These groups’ earnings growth rates are sub-par so far in Q2.

image

Trailing EPS climbed slightly above their end of June level at $164.17 which is 2.3% above their level at the December low on the S&P 500. At the same Rule of 20 P/E of 16.83, the S&P would be 2418. At today’s pre-opening of 2890, the Rule of 20 P/E is 19.7.

image

THE DAILY EDGE: 2 AUGUST 2019

Before covering what politicians and central bankers say and do, let’s cover the facts emanating from the real world:

U.S. Employers Added 164,000 Jobs in July, Wages Picked Up

Payrolls rose 164,000, almost matching projections, though the two prior months were revised lower, according to a Labor Department report Friday. Revisions subtracted 41,000 jobs from the prior two months. The June figure was lowered from 224,000 to a less-eye-popping 193,000. The jobless rate held at 3.7%, near a half-century low, while average hourly earnings climbed 3.2% from a year earlier, better than forecast. Despite July’s healthy payrolls figure, the three-month average increase of 140,000 was the slowest in almost two years. (…)

U.S. economy added 164,000 workers in July as jobless rate held steady

Average hourly earnings rose 0.3% from the prior month, above estimates, following an upwardly revised 0.3% gain. (…)

U.S. Light Vehicle Sales Fall Again

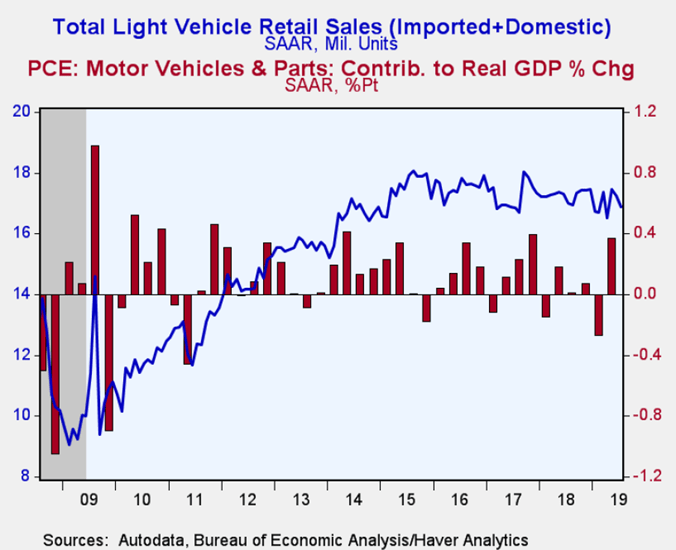
The Autodata Corporation reported that sales of light vehicles during July declined 2.0% (-0.7% y/y) to 16.89 million units (SAAR). The decline added to a 1.3% June shortfall and left sales at the lowest level since April. Earlier sales data were revised slightly.

Sales of light truck sales eased 0.8% last month (+4.1% y/y) to 12.05 million units. (…) Trucks’ share of the U.S. light vehicle market increased to a record 71.3%, up from a low of 48.8% during all of 2012.

Pointing up Imported truck sales have roughly doubled in the past four years.
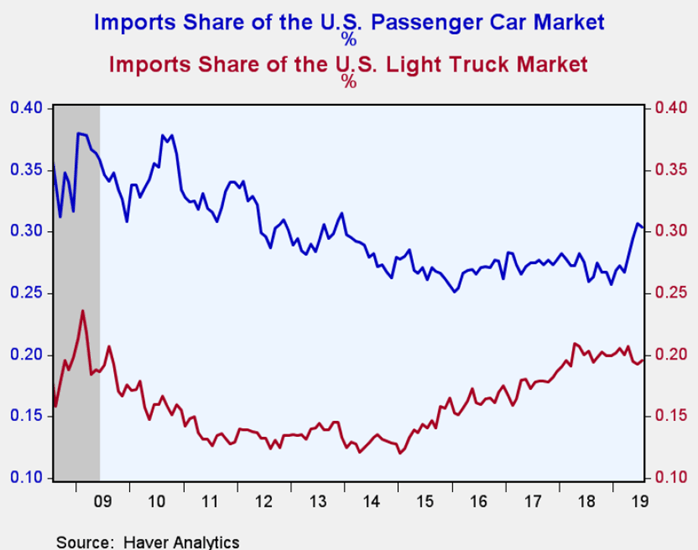
Imports’ share of the U.S. vehicle market rose slightly to 22.7% and has been trending upward since 2015. Imports’ share of the passenger car market remained high at 30.4%, up roughly five percentage points since the end of last year. Imports share of the light truck market eased to 19.6%, but remained up from the 12.1% low in April 2014. (…)

 image image

The chart on the right, or the one below, are likely to be features of the next presidential campaign…

image
U.S. Construction Spending Unexpectedly Weakens

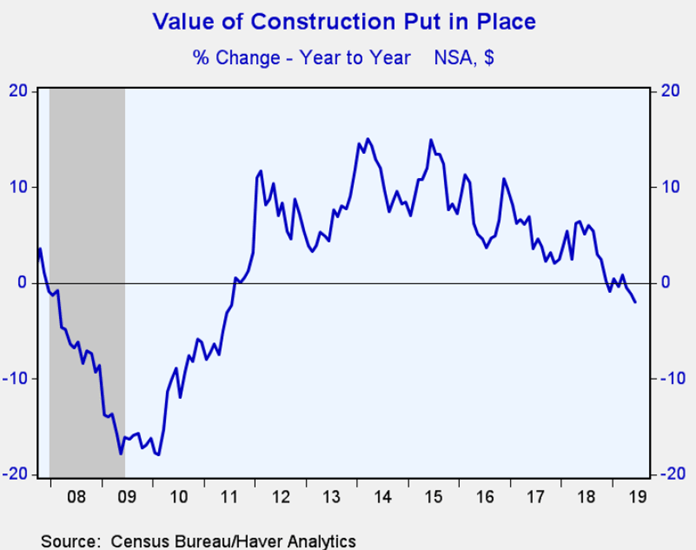
Building sector activity continues to weaken. The value of construction put-in-place fell 1.3% (-2.0% y/y) during June following a 0.5% May decline, revised from -0.8.

Construction activity in the private sector fell 0.4% (-4.6% y/y), down for the fourth straight month. Residential construction declined 0.5% (-7.3% y/y), continuing a slide that began last year. The value of home improvements declined 0.5% (-10.2% y/y) and reversed the 0.7% May rise. Single-family building eased 0.7% (-8.5% y/y) and has been trending lower since early last year. Countering these declines was a 0.2% rise (10.1% y/y) in multi-family construction, the value of which was a record high.

Private nonresidential building activity declined 0.3% (-1.1% y/y) during June, down for the third consecutive month. Office construction improved 0.4% (8.9% y/y) while commercial building rose 1.3% (-11.8% y/y). Manufacturing building rose 0.9% (7.8% y/y). Health care construction improved 0.5% (4.8% y/y) but transportation sector building weakened 5.4% (+5.4% y/y). Power construction fell 2.1% (-4.9% y/y).

Public sector building activity declined 3.7% during June (+6.0% y/y) following a 1.2% slump. Construction of highways & streets fell 6.4% (+6.8% y/y). It accounts for roughly one-third of the dollar value of public building activity. Transportation sector building eased 0.3% (+8.5% y/y) while commercial construction rose 2.9% (+17.6% y/y). Health care building declined 3.4% (-11.7% y/y).

image
image

image

MANUFACTURING PMIs

U.S. manufacturing firms signalled only a fractional improvement in business conditions in July, with the headline PMI dropping to its lowest since September 2009. Driving less robust overall growth was a slower increase in production and muted client demand. Although the rate of expansion in new business quickened, it remained historically subdued, with export orders contracting for the second time in the last three months. In line with less robust demand, optimism among manufacturers dipped to a series low. Firms were also more cautious towards hiring, with employment falling for the first time since mid-2013.

Meanwhile, firms raised their factory gate charges at an increased rate despite input cost inflation sliding to the lowest for over two years.

The seasonally adjusted IHS Markit final U.S. Manufacturing Purchasing Managers’ Index™ (PMI™) posted 50.4 in July, broadly in line with 50.6 in June. The latest reading signalled a fractional improvement in the health of the manufacturing sector, but also indicated the slowest overall expansion since the height of the financial crisis in September 2009.

image

Manufacturers reported only a marginal rise in production during July, with the rate of growth easing to the slowest since June 2016. The sustained slowdown was linked by panellists to softer demand conditions compared to earlier in 2019, notably for goods supplied as inputs to other companies.

The rate of new business growth remained muted overall, despite picking up to a three-month high. Less robust demand from domestic and foreign clients was attributed to issues in the automotive sector, the ongoing impact of tariffs and hesitancy in placing orders. The decrease in new export business was the second in the last three months. Muted client demand was reportedly a driving force behind subdued business confidence in July. Output expectations slipped further to a series low (since July 2012) as business conditions are predicted to remain challenging over the coming 12 months, especially for smaller firms.

A reduction in the level of positive sentiment towards the year ahead was also reflected in the first fall in employment since June 2013. A number of firms registered stable workforce numbers during July, with difficulties finding replacement staff weighing on overall workforce numbers. At the same time, backlogs of work were reduced at a modest pace.

On the prices front, firms signalled the slowest rate of input cost inflation for just over two years. Nonetheless, firms continued to increase factory gate charges, with output prices rising at a solid rate that was above the series average despite challenging demand conditions.

Finally, purchasing activity fell for the first time since April 2016 as subdued demand drove further stock depletion. Inventories of inputs and finished goods declined in July.

Chris Williamson, Chief Business Economist at IHS Markit:

US manufacturing has entered into its sharpest downturn since 2009, suggesting the goods-producing sector is on course to act as a significant drag on the economy in the third quarter. The deterioration in the survey’s output index is indicative of manufacturing production declining at an annualised rate in excess of 3%.

Falling business spending at home and declining exports are the main drivers of the downturn, with firms also cutting back on input buying as the outlook grows gloomier. US manufacturers’ expectations of output in the year ahead has sunk to its lowest since comparable data were first available in 2012, with worries focused on the detrimental impact of escalating trade wars, fears of slower economic growth and rising geopolitical worries.

Employment is now also falling for only the second time in almost ten years as factories pull back on hiring amid the growing uncertainty.

More positively, new order inflows picked up for a second successive month. Although remaining worryingly subdued compared to the strong growth seen earlier in the year, the modest improvement will fuel hope that production growth could tick higher in August.

(…) “People aren’t investing,” said Timothy Fiore, chairman of the ISM’s Manufacturing Business Survey Committee in an interview. (…) Of the 18 manufacturing industries, nine reported growth in July. (…)

That compares to 9 in June, 11 in May, 13 in April, and 16 in February and January. Industrial breadth in new orders is also deteriorating faster than the Index suggests:

image

Lastly, falling imports may be an indication of falling domestic demand:

ISM ’s Imports Index registered 47 percent in July, a decrease of 3 percentage points when compared to the 50 percent reported for June, indicating that imports contracted in July after being unchanged in June. “Three of the six big industry sectors contributed to the contraction. The Imports Index reached its lowest level since August 2016, when it registered 46.8 percent,” says Fiore.

The only industry reporting growth in imports during the month of July is Wood Products. (…)

FYI, 11 of the 18 industries reported decreasing imports in July.

  • This chart shows the spread between the ISM orders and inventories (a forward-looking indicator) vs. the ISM composite index. (The Daily Shot)

Source: @Not_Jim_Cramer

The euro area’s manufacturing sector continued to contract during July, and at an accelerated rate. The latest IHS Markit Eurozone Manufacturing PMI® posted below the 50.0 no-change mark that separates growth from contraction for a sixth successive month and, at 46.5, pointed to the sharpest deterioration in operating conditions since December 2012. The index was down from 47.6 in June, though slightly higher than the earlier July flash reading of 46.4.

image

Of the three market groups categories covered by the survey, ongoing contractions were seen in the intermediate and investment goods sectors. For the latter, the deterioration was the greatest since November 2012. In contrast, growth was sustained amongst producers of consumer goods. (…)

Germany remained a source of weakness, with its manufacturing economy recording its sharpest deterioration in operating conditions for seven years. Austria recorded its lowest PMI level in just under five years, whilst there were also below 50.0 readings seen in France, Ireland, Italy and Spain. (…)

The downturn in the overall manufacturing economy was driven in the main by a sharp fall in new orders. Latest data showed that the decline was the second sharpest recorded by the survey in just over six years (surpassed only by a contraction in March) as ongoing trade tensions, difficulties in the automotive industry and political uncertainties continued to weigh on demand both in internal and external markets. Export trade deteriorated to the greatest degree since November 2011, with German manufacturers recording the sharpest reduction (the fastest in over a decade). (…)

With reports of excess supply for some raw materials, input costs faced by manufacturers deteriorated to the greatest degree since April 2016. With costs falling, and market demand deteriorating, euro area manufacturers chose to discount their own charges for the first time in just under three years. (…)

Chris Williamson, Chief Business Economist at IHS Markit:

The Eurozone PMI dashboard is a sea of red, with all lights warning on the deteriorating health of the region’s manufacturers. July saw production and jobs being cut as the fastest rates for over six years as order books continued to decline sharply. Prices fell at the sharpest rate for over three years as firms increasingly competed via discounting to help limit the scale of sales losses.

Forward indicators also deteriorated. Input buying fell to an extent not seen since 2012 as firms prepared for weaker production in the short term, and expectations for the year ahead likewise fell to the lowest in over six-and-a-half years.

The downturn is being led by Germany, reflective of a further worsening conditions in the auto sector and falling global demand for business equipment. However, output is also falling in Italy, France, Spain, Ireland and Austria and is close to stalling in the Netherlands. Greece notably bucked the deteriorating trend.

Rising geopolitical concerns, including trade wars and Brexit, and worries about slower economic growth both domestically and internationally were all widely reported as having subdued current demand and hit confidence in the outlook. The concern is that, while policymakers have become increasingly alarmed at the deteriorating conditions, there may be little that monetary policy can do to address these headwinds.

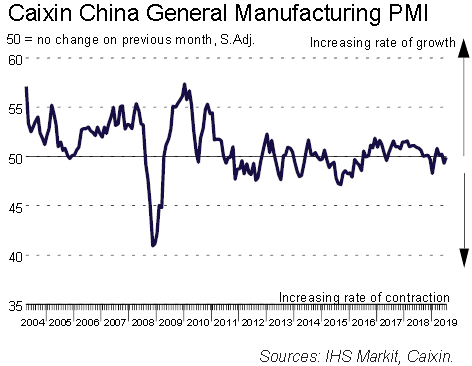
PMI data indicated that operating conditions across China’s manufacturing sector were broadly stable at the start of the third quarter. Output was little-changed following a decline in June amid a slight increase in overall new orders. Subdued demand conditions nonetheless prompted firms to lower their workforce numbers again in July, and at a quicker pace, while inventories of both inputs and finished goods declined. Cost pressures weakened, with input prices rising only slightly while selling prices fell. Encouragingly, business confidence regarding the year ahead outlook for output picked up from June’s record low, but remained subdued over lingering concerns regarding the China-US trade dispute and softer global economic conditions.

At 49.9 in July, the headline seasonally adjusted Purchasing Managers’ Index™ (PMI™) posted only fractionally below the neutral 50.0 level to signal broadly stable conditions across China’s manufacturing sector. This followed a marginal deterioration in the health of the sector during June (PMI reading of 49.4).

image

The improvement in the headline index was partly down to the broad stabilisation of output in July, following a marginal drop in June. Some firms commented that relatively firmer demand conditions had led them to leave production volumes unchanged. Total new orders rose at a fractional pace after a modest decline at the end of the second quarter. The upturn was likely driven by stronger domestic demand, as new export orders were little-changed in July. Some companies commented that the ongoing trade dispute with the US continued to weigh on export sales.

Muted order book trends led companies to reduce their headcounts for the fourth month in a row, and at the quickest pace since February. However, a lack of personnel was cited as a key reason for a further increase in unfinished work. That said, the rate of backlog accumulation remained modest.

Following a reduction in June, buying activity rose slightly at the start of the third quarter. However, manufacturers adopted a cautious approach to inventories in light of relatively soft demand conditions, with inputs of both purchased items and post-production goods falling in July.

Chinese manufacturers indicated that average input costs rose again in July. However, the rate of increase was marginal. At the same time, efforts to stimulate customer demand and boost new order intakes led firms to cut their selling prices for the first time since January.

After slipping to its lowest on record in June, business confidence regarding output for the year ahead improved to a three-month high in July. Optimism was often linked to forecasts of improving market conditions and new products. However, concerns over the outcome of ongoing trade negotiations with the US continued to weigh on overall sentiment.

The headline Jibun Bank Japan Manufacturing Purchasing Managers’ Index™ (PMI)® recorded 49.4 in July, a fractional increase from June (49.3), signalling a third successive monthly deterioration in the manufacturing business environment. (…)

image

Japanese manufacturers cut output for the seventh consecutive month amid soft demand from domestic and overseas clients. While slowing global growth in key export markets such as China and spillover effects from global trade spats remain a principal concern to companies, the risk now of Japan-South Korea relations deteriorating further merely adds to the already-strong headwinds.

Forward-looking survey indicators suggest that manufacturers in Japan are set for another difficult quarter, as firms scaled down stocks and input purchasing to keep a lid on costs.

Furthermore, more signs that the manufacturing downturn has now become deeply rooted was apparent in prices data, as output charges were reduced at the fastest pace in nearly three years amid increasing efforts to stimulate sluggish demand.

The downturn in the global manufacturing sector extended into its third consecutive month in July. Production and new order intakes declined further, as conditions in many domestic markets remained soft and international trade volumes continued to contract. These negative trends filtered through to the labour market, resulting in another round of job losses.

At 49.3 in July, a tick below June’s reading of 49.4, the J.P.Morgan Global Manufacturing PMI™ – a composite index1 produced by J.P.Morgan and IHS Markit in association with ISM and IFPSM – signalled contraction for the third straight month and fell to its lowest level since October 2012.

Of the 30 nations for which July data were available, 19 had Manufacturing PMIs signalling downturns. China, Japan, Germany, South Korea, Taiwan, France, the UK, Italy and Brazil were among the countries seeing contractions. Although the US and Canada saw expansions, their respective PMI levels (50.4 and 50.2) were only marginally above the neutral 50.0 mark.

Sector data indicated that the downturn was again focussed on the intermediate and investment goods industries. In contrast, the consumer goods category not only continued to register expansion, but also saw a mild improvement in its rate of growth to a three-month high. (…)

Price inflationary pressure remained contained in the global manufacturing sector in July. Input costs rose only slightly and to the weakest extent during the current 40-month sequence of increase. Average selling prices were unchanged over the month, the first time that output charges have not risen in almost three years.

image

  • Here is the percentage of the world’s economies with contracting manufacturing sectors (PMI < 50). (The Daily Shot)

Source: @MichaelKantro

Trump Warns of New China Levies

The new tariffs would take effect Sept. 1 and cover $300 billion in Chinese goods—including smartphones, apparel, toys and other consumer products. They would come on top of tariffs already imposed on $250 billion in imports from China.

“If they don’t want to trade with us anymore, that would be fine with me,” Mr. Trump said at the White House.

According to a person familiar with the situation, the tariff hike was opposed by U.S. Trade Representative Robert Lighthizer, Treasury Secretary Steven Mnuchin, White House economic adviser Lawrence Kudlow and national security adviser John Bolton. But Mr. Trump was adamant in pushing the increase and was supported by White House adviser Peter Navarro, this person said. (…)

Wall Street was rattled by the news, with the Dow Jones Industrial Average erasing a rebound of more than 300 points. The index closed down 281 points, or 1.1% lower. The S&P 500 slid 0.9% and the technology-heavy Nasdaq Composite lost 0.8%. Oil prices sank almost 8%, their biggest drop since February 2015. (…)

Mr. Trump said that senior officials still planned to resume high-level discussions as scheduled next month, and he expressed his interest in reaching “a comprehensive Trade Deal” with China.

But Mr. Trump chided President Xi Jinping of China for not following through on what the Trump administration views as prior commitments. “China agreed to…buy agricultural products from the U.S. in large quantities, but did not do so,” he wrote on Twitter. “Additionally, my friend President Xi said that he would stop the sale of Fentanyl to the United States—this never happened, and many Americans continue to die.” (…)

Hasbro Inc. has notified retailers that it plans to raise prices on any toys hit by tariffs and it also expects that retailers will take ownership of inventory in the U.S. instead of China, which will add to the toy maker’s shipping and warehousing costs, according to Chief Financial Officer Deborah Thomas. (…)

  • This next round will have the most impact on consumer goods. (The Daily Shot)

Source: Desjardins

China Pledges to Counter Trump’s Threat of More U.S. Tariffs Beijing pledged to respond if the U.S. insists on adding extra tariffs.
Japan Ratchets Up Trade Dispute With South Korea Japan removed South Korea from a list of preferential trading partners, escalating tensions between two U.S. allies whose companies together supply key components used by U.S. technology companies such as Apple and Amazon.

South Korea retaliated hours later, saying it would remove Japan from its own preferred trade list and take measures that could affect Japan’s tourism and food sectors.

Tokyo early last month tightened controls on exports of three materials used by some of South Korea’s biggest companies, such as Samsung Electronics Co. Friday’s additional steps, taking effect Aug. 28, will wrap more red tape around the export to South Korea of hundreds of Japanese products, including machine tools and electronic parts.

In a televised speech, South Korean President Moon Jae-in accused Japan of “a selfish act that harms the global economy.” (…)

The tighter controls implemented in July on the three materials—fluorinated polyimide, photoresist and hydrogen fluoride—have delayed shipments, people familiar with the matter said.

Such delays can ripple through the supply chain and affect delivery of tech products such as Apple’s iPhones and data servers used by Amazon’s cloud-computing service. (…)

Mr. Seko said Tokyo’s actions aren’t direct retaliation for disputes with South Korea over wartime reparations. He cited national-security concerns about South Korea’s handling of the Japanese products. But Japanese officials said a broad breakdown of trust between the two countries triggered by historical disputes was a backdrop to the trade actions. (…)

The U.S. has begun attempts to mediate between Japan and South Korea. Secretary of State Mike Pompeo is set to meet with the two countries’ foreign ministers in Bangkok later Friday.

On Thursday, South Korean Foreign Minister Kang Kyung-wha alluded to the possibility of ending an agreement between the two countries to share military intelligence. “Japan has cited security reasons for its trade restriction measures,” she said. “We have no choice but to consider this issue through a security framework.”

If it were not so serious, it would be really funny! The U.S., which designed the conflict template and unilaterally withdrew from the Trans-Pacific Partnership, is now playing mediator.

EARNINGS WATCH

We now have 355 reports in (Wednesday night). The beat rate is 74%, the surprise factor is +6.1% and broad and the blended growth rate is +2.5%, up from +0.3% on July 1. Trailing EPS were $163.94 to close the month, a touch below June’s $163.99.

The Rule of 20 P/E is back to 20.0 this morning (2928), right on Fair Value.

Sad smile US teens have less face time with their friends – and are lonelier than ever

(…) my co-authors and I examined trends in how 8.2 million U.S. teensspent time with their friends since the 1970s. It turns out that today’s teens are socializing with friends in fundamentally different ways – and also happen to be the loneliest generation on record.

(…) although the amount of time teens spent with their friends face to face has declined since the 1970s, the drop accelerated after 2010 – just as smartphones use started to grow.

Compared with teenagers in previous decades, iGen teens are less likely to get together with their friends. They’re also less likely to go to parties, go out with friends, date, ride in cars for fun, go to shopping malls or go to the movies.

It’s not because they are spending more time on work, homework or extracurricular activities. Today’s teens hold fewer paid jobs, homework time is either unchanged or down since the 1990s, and time spent on extracurricular activities is about the same.

Yet they’re spending less time with their friends in person – and by large margins. In the late 1970s, 52 percent of 12th-graders got together with their friends almost every day. By 2017, only 28 percent did. The drop was especially pronounced after 2010. (…)

Sure enough, just as the drop in face-to-face time accelerated after 2010, teens’ feelings of loneliness shot upward.

Among 12th graders, 39 percent said they often felt lonely in 2017, up from 26 percent in 2012. Thirty-eight percent said they often felt left out in 2017, up from 30 percent in 2012. In both cases, the 2017 numbers were all-time highs since the questions were first asked in 1977, with loneliness declining among teens before suddenly increasing.

(…) So the decline in face-to-face interaction among teens isn’t just an individual issue; it’s a generational one. Even teens who eschew social media are affected: Who will hang out with them when most of their peers are alone in their bedrooms scrolling through Instagram?

Higher levels of loneliness are just the tip of the iceberg. Rates of depression and unhappiness also skyrocketed among teens after 2012, perhaps because spending more time with screens and less time with friends isn’t the best formula for mental health. (…)

HOWARD MARKS’ LATEST MEMO

If you missed it yesterday when the link was not working (Thanks Joe):

Great read: Howard Marks: On the Other Hand