The enemy of knowledge is not ignorance, it’s the illusion of knowledge (Stephen Hawking)

It ain’t what you don’t know that gets you into trouble. It’s what you know for sure that just ain’t so (Mark Twain)

Invest with smart knowledge and objective odds

THE DAILY EDGE: 3 JUNE 2019

THE PMIs
Eurozone: Manufacturing economy continues to contract in May

The eurozone’s manufacturing economy remained entrenched inside contraction territory during May. After accounting for seasonal factors, the IHS Markit Eurozone Manufacturing PMI® posted below the crucial 50.0 no-change mark for a fourth successive month, recording a level of 47.7 (unchanged from the earlier flash reading). That was slightly down on the previous month’s 47.9 and close to March’s near six year low.

image

According to market group data, weakness remained centred on the intermediate and investment goods sectors. In both instances, rates of deterioration were again marked and contrasted noticeably with the performance of the consumer goods category, where growth was sustained to a modest degree. The consumer goods sector has now registered continuous expansion for five-and-a-half years.

imageBy nation, Germany continued to endure the sharpest deterioration in manufacturing operating conditions, with its respective PMI again signalling a marked rate of contraction. Austria saw the health of its manufacturing economy deteriorate to the greatest degree for over four years. Italy’s PMI also remained below 50.0, albeit only slightly. Only marginal growth was seen in France and Spain. (…)

Underperformance of the region’s manufacturing sector continued to be closely linked to deteriorating order books. Latest data showed an eighth successive monthly fall in new work received. Panellists reported falling demand both at home and abroad – as highlighted by another solid (albeit slower) fall in new export orders during May.

The latest downturn in new work inevitably continued to weigh on production, which was reported to be down in May for a fourth successive month. However, with the rate of contraction remaining modest, and slower than that of new work, firms were again able to make notable inroads into their backlogs. May’s survey signalled a ninth successive
monthly fall in work outstanding.

The ongoing emergence of excess productive capacity weighed on employment. After 56 months of continuous expansion, a net fall in payroll numbers was recorded in May. The marginal contraction was primarily centred on Germany, where job losses were signalled for a third successive month, although Spain also recorded a fall in staffing numbers. Growth of employment elsewhere tended to be marginal except for Greece, where a robust gain in jobs was again registered.

There was further evidence of emerging slack in supply chains during May, as average lead times for the delivery of inputs shortened to the greatest degree since mid-2009. Lead times have now improved for three months in a row, in line with falling purchasing activity amongst manufacturers. May’s survey showed that input buying was down for a sixth successive month as firms focussed on utilising existing stock wherever possible.

On the price front, input cost inflation softened in May, falling to its lowest level since August 2016. Firms chose to pass on these higher operating expenses to clients as highlighted by a similarly modest increase in output charges.

Finally, business confidence improved to a three month high in May, though nonetheless remained well down on its long-term average. Moreover, outright pessimism was seen in Austria and Germany, whilst France and Spain registered a lower degree of confidence compared to April. In contrast, Italy enjoyed a markedly higher level of optimism.

China: Operating conditions improve marginally

Chinese manufacturing firms signalled a further slight improvement in overall operating conditions during May. Total new work rose at a faster pace, supported by a renewed increase in export sales, while production was broadly stable. As a result, backlogs of work continued to expand, though firms retained a relatively cautious approach to staffing levels. Inflationary pressures remained subdued, with input costs rising only slightly while output charges were unchanged from the previous month. However, business confidence regarding the year ahead softened midway through the second quarter.

The headline seasonally adjusted Purchasing Managers’ Index™ (PMI™) registered 50.2 in May, unchanged from the previous month, to signal a further marginal improvement in the health of China’s manufacturing sector. The headline PMI has now posted above the neutral 50.0 level in each of the past three months.

image

Underpinning the positive PMI figure was a further increase in total new orders placed with Chinese goods producers. The rate of new business growth quickened slightly since April, supported by a renewed increase in new export sales. According to panellists, new product releases and firmer foreign demand supported the expansion.

The subindex for new orders edged higher, and the gauge for new export orders moved back above 50 to the same level as in January, which was the best reading since March 2018. The improvements in both indices signals stable domestic and overseas demand.

Production at Chinese manufacturers was meanwhile stable in May, following a slight increase in the previous month.

The stronger rise in overall new business supported a renewed expansion in buying activity among Chinese manufacturing firms. Though only slight, it was the first time that purchasing activity had increased for five months. Inventories of inputs were broadly stable for the second month in a row. Meanwhile, greater usage of current stocks to fulfil new business reportedly underpinned a further decline in inventories of finished goods.

Companies retained a relatively cautious approach towards employment, noting a slight decline in staffing levels for the second successive month.

Higher new orders placed further pressure on capacity, as shown by an increase in backlogs of work during May. That said, the rate of accumulation remained marginal. Capacity pressures were also apparent at suppliers, with manufacturers noting longer lead times for purchased items for the fifth month in a row.

May data signalled only a marginal increase in average input costs faced by Chinese manufacturers. The rate of inflation remained notably softer than those seen this time last year. Factory gate prices were meanwhile unchanged from the previous month, with a number of firms commenting on competitive market pressures.

Business confidence slipped to the lowest level since the series began in April 2012 in May amid concerns of an escalating China-US trade war and forecasts of relatively subdued global demand.

Japan: Output continues to fall amid weak demand

The headline Nikkei Japan Manufacturing Purchasing Managers’ IndexTM (PMI)® edged lower to 49.8 in May, from 50.2 during April. While there was little movement in the main output and new order components, the fall to the employment sub-index was the main factor contributing to the month-on-month dip in the PMI.

image

(…) A softer rise in workforce numbers came amid lower output requirements, with new order intakes dipping for the fifth straight month in May. The decline was slightly weaker than in April, however. Makers of both capital and intermediate goods saw drops to sales, while consumer goods producers reported an expansion in demand. Panellists indicated that the downturn in new orders had been a reflection of weakness both domestically and overseas. New export business fell for the sixth consecutive month in May, which firms attributed to challenging economic conditions at key trading partners such as China, as well as greater competition internationally.

With appetite for Japanese goods dwindling, firms trimmed their inventory levels and scaled back buying purchasing activity. Stocks of both finished goods and inputs declined in May. Post-production holdings were reduced at the fastest pace since January, while input stocks were cut for the sixth time in seven months.

Despite lower quantity of purchases at Japanese manufacturers, supply chain pressures were maintained in May, with delivery times lengthening. According to panellists, stock shortages at vendors drove the deterioration in supplier efficiency. There were reports from some firms that suppliers had raised charges during May, contributing to another monthly increase in operating costs.

Although the rise was solid overall, it was little changed from April’s 20-month low. Output charges were subsequently lifted, albeit modestly, as firms sought to share part of the burden with clients.

Lastly, having shown signs of a slight recovery in April, future output expectations turned pessimistic in May for the first time since November 2012, amid concern towards heightened trade tensions between the US and China, as well as the planned sales tax hike later this year.

The U.S. PMI will be released this morning and posted tomorrow. In the meantime:

(Ostrum Asset Management)

Factories Stall on Strong Dollar, Trade Tensions U.S. manufacturers are having a hard time mounting an encore to last year’s strong performance. Factories are on track for their weakest showing this year since 2016.

(…) Manufacturing accounts for 11% of U.S. gross domestic product, according to the Bureau of Economic Analysis, down from 16% two decades ago. Its strong growth last year helped total GDP rise by 2.9%. Factory activity remains an important barometer for trends in employment and technology adoption as well as for broader economic demand.

Right now, that measure is flashing signs of trouble ahead. (…)

U.S. companies with overseas operations are facing slower sales growth and a resurgent U.S. dollar, which further weakens their foreign sales and profit. The dollar has appreciated 9.3% against a basket of major foreign currencies since January 2018. (…)

At the same time, U.S. manufacturers face higher costs for many components and metals because of U.S. tariffs on goods from China. Beijing’s retaliatory tariffs on U.S. farm products, meanwhile, have slashed U.S. exports to China and weighed on sales of farm machinery. Deere & Co. said on May 17 it would cut production in the second half of its current fiscal year by 20% compared with that period last year. (…)

April Consumer Spending Remains Solid U.S. households spent at a slower but still solid pace in April, suggesting consumers can help extend an already decadelong expansion amid signs economic momentum is easing.

Personal-consumption expenditures, a measure of household spending on everything from carpet cleaning to computers, increased a seasonally adjusted 0.3% in April from March, the Commerce Department said Friday. That came on the heels of March’s boom, the best monthly increase since 2009.

Income growth is one factor driving that spending. Americans’ pretax earnings from wages, salaries and investments advanced 0.5% in April from the prior month. That was the best gain this year.

Both figures were better than economists had expected. (…)

From a year earlier, spending rose 4.3% in April, the Commerce data showed. (…)

The price index for personal-consumption expenditures rose 0.3% in April from the prior month and increased 1.5% from a year earlier. Excluding volatile food and energy costs, prices were up 0.2% on the month and rose 1.6% from a year earlier. (…)

But the cost of goods declined 0.5% from a year earlier because Americans are paying less for products such as televisions, home furnishings, clothing and toys. That suggests that while trade disputes have roiled financial markets, the average shopper has yet to see much of an impact. (…)

Wow! On such an important stat, the WSJ focused on nominal rather than real data.

Real Disposable Income is essentially flat YtD. Real expenditures are up 3.6% annualized YtD but only 1.4% including the important month of December. The only positive way to read real PCE is to look at Dec-Feb down 0.3% and hope there is a true change in momentum with Mar-Apr being up 0.9%.

But real income is flat, in spite of very quiet inflation and strong labor income. From these stats, labor compensation is rising 4.2% annualized YtD, up from 2.1% during the previous 4 months.

image
image

Importantly, core PCE inflation was actually +0.246% MoM in April, a huge jump from +0.038% on average in Q1 and +0.17% in Q4’18. Durable Goods inflation remains negative in spite of tariffs but Services prices are accelerating rapidly, perhaps because service providers are now passing on higher labor costs. Were tariffs to start to impact retail prices, total inflation could be jump beyond the FOMC’s dreams…

image

On the other hand, market-based core PCE inflation, a supplemental measure that is based on actual household cash outlays, remains muted at +1.3% annualized since September 2018, +1.2% YtD and +0.8% in the last 3 months.

The Dallas Fed said Friday that its Trimmed-Mean PCE tool, which seeks to uncover the trend of price pressures, moved to a reading of 2% in April, from 1.9% the month before.

The measure relies on the data from the government’s personal-consumption expenditures price index, released earlier Friday. Those numbers showed another big shortfall relative to the Fed’s official inflation goal: The overall April index was up by 1.5% from the same month in 2018, while the core measure, which strips out food and energy costs, gained 1.6% over the same period. (…)

Pointing up The Trimmed-Mean PCE is billed as a more modernized way to measure price pressures, whereas core measurements are a blunt tool. In throwing out food and energy costs, the latter exclude some of the most important prices households face in a given month. The Trimmed-Mean deals with volatility by removing the biggest price risers and decliners in a given month, regardless of what those are.

In a blog post on Tuesday, Dallas Fed economists Jim Dolmas and Evan Koenig wrote that the bank’s index “provides better real-time signals of the trend in all-items (headline) inflation than does the usual ex-food-and-energy measure.” (…)

The Trimmed-Mean tool is “highly correlated with where inflation is the following year,” Mr. Williams said, “and I think it’s just a nice way of scientifically trying to remove the volatile components” to assess the inflation outlook in real time.

I don’t see much science in a trimmed-mean measure of anything. It’s just another way to control volatility in a data series. Forty years of data show that trimmed-mean PCE inflation was 0.5-1.0% lower than core PCE inflation during the first 15 years, 0.5-1.0% higher during the next 15 years and –0.5 to +0.5% around it during the last 10 years with nothing really explaining these trends and whether they are there to stay.

image

Core CPI was introduced in the early 1970s after OPEC made oil prices very volatile. From the San Fran Fed in 2004:

To understand why the categories of food and energy are more sensitive to price changes, consider environmental factors that can ravage a year’s crops, or fluctuations in the oil supply from the OPEC cartel. Each is an example of a supply shock that may affect the prices for that product. However, although the prices of those goods may frequently increase or decrease at rapid rates, the price disturbances may not be related to a trend change in the economy’s overall price level. Instead, changes in food and energy prices often are more likely related to temporary factors that may reverse themselves later. (…)

Therefore, the changes in energy [and food] prices are not necessarily a sign of inflation and, when they are included, can distort a trend increase in general prices. By measuring core inflation, economists are attempting to isolate what is happening to general prices without distraction from spikes in volatile energy prices. (…)

If economists were to look only at measures of inflation that include expenditures on food and energy, which would include their more-sensitive price fluctuations, they may be fooled into believing that general prices are rising or falling more rapidly than they really are. An additional argument for excluding changes in food and energy prices from measures of inflation is that, “although these prices have substantial effects on the overall index, they often are quickly reversed and so do not require a monetary policy response.” (Motley, 1997)

Having said this, measures of inflation that do incorporate food and energy prices are still useful in many circumstances and are closely followed by economists for clues to the behavior of the overall price level. For example, economists may view the sensitive nature of food and energy prices as a symptom of future overall price increases. “A rise in aggregate demand that might set off a period of higher inflation may initially show up in increases in certain sensitive prices that are set in more competitive markets. If these prices are ignored because they are ‘volatile,’ these early signals of inflation may be missed.” (Motley, 1997).

Determining when to use a core inflation measure versus an overall inflation measure can be a very complicated question.

The Dallas Fed justifies using the trimmed-mean series:

Identifying unwanted volatility with food and energy will end up throwing out some signals (less-volatile food and energy items) and allow some noise (more-volatile nonfood, nonenergy items). The trimmed mean addresses this deficiency by excluding the most extreme price changes each month, regardless of an item’s identity.

But the objective is not to remove volatility, it is to remove volatility that has little to do with basic economic and competitive behavior in order to get a reasonable assessment of the basic and sustainable trends in inflation. Removing changes in food prices because of sudden and temporary crop issues or removing oil price swings because of geopolitical situations makes sense from a monetary policy setting point of view. Everybody knows that world food and oil supply/demand dynamics will eventually reverse. Removing price cuts in cellular wireless services because of competitive behavior makes much less sense, even less so if it results in letting in temporary swings in food or energy prices.

CHAOS

Excerpts from weekend editorials:

The biggest economic risk of a Donald Trump Presidency has always been that his trade obsessions would swamp the benefits of tax reform and deregulation. For two years he has kept his worst protectionist impulses mostly in check, but as he seeks a second term we are now seeing Tariff Man unchained. Where he stops nobody knows, which is bad for the economy and perhaps his own re-election. (…)

The risk is that Mr. Trump has come to view tariffs as a blunt-force tool to achieve any diplomatic goal. They are Mr. Trump’s magic elixir that will solve any political ailment. Like Barack Obama’s willy-nilly regulation, tariffs can thus pop up at any time for any reason. No supply chain is safe from Tariff Man.

There’s also the matter of this President’s credibility around the world. Only months ago Mr. Trump signed a new trade pact with Mexico and Canada to replace Nafta. The deal reassured financial markets. But now he whacks Mexico with unilateral tariffs that violate Nafta and World Trade Organization (WTO) rules. Other national leaders can be forgiven for concluding that any trade deal with Mr. Trump is subject to revision on his personal political whim.

The tariffs could also complicate passage of the new U.S.-Mexico-Canada deal in Congress. Mr. Trump is invoking a 1977 statute—the International Emergency Economic Powers Act—to impose the tariffs after declaring an emergency. The Congressional Research Service says the law has never been invoked for tariffs. “This is a misuse of presidential tariff authority and counter to congressional intent,” Senate Finance Chairman Chuck Grassley said Friday.

If the tariffs are imposed, the economic damage could be considerable. (…)

The best scenario is that this tariff threat is Mr. Trump’s familiar bluster in which he threatens chaos to get attention and then backs down. The Mexican reaction has been conciliatory, a good sign. Stock markets fell only about 1.4%, which suggests investors also think Mr. Trump will walk back from the ledge.

But then Tariff Man is impulsive and often his own worst enemy. Equities have fallen for six straight weeks and corporate profits are down. The job market is strong, but that isn’t guaranteed if investment starts to lag. Senate Republicans need to get off their sedan chairs and send this President a message on trade, or they may be in the minority in 2021.

  • Bloomberg: Stop Trump on Trade Congress should rein in the president’s trade-policy powers before it’s too late.

(…) But more is at stake here than control of the border. From the start, Trump’s failure to understand that trade is a matter of mutual advantage, combined with his contempt for international rules and norms, has threatened the global economic order that the U.S. designed and built. This latest decision suggests that Trump’s willingness to gamble with the country’s prosperity, and that of one-time friends and allies, is greater than previously supposed.

The prospects for global trade and output were already uncertain. Now, Trump is risking not just a slow and steady reduction in investment thanks to heightened anxiety over trade, but a sudden collapse in confidence that could roil financial markets and bring on an outright recession. It’s increasingly urgent that Congress curb this president’s ability to conduct a potentially ruinous trade policy.

(…) The industry has long argued that its reliance on Mexican factories for labor-intensive production of some parts allows companies to keep assembly plants in the United States. Tariffs threaten to disrupt that symbiosis, which could push production overseas.

Similarly, vehicles assembled in Mexico are full of American parts. By one recent estimate, American parts make up 38 percent of the value of the average vehicle imported to the United States from Mexico. Mr. Trump’s tariff is a threat to that line of business, too. (…)

Which also means that the U.S. is going to tax its own goods.

China, Mexico Signal Willingness to Step Up Talks With U.S. China and Mexico both signaled a willingness to negotiate with Washington over escalating trade issues, while the Trump administration defended its use of tariffs to gain concessions from trading partners.

Beijing released on Sunday a government policy paper on trade issues, accusing Washington of scuttling the negotiations, which broke down in all but name in May. It said the Trump administration’s “America First” program and use of tariffs are harming the global economy and that China wouldn’t shy away from a trade war if need be. But throughout the document and at a briefing, the government suggested a willingness to return to negotiations.

“We’re willing to adopt a cooperative approach to find a solution,” Vice Commerce Secretary Wang Shouwen said in Beijing on Sunday.

Mexico, meanwhile, rushed a delegation to the U.S. to discuss immigration issues, following the Trump administration’s threat last week to impose tariffs on all Mexican goods entering the U.S. if the Mexican government fails to take aggressive measures to stem the flow of immigrants through Mexico and into the U.S. (…)

The policy paper released in China over the weekend reiterated three preconditions for a trade deal: that the U.S. must remove “all additional tariffs” levied on Chinese exports, that Chinese purchases of U.S. goods to help reduce the U.S. trade deficit “should be realistic,” and that the text of a final agreement should be “balanced.” (…)

“Both sides need to make concessions,” said Mr. Wang, one of China’s negotiators with the U.S. “The concessions can’t all be from one side.”

Trump Ends India’s Trade Designation as a Developing Nation

President Donald Trump terminated India’s designation as a developing nation under a trade program, eliminating an exception that allowed the country to export nearly 2,000 products to the U.S. duty-free.

“I have determined that India has not assured the United States that India will provide equitable and reasonable access to its markets,” Trump said in a proclamation on Friday evening. “Accordingly, it is appropriate to terminate India’s designation as a beneficiary developing country effective June 5, 2019.” (…)

In May, Trump announced that he was ending Turkey’s preferential trade treatment. Turkey was the fifth-largest beneficiary of the program — which allowed some Turkish exporters to sell products in the U.S. duty free — in 2017 with $1.7 billion in covered imports to the U.S. and India was the largest with $5.7 billion, according to a Research Service report issued in January. (…)

China Launches Investigation Into FedEx in Trade War Escalation
TECHNICALS WATCH

Lowry’s Supply/Demand gauges crossed last wek with Supply taking over. Lowry’s says that it is “normal” for Supply to rise and Demand to fall during a market decline, “so the relevant rise in Supply and fall in Demand (to the market’s Apr. 30th high) can be classified as short-term in nature and, as such, consistent with a short-term rather than major market top.”

However, Lowry’s is comforted by the fact that “there is little clear evidence of deteriorating breadth as the peak percentages have been relatively equal over the past few months. Lacking evidence of a major top, the probabilities are that the current market decline represents a correction in ongoing intermediate-term and primary uptrends. (…) the probabilities appear high that the current pullback should be short of the 10% threshold.”

From my lens, all I am seeing is sharply declining investor (and corporate) confidence amid the Trump chaos, with nothing but hope that things will get settled soon enough to preclude a major economic fallout.

The SPY has dropped below its now declining 200-d m.a., always a dangerous condition. Same with Nasdaq and the broad Wilshire 5000.

EARNINGS WATCH

We now have 491 companies in, a 75% beat rate and a +6.0% broad surprise factor.

Q1 earnings are up 1.5% (2.9% ex-Energy) and are forecast to rise 0.9% in Q2 (0.9%) and 1.6% in Q3 (2.3%).

As a result, trailing EPS, currently $163.88, will only grow marginally during the next 6 months.

At this morning’s level of 2744, the S&P 500 Index is selling at 18.8 on the Rule of 20 P/E (16.7 actual trailing P/E). It troughed at 16,83 during last December’s correction which would be 2415 given current EPS and inflation numbers, an 18% drop from te May 1 high and the second near bear in 8 months.

image
SENTIMENT WATCH

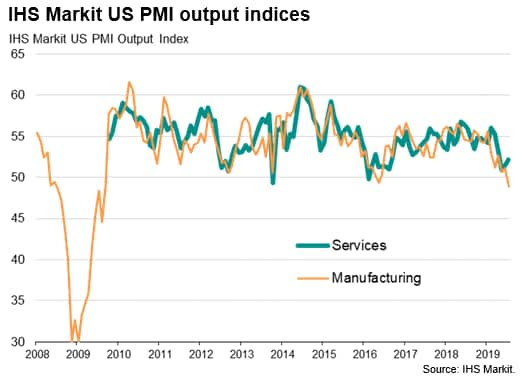
Sentimentrader points out the sharp drop in the AAII bull ratio even if the S&P 500 has only lost 5% from its 52-w high. It calls this “irrational pessimism”. That may prove right if something rational were to soon come out of DC but given the current trends in politics and the weak PMIs, particularly on new orders (manufacturing and services), I see nothing irrational in being scared by what’s going on.

image

Justice Department Prepares Antitrust Probe of Google The Justice Department is gearing up for an antitrust investigation of Alphabet’s Google, a move that could present a major new layer of regulatory scrutiny for the search giant.

(…) A Justice Department investigation would put Google—and potentially other tech giants—in an unwanted spotlight at a time when major internet companies already have seen their political fortunes turning, both in the U.S. and overseas.

The shift has come with multibillion-dollar antitrust fines for Google from the European Union. Facebook Inc. has come under intense fire over Russian use of its platform to meddle in the 2016 election. Policy makers also are increasingly skeptical of internet companies’ privacy practices, as well as their potential to create other public harm. (…)

The FTC created high expectations in its earlier Google investigation, but the company emerged largely unscathed. Some FTC staffers raised a variety of concerns internally about Google practices they believed to be anticompetitive, but they also said Google had strong procompetitive justifications for its actions and was focused on delivering services consumers liked.

The “evidence paints a complex portrait of a company working toward an overall goal of maintaining its market share by providing the best user experience, while simultaneously engaging in tactics that resulted in harm to many vertical competitors, and likely helped to entrench Google’s monopoly power over search and search advertising,” one 2012 FTC staff memo said. (…)

Justice Department antitrust chief Makan Delrahim has said there is nothing wrong with a large tech firm winning its dominance through innovation, but he has said companies must compete fairly to achieve and maintain their position.

“Antitrust enforcers may need to take a close look to see whether competition is suffering and consumers are losing out on new innovations as a result of misdeeds by a monopoly incumbent,” Mr. Delrahim said last year in a speech about digital platforms at the University of Chicago. (…)

THE DAILY EDGE: 31 MAY 2019

Tariffs on Mexico Over Immigration President Trump said the U.S. would impose escalating tariffs on Mexican imports beginning June 10, in an effort to push Mexico to stem the flow of asylum-seeking families to the border.

Reacting to what he described as “Mexico’s passive cooperation in allowing this mass incursion,” the president said the tariff on America’s third-largest trading partner would begin at 5% and grow steadily, hitting 25% on Oct. 1 unless Mexico takes satisfactory action to halt the migrants. (…)

“People don’t leave their homelands for pleasure but out of necessity,” Mr. López Obrador said. “I don’t lack courage, I’m not a coward or timid, but act out of principles. I believe in politics which, among other things, was invented to avoid confrontation and war.” (…)

The trade action also complicates Mr. Trump’s effort to win congressional ratification of the United States-Mexico-Canada Agreement, a trade deal intended to supersede the North American Free Trade Agreement.

“This is a misuse of presidential tariff authority and counter to congressional intent,” said Sen. Chuck Grassley (R., Iowa), chairman of the Senate Finance Committee. “I support nearly every one of President Trump’s immigration policies, but this is not one of them.” (…)

Business groups voiced alarm at the tariff plans, which they say could harm current and future trade agreements between the two countries and lead to retaliation against U.S. farm products and manufactured goods in the North American supply chain. (…)

“You can’t use trade as a weapon in areas like immigration and not think that you’re completely and totally violating the commitments you just made to another country on trade,” said Rufus Yerxa, president of the National Foreign Trade Council. “This is going to be devastating for the auto sector.” (…)

The U.S. imported $346.5 billion of Mexican goods in 2018, according to the Office of the U.S. Trade Representative. U.S. importers would pay more for Mexican products due to the tariffs, essentially a tax at the border, and likely pass a significant portion of the price hike on to consumers. Meanwhile, Mexican exporters, many linked to U.S. or international investors, in turn would come under pressure to lower prices or face a loss of customers to competing manufacturing economies world-wide. (…)

“If Mexico’s economy falls into recession, it will have fewer resources and ability to stop Central Americans or indeed its own people going north,” said Shannon O’Neil, a senior fellow for Latin America at the Council on Foreign Relations. (…)

(…) “One thing which Donald Trump has said which we know is true now is that he is a tariffs man. He sees tariffs as the solution to all kinds of problems. It’s just throwing the entire card table over, this is just saying we don’t play by anybody’s rules, we can use tariffs when we want.” (…)

It also dampens hopes for any resolution to the U.S.-China conflict, showing just how easily the U.S. administration resorts to tariffs, not just threats of tariffs, when they don’t get what they want.” (…)

“The consequences are therefore much bigger than just what happens to companies operating between the U.S. and Mexico or within NAFTA. This is a global concern.”

(…) businesses will be wondering who will be hit next in their supply chain.” (…)

From Goldman Sachs:

  • If tariffs on imports from Mexico as well as tariffs on List 4 imports from China are imposed, then a significant majority of US imports of some products would be subject to additional tariffs, such as computers and equipment (79%), TVs (84%), personal electronics (79%), and others.
  • Ultimately, we believe the potential impact of such a tariff would raise the cost of almost all vehicles (to some degree) given direct and indirect impacts to OEMs and suppliers; and without a response from manufacturers or the supply base to shift production footprints, this would likely increase the price of vehicles for the consumer and negatively impact OEM/supplier margins — as we maintain that any increase in costs from border adjustment, tariffs, et cetera, would likely be socialized throughout the automotive value chain.
China Plans ‘Major Retaliative Measures’ on U.S. for Huawei, Global Times Editor Says
Huawei bars employees from meeting US contacts Americans working in R&D at company’s China headquarters told to leave premises
China to Set Up ‘Unreliable Entity’ List After U.S. Huawei Ban

China said it will establish a list of so-called “unreliable” entities it says damage the interests of domestic companies, a sweeping order that could potentially affect thousands of foreign firms as tensions escalate after the U.S. blacklisted Huawei Technologies Co.

China will set up a mechanism listing foreign enterprises, organizations and individuals that don’t obey market rules, violate contracts and block, cut off supply for non-commercial reasons or severely damage the legitimate interests of Chinese companies, Ministry of Commerce spokesman Gao Feng said. Details of the list were not immediately available, though more will be announced “soon.” (…)

Meanwhile, in the real world:

China’s Factories Take a Bigger-Than-Expected Hit From U.S. Trade Battle Activity in Chinese factories slumped in May, as new orders for goods fell in response to uncertainties created by the escalating trade dispute with the U.S.

The official manufacturing purchasing managers index fell to 49.4 in May from 50.1 in April, the National Bureau of Statistics said Friday. (…) Subindexes of the purchasing managers index measuring new export orders—an indicator of external demand for Chinese goods—plunged to 46.5 in May from 49.2 in April, the official data showed. A subindex for new orders fell to 49.8 from 51.4. All are below the 50 mark, signaling a contraction in activity. (…)

A World Bank report released Friday said domestic demand is key if the Chinese economy is to sustain rapid growth. It estimates that the latest increase in U.S. tariffs on $200 billion of Chinese goods, which went into effect on May 10, would decrease China’s gross domestic product by about 0.2%. If the U.S. goes ahead with threats to impose tariffs on the remainder of its imports from China—more than $300 billion in goods—the World Bank report said that could reduce China’s GDP by an additional 0.5%.

From ING:

We believe that a contraction trend in manufacturing activity has formed as the manufacturing PMI has now fallen 3 months in a row and now even enters contraction territory. 

Our concern is not just on products affected by the tariffs, which we believe could have a longer impact on both the Chinese and US economy unless trade negotiations resume. 

We also worry about technology companies’ production. It is still too soon to evaluate the technology war’s impact on domestic manufacturing activity. The technology war is brewing even faster in May 2019, and could continue for the rest of the year. We expect the technology war to put pressure on manufacturing activity for the whole of 2019.

 Source: ING, Bloomberg
U.S. Personal Income and Outlays, April 2019

Personal income increased $92.8 billion (0.5 percent) in April according to estimates released today by the Bureau of Economic Analysis. Disposable personal income (DPI) increased $69.3 billion (0.4 percent) and personal consumption expenditures (PCE) increased $40.8 billion (0.3 percent). Real DPI increased 0.1 percent in April and Real PCE decreased less than 0.1 percent. The PCE price index increased 0.3 percent. Excluding food and energy, the PCE price index increased 0.2 percent.

image

Real Disposable Income is essentially flat YtD. Real expenditures are up 3.6% annualized YtD but only 1.4% including the important month of December. The only positive way to read real PCE is to look at Dec-Feb down 0.3% and hope there is a true change in momentum with Mar-Apr being up 0.9%.

But real income is flat, in spite of very quiet inflation and strong labor income. From these stats, labor compensation is rising 4.2% annualized YtD, up from 2.1% during the previous 4 months.

image

U.S., China firms scramble as new tariffs hurt business
How tariff hikes are squeezing the U.S. furniture business
Punch Fed Would Be Open To Cutting Rates if Outlook Darkens Central bank’s vice chairman, Richard Clarida, says any persistent inflation shortfall would also prompt policy reassessment

(…) “And if we saw a downside risk to the outlook, then that would be a factor that could call for a more accommodative policy.” (…)

“We think some of that [inflation], a lot of that may be transitory, but the reality is it has been softer,” he said. (…)

Fed officials would reassess that stance “if the incoming data were to show a persistent shortfall in inflation below our 2% objective, or were it to indicate that global economic and financial developments present a material downside risk to our baseline outlook,” he said. (…)

While the U.S. economy isn’t as exposed as others to shifts in global demand, “when there is a slowdown in the rest of the world, it does show up in our data,” Mr. Clarida said. (…)

The FT notes that

Mr Clarida’s willingness to discuss the possibility of rate reductions marks a change of tone from the Fed’s recent communications, where the central bank has emphasised its “patient” stance. Minutes to the Fed’s most recent rate-setting meeting did not record an explicit discussion about the possibility of lowering rates.

From the above PCE stats, core inflation did accelerate from zero in Jan-Feb, to +0.1% in March and to +0.2% in April. From the FOMC’s viewpoint, the trend is your friend. Nonetheless, last 4 months: +0.9% annualized.

INITIAL CLAIMS STILL QUIET:

image

Mortgage Rates Fall Below 4%, Lifting Hopes for Housing Rebound
Auto Money Uber Cites Tight Competition After Posting $1 Billion Loss Uber executives sought to reassure investors about its growth as an onslaught of competition from ride-hailing and delivery rivals led to a $1 billion loss in the first quarter.

Uber’s loss from operations was $1.03 billion, wider than the $478 million reported a year earlier, as its sales and marketing costs jumped 54%, driven by increased consumer promotions as well as by advertising and marketing head count.

Simultaneously, Uber’s revenue growth continued to shrink. Its revenue from ride-hailing and delivery—minus some incentive payments to drivers and other costs—was $2.62 billion, up 10% from a year ago. By contrast, in the year-earlier quarter, this core revenue on an adjusted basis grew by about 80%. (…)

Since it began operations in 2010, Uber has grown to the point where it now collects over $45 billion in gross passenger revenue, and it has seized a major share of the urban car service market. But the widespread belief that it is a highly innovative and successful company has no basis in economic reality.

An examination of Uber’s economics suggests that it has no hope of ever earning sustainable urban car service profits in competitive markets. Its costs are simply much higher than the market is willing to pay, as its nine years of massive losses indicate. Uber not only lacks powerful competitive advantages, but it is actually less efficient than the competitors it has been driving out of business.

Uber’s investors, however, never expected that their returns would come from superior efficiency in competitive markets. Uber pursued a “growth at all costs” strategy financed by a staggering $20 billion in investor funding. This funding subsidized fares and service levels that could not be matched by incumbents who had to cover costs out of actual passenger fares. Uber’s massive subsidies were explicitly anticompetitive—and are ultimately unsustainable—but they made the company enormously popular with passengers who enjoyed not having to pay the full cost of their service. (…)