That was a relief report, no doubt about it. Employment being a coincident indicator, June’s 224k new jobs after May’s 72k reduces the probability that the U.S. is already, and unknowingly, in recession like some economists claim. But it puts more pressure on FOMC members to figure out what’s really going on.
I am way down on Trump’s list for Fed candidates so I can look at trends with a rather detached eye. The Household Survey (HS-blue line) shows employment growth slowing much faster than the more widely followed Payroll Survey (PS). So is the growth in employment for the important 25-54-year main breadwinners. These lines will eventually meet again and let’s hope that the more volatile HS line (+0.7% YoY in Q2) is the one reaching out.


Employment for the 25-54-yr group has actually been negative 168k since December.

Some economists consider employment trends in Temporary Help Services companies a leading indicator. This recent lull is more suspect than the early 2016 episode which was mainly energy driven.

I focus on Americans’ buying power and the growth in the index of nominal aggregate weekly payrolls (employment x hours x wages) has dipped to a 3.2% annualized rate in Q2. Fortunately (!), inflation has also slowed recently, preserving real spending power, even while the Fed is desperately trying to push inflation up.

The bond market seems to have a clue. Treasury yields have plummeted from 3.2% last November 8 to below 2.0%, even following the Powell pivot. It looks like fixed income investors are focusing on trends discussed in my Friday post (No Economic Fireworks) and on these other trends detailed by Markit:
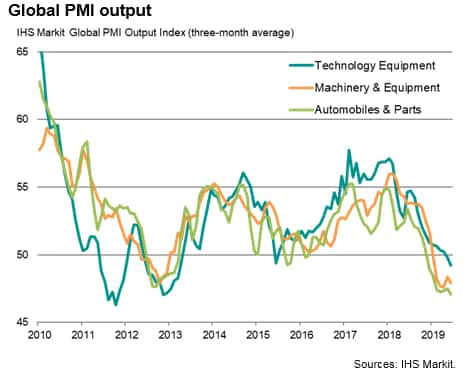
(…) Production of machinery and equipment fell in June to an extent exceeded only once (last February) since detailed global sector PMI data were first available in late-2009. Output of this sector has fallen continually so far this year, representing the worst performance since the global financial crisis.
Production of tech equipment meanwhile dropped at the sharpest pace since November 2012, down for the third time over the past four months.
A broader PMI gauge of global investment goods production showed a similar weakness, with output down for a sixth month in June. Although some easing in the rate of decline was evident in the latest month, the average drop in output in the three months to June was the steepest calendar quarter decline since the final three months of 2012 (a downturn which was subsequently followed by a drop in official global fixed capital investment data). Official data have already shown annual global business investment growth cooling sharply up to the first quarter of the year, running at less than half the pace seen a year earlier, closely following the trend in the PMI data. The survey data therefore point to a further moderation in the second quarter.
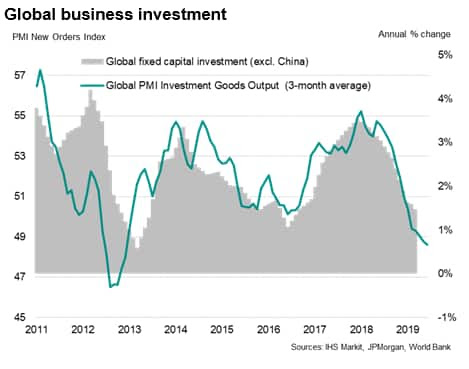
The downturn in capex spend signalled by the global PMI data highlights the extent to which rising geopolitical uncertainty has led to a broad pull-back in business spending which is likely to subdue economic growth. However, with business investment being a major determinant of future productivity and profitability, the drop in capex spend signalled is a particular red flag for future corporate earnings.
Another sector of concern is automobiles, which sat at the foot of the global sector PMI rankings in June as output fell at the second-steepest rate since 2009.
The survey data indicate that car sector output has now fallen continually since last September. However, whereas declines late last year were in part caused by temporary disruptions such as new emissions regulations in Europe (which many therefore saw as being temporary), the ongoing weakness in 2019 paints a more worrying picture of weakening demand for autos.
Other indicators added to the auto sector gloom: the sector’s PMI new orders index signalled a further steep decline in business inflows, leading to a sharp drop in car industry order book backlogs.
Such a weakening of orders books often leads to cuts in employment, so it was little surprise to see employment falling in the autos sector in June, with jobs being lost globally at the sharpest rate for over two years.
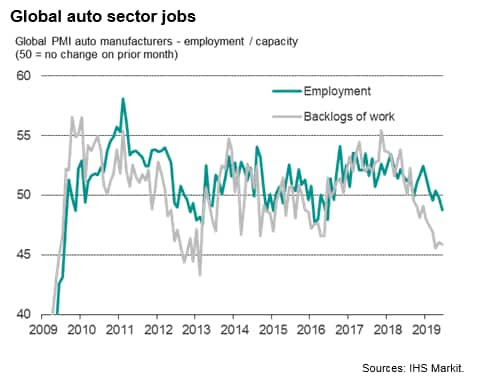
With the June survey also seeing a record drop in input buying by auto makers, a further cut in production is indicated for July. (…)
So the June 17k spike in manufacturing employment will be scrutinized in the next 2 months. Revisions in the last 3 months were downward, as were revisions for total payroll employment, generally not a positive sign for the economy in general.
From Markit’s June PMI Manufacturing Survey, polling real business people in the thick of it:
June data signalled a further near-stagnation of operating conditions across the U.S manufacturing sector. The rate of overall growth held close to May’s near-decade low. On a positive note, the rate of output growth quickened slightly amid a renewed rise in new orders. (…) Uncertainty surrounding future output growth weighed on hiring decisions among goods producers, with the rate of job creation softening to the least marked since August 2016. Expectations of production growth over the coming year remained solemn and among the weakest in the survey history in June. Manufacturing firms often raised concerns surrounding tariffs and the softer trend in new orders.
Here’s a chart of manufacturing employment per the latest PS. Notice the difference with August 2016 at the far left, just to keep your spirits tempered:

David Rosenberg is among the most vocal economists claiming that the U.S. is already in recession (Gary Shilling is another one). He has serious doubts about these payroll numbers:
In fact, since February, nearly every single job that has been added to nonfarm payrolls has come via the birth-death model – employment growth from the actual sample of firms in the survey has completely stalled out.
His point finds support from the Household Survey which shows flat employment year-to-date (second chart above). Even more so given that June was up 247k, including a low 31k in the private sector following –172k in the previous 3 months. Per the HS, the private sector has cut 141k jobs in the last 4 months.
To preach to non-subscribers, Rosie uses the Twitter megaphone:
I’ll share a well kept secret. The aggregate-hours worked index for all of Q2 slowed to a mere 0.6% SAAR from 1.8% in Q1. This is the weakest quarter since…Q4 of 2009! Just to reiterate. The term ‘head fake’ was coined precisely for the sort of employment report we received today. You’ll soon be scurrying to buy those bonds you sold today. (@EconguyRosie)
Here’s the chart:

But even more worrying is the quarterly decline in production workers’ hours. Naturally, employers tend to shrink hours before giving the pink slip, especially in such a tight labor market where skill is a precious commodity.

Let’s drill down the employment well a bit further. This was released July 3rd:
U.S.-based employers announced plans to cut 140,577 jobs from their payrolls in the second quarter of this year, down 26% from the 190,410 cuts announced in the first quarter. Despite the drop, Q2 cuts are 34% higher than the 104,800 cuts announced in the same quarter last year, according to the latest report on job cuts released Wednesday from global outplacement and business and executive coaching firm Challenger, Gray & Christmas, Inc.
Last quarter’s total is the highest for the second quarter since 2015, when 147,458 cuts were recorded. So far this year, employers have announced plans to cut 330,987 jobs, a 35% increase from the 245,179 cuts announced through the first half of last year. This year marks the highest first-half total since 2009, when 896,675 job cuts were announced.
“The second quarter is historically the slowest period for job cut plans. Companies typically have not determined staffing decisions by this point, either because they are in the middle of or are only approaching their fiscal year’s end by June,” said Andrew Challenger, Vice President of Challenger, Gray & Christmas, Inc.
Employers announced 41,977 cuts in June, down 28% from the 58,577 cuts announced in May. Despite the monthly drop, June’s cuts are 13% higher than the 37,202 cuts announced in June of last year. This is the eleventh consecutive month job cuts are higher than the corresponding month the year prior.
“Job cuts are trending higher overall. In addition to Retail, we’ve seen significant cuts in the Industrial Manufacturing and Automotive sectors in recent months,” said Challenger. (…)
Companies in the Industrial Goods sector have announced 47,651 cuts, 562% higher than the 7,194 announced through June of 2018. Meanwhile, Automotive makers and suppliers announced plans to cut 32,350 jobs through June, a 190% increase over the 11,165 cuts announced in the first six months of 2018. (…)
Companies in the Technology sector announced 21,777 job cuts through June, up 266% from the 5,942 cuts announced in the same period last year. (…)
Layoff announcements from the Automotive, Industrial, Technology and Aerospace/Defense sectors aggregate YtD 106k through June, 3.8x last year’s number, and account for 33% of all announced layoffs this year, up significantly from 11% last year. It looks like employers are now resigned to part with skilled employees.
These are layoff announcements, which should eventually show up in weekly initial unemployment claims before impacting actual monthly employment numbers. Not visible as of the end of June:

I will ask President Trump to take my name off the list for Fed nominee…
He’s probably right on that!
But as far as his July 2nd tweet goes…
…the Association Of American Railroad would probably question that:


Of the 20 categories that the AAR monitors, 16 are in the red for both the first 6 months and the month of June. Virtually every good produced and sold in the U.S. must be transported by rail and/or truck. Intermodal traffic is currently weaker than in 2017 while truck freight is nose diving.


In all, it seems safer to side with the bond market, not unlike most investors do as Refinitiv shows:

Relief coming?
Missing Spending Stimulus Weighs On U.S. Growth The economy was supposed to get a lift this year from higher government spending enacted in 2018, but so far much of that stimulus hasn’t shown up, puzzling economists.
(…) The level of the federal component of GDP in the first quarter of 2019 was $78 billion, or 0.4%, lower than what forecasters expected it would be following the February 2018 budget deal, Ernie Tedeschi, an economist at Evercore ISI, estimated.
The government is spending much less on disaster relief than it did in fiscal 2017, and a partial shutdown temporarily stalled outlays in January. Those factors explain about one-third of the missing stimulus, Mr. Tedeschi said. The rest appears to be slower spending by the federal government than previously estimated. (…)
Commerce Department data suggests the drop-off actually began at the end of 2018, almost entirely because of weaker nonmilitary spending. (…)
Part of the spending miss can be explained by a CBO forecasting quirk: The agency assumed the government would keep spending the same amount on emergencies as it did in fiscal 2017, when several major hurricanes prompted a large increase in disaster aid. That spending slowed in 2018 and 2019. (…)
Other factors could be at play. The budget deal, which affected fiscal years 2018 and 2019, didn’t come together until almost six months into the fiscal year, which may have complicated agencies’ ability to plan for the increase and spend the money. That means spending could show up later this year. (…)
CANADA: HOW DO YOU SPELL RELIEF
The Canadian economy has surprised on the upside so far in 2019 and a new source of impetus is about to hit in the coming months via falling interest rates. The best rate available for a five-year mortgage (fixed term) has dropped a whopping 70 basis points since the start of the year and now stands at a two-year low of 2.6%. Recall that mortgages set to renew in 2019 carried an effective rate of 3%. This means that current homeowners renewing in H2 2019 should enjoy a LOWER mortgage rate. Looking at the affordability perspective, a 40 basis point decline would represent a relief of $100 per month for a $500,000 mortgage. If the global economy doesn’t slow too much, Canada should do well in the coming months. (NBF)

EARNINGS WATCH
From Refinitiv/IBES:
Through July 5, 21 companies in the S&P 500 Index have reported earnings for Q2 2019. Of these companies, 85.7% reported earnings above analyst expectations and 14.3% reported earnings below analyst expectations. In a typical quarter (since 1994), 65% of companies beat estimates and 20% miss estimates. Over the past four quarters, 76% of companies beat the estimates and 18% missed estimates.
In aggregate, companies are reporting earnings that are 6.6% above estimates, which compares to a long-term (since 1994) average surprise factor of 3.3% and the average surprise factor over the prior four quarters of 5.3%.
The estimated earnings growth rate for the S&P 500 for 19Q2 is 0.0%. If the energy sector is excluded, the growth rate improves to 0.2%. The estimated revenue growth rate for the S&P 500 for 19Q2 is 3.4%. If the energy sector is excluded, the growth rate improves to 3.9%.
If you are relieved by the strong beat rate and surprise factor, please also consider that the 21 companies that have already released Q2 numbers have seen their profits collapse 11.2% YoY, worse than the –4.6% drop in Q1 and a total reversal from the +19.6% recorded in Q4’18.
Analyst estimates keep being ratcheted down, small and large caps alike:


Equity investors are again flirting with overvaluation per the Rule of 20, generally prompted by the China/USA trade ping-pong game and the hope of Fed easing. At some point, people might get tired of this back and forth between hope and despair and decide to get back to fundamentals. There are not that many things that can boost P/Es at this point, are there?. Q2 earnings and guidance should be the focus for the next 4 weeks and we are not off to a strong start…

TECHNICALS WATCH
Lowry’s Research says that “despite the deceleration of the rally in the 2nd quarter, the forces of Supply and Demand continued to suggest that the market’s primary trend is still up” and that “there was little evidence during the 2nd quarter of the rising Supply that typically occurs in the last stages of a bull market. (…) In recent days, the positive spread
between Buying Power and Selling Pressure has widened to its best levels in nearly 2 months.”
SENTIMENT WATCH
(…) Profit forecasts remain too optimistic, as measures of manufacturing health around the world keep deteriorating, strategists including Andrew Sheets wrote in a note Sunday. Expectations for looser central bank policy are high, leaving little to boost already elevated equity prices, they said.
“We see a market too sanguine about what lower bond yields may be suggesting – a worsening growth outlook,” they wrote. “Continued deterioration in global PMIs suggests a macro environment with plenty of downside risks.” (…)

 CHAIN OF EVENTS?
At the G20 in 2018:
Trump turns around to the Turkish president, Recep Erdogan, and says, ‘Except for Erdogan over here. He does things the right way,’ and then actually fist-bumps the Turkish president.” (CBS)
At the recent G20:
The US President was photographed standing between Erdoğan and Crown Prince Mohammad Bin Salman during the G20 summit Friday. Trump has a breakfast with the Saudi crown prince before a sit down with the Turkish leader.
During his meeting with Trump, Erdogan said “our strategic partnership requires solidarity in many fields.” (CNN)
Last Saturday:
Yesterday:
(…) If the Fed “knew what it was doing” it would cut rates, Trump told reporters before he boarded Air Force One in Morristown, New Jersey, to return to Washington after a weekend at his nearby golf club. Fed policy is putting the U.S. at a disadvantage versus Europe and suppressing gains in the stock market, Trump said.
Sunday’s comments came after Trump said on Friday that the central bank “doesn’t have a clue” and was “our most difficult problem.” (…)
Speaking of friends:
Boeing Loses MAX Deal to Airbus Saudi airline says it will buy up to 50 Airbus jets, worth more than $5.5 billion


(…)


